
Experiments in
web scale data
Big Data Beers
November 17, 2014
November 17, 2014
We're a non-profit that makes
web data
accessible to anyone
Each crawl archive is billions of pages...
September crawl archive was
2.98 billion web pages
~220 terabytes uncompressed
Released
totally free
Lives on AWS S3 (Public Data Sets)
We're the largest public user of
What makes us most excited?
Experiments!
The Formats of the Crawl Archive
- WARC
+ raw HTTP response headers
+ raw HTTP responses
- WAT (1/3rd size of WARC)
+ HTML head data
+ HTTP header fields
+ Extracted links / script tags
- WET (1/10th size of WARC)
+ Extracted text
+ raw HTTP response headers
+ raw HTTP responses
+ HTML head data
+ HTTP header fields
+ Extracted links / script tags
+ Extracted text
The WARC in Detail
WARC = Web ARChive
Wrappers exist for many languages
[Python, Java, Go, ...]
If they don't, it's still just gzip!
Random Access Archives w/ WARC
gzip spec allows for gzip files to be stuck together
gzip + gzip + ... + gzip + gzip
Why are we interested in this?
☑ Re-uses existing data format + tools
☑ Advantages of per object compression (10% larger than full gzip)
☑ Partition into optimal sized collections (Hadoop / S3)
☑ Allow random access to individual objects
Random Access Archives w/ WARC
In an optimal world,
everything would be in RAM
For one dollar an hour...
-
EC2 RAM = 87 GB
-
EC2 Disk = 10,685 GB
-
S3 (standard) = 24,000 GB
-
S3 (reduced) = 31,000 GB
We can get most random access advantages w/ S3
(see: byte range requests)
Derived Datasets
-
Web Data Commons (WDC)
Hyperlink graph
Web tables
RDFa, Microdata, & Microformat
-
N-gram counts and language models from the CommonCrawl
-
GloVe: Global Vectors for Word Representation
Hyperlink graph
Web tables
RDFa, Microdata, & Microformat
Example Experiments
- Nature of the web with a single machine:
+ Analysing the hyperlink graph
- Using a full cluster to perform larger analysis:
+ Recreating Google Sets using web tables
+ The impact of Google Analytics
+ Analysing the hyperlink graph
+ Recreating Google Sets using web tables
+ The impact of Google Analytics
Hyperlink Graph Experiment
Imagine you wanted to analyze how pages link to each other across the web
-
Generate the hyperlink graph
-
Compute PageRank over it
Generating the Graph
Which data format? WAT [metadata]
All links [link text, URL, type (a href, img, CSS, JS)])
Map: output each (a → b) hyperlink
Reduce: remove / count duplicates
Generating the Graph
Key question: how long and how much?
Approx $30 (spot instances) for 1000 instance hours
(100 m2.xlarge machines for 10 hours)
Resulting dataset size:
- Host level (x.com): ~10GB
101 million nodes + 2 billion edges
- Page level (x.com/y/z.html): ~500GB
3.6 billion nodes + 128 billion edges
101 million nodes + 2 billion edges
3.6 billion nodes + 128 billion edges
Or avoid all of this..!
Web Data Commons Hyperlink Graph
2012: 3.6 billion pages, 128 billion links
April 2014: 1.7 billion pages, 64 billion links
They've performed in-depth analysis as well:
http://webdatacommons.org/hyperlinkgraph/
Calculating PageRank
PageRank can require lots of resources to compute when processing non-trivial graphs
-
Hadoop is bad for iterative algorithms
(Spark offers a potential solution, but ...)
- Running many compute nodes is expensive and computationally complex
(Spark offers a potential solution, but ...)
FlashGraph
Optimized graph processing engine using SSDs
Comes with various algorithms:
PageRank, weakly connected components, etc...
Performs as well as a cluster using a single machine
(full details: "FlashGraph: Processing Billion-Node Graphs on an Array of Commodity SSDs")
Performance of FlashGraph
Sometimes scaling up >> scaling out
PageRank on the 3.6 billion page graph takes
under 75 minutes
on a powerful single machine*
* Very powerful -- larger than any EC2
Processing with FlashGraph
When running domain level PageRank,
it takes longer to load than to process!
PageRank on 100 million nodes + 2 billion edges:
3 minutes
Total cost:
Well under a Euro
(EC2 spot instances!)
Example Experiments
- Nature of the web with a single machine:
+ Analysing the hyperlink graph
- Using a full cluster to perform larger analysis:
+ Recreating Google Sets using web tables
+ The impact of Google Analytics
+ Analysing the hyperlink graph
+ Recreating Google Sets using web tables
+ The impact of Google Analytics
Recreating Google Sets
Task: Given a word or set of words, return words related to them
Querying ["cat"],
returns ["dog", "bird", "horse", "rabbit", ...]
Querying ["cat", "ls"],
returns ["cd", "head", "cut", "vim", ...]
Extracting the Tables
Data Format: WARC (need raw HTML)
Map:
Extract tables [column names + contents] from the HTML pages
Reduce:
Remove duplicates / tables with too few entries
Filter:
Only keep those that appear "relational"
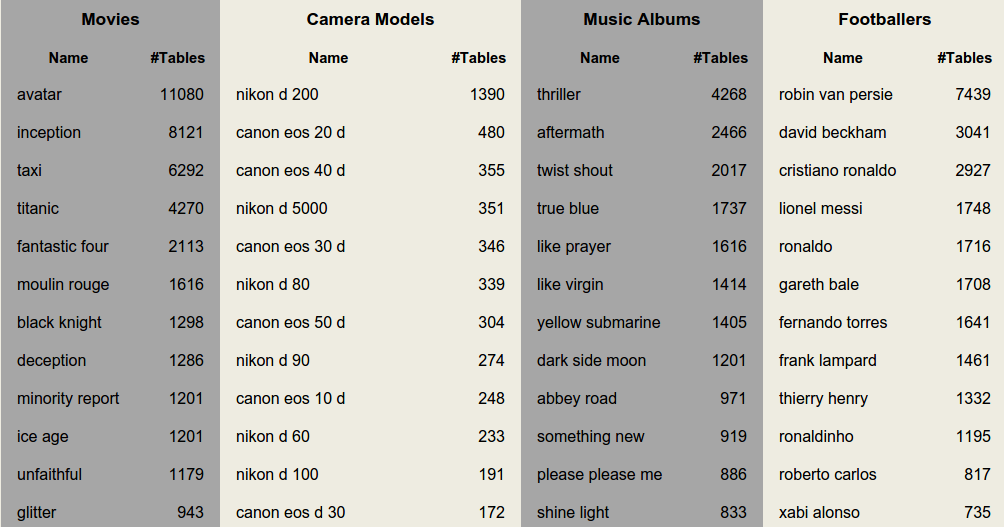
Example: WDC Web Tables
Filtered from 11.2 billion tables via trained classifier
Only 1.3% of the original data was kept,
yet it still remains hugely valuable!
147 million relational web tables from 2012 corpus
Popular column headers: name, price, date, title, artist, size, location, model, rating, manufacturer, country ...
Example: WDC Web Tables
Example Experiments
- Nature of the web with a single machine:
+ Analysing the hyperlink graph
- Using a full cluster to perform larger analysis:
+ Recreating Google Sets using web tables
+ The impact of Google Analytics
+ Analysing the hyperlink graph
+ Recreating Google Sets using web tables
+ The impact of Google Analytics
Measuring the Impact:

1) How many websites is Google Analytics (GA) on?
2) How much of a user's browsing history does GA capture?
Insight for GA Analysis
Referrers allow for easy web tracking when done at Google's scale!
No information
!GA → !GA
Full information
!GA → GA
GA → !GA → GA
Google only needs one in every two links to have GA in order to have your full browsing path
Method for GA Analysis
Google Analytics count: ".google-analytics.com/ga.js"
www.winradio.net.au NoGA	1
www.winrar.com.cn GA	6
www.winratzart.com GA	1
www.winrenner.ch GA	244
www.winradio.net.au NoGA 1 www.winrar.com.cn GA 6 www.winratzart.com GA 1 www.winrenner.ch GA 244
Generate link graph
domainA.com -> domainB.com <total times>
cnet-cnec-driver.softutopia.com -> www.softutopia.com 24
domainA.com -> domainB.com <total times>
cnet-cnec-driver.softutopia.com -> www.softutopia.com 24
Merge link graph & GA count
Method for GA Analysis
Use WARC format to find specific HTML script fragments for identifying if a site has GA*
Use WAT format for generating the link graph and total link count*
* For most JS analysis, the WAT file contains the name of the JS file linked to
** WDC Hyperlink Graph does not contain counts
Results of GA Analysis
29.96% of 48 million domains have GA
(top million domains was 50.8%)
48.96% of 42 billion hyperlinks leaked info to GA
That means that:
1 in every 2 hyperlinks leak information to Google
Wider Impact of GA Analysis
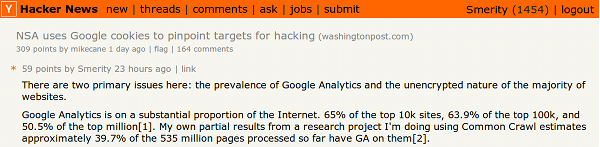

Wide Reaching Possibilities
These experiments have been done before:
they give you an idea of what's possible
Find your own insight or question, then
follow it!
Using Wikipedia to annotate the web
Wikipedia: "small" but well annotated resource
How can we use that for the rest of the web?
Use Wikipedia annotated data
[Brahms, German composer, born on 7 May 1833]
to train NLP parsers using text from the web
Connect pages or domains that have similar linking patterns (implies they cover the same topics)
Who Links to Wikipedia?
Find all pages that link to Wikipedia across the web
including the text used to link to Wikipedia
Task: Aggregate the link text and URL
Even with Wikipedia's referrer log,
this is a complex task...
Who Links to Wikipedia?
Data Format: WAT [links + link text]
Map:
For each link, check for *.wikipedia.org
If found, export
Key=(wiki URL), Value=(page URL, link text)
Reduce:
Key=(wiki URL), Value=[(URL, text), ...]
Challenge Yourself
There's an amazing dataset at your fingertips,
and getting started has never been simpler!
Get started with the:
Java starter kit for Hadoop
Python starter kit using mrjob
Check out commoncrawl.org
Download the Python or Java starter kits
Stephen Merity
stephen@commoncrawl.org
stephen@commoncrawl.org
If You Know a Lecturer...
Universities should teach big data courses with ...
big data
English Wikipedia
= 9.85 GB compressed
= 44 GB uncompressed
If "big data" isn't bigger than your phone's storage ...
Experiments in web scale data
By smerity


