Welcome to Data Mining
With :

BOUDALI Soheib
Etudiant M2 AI USTHB
Fondateur de Blactus Technologies
Powered by : Blactus Technologies
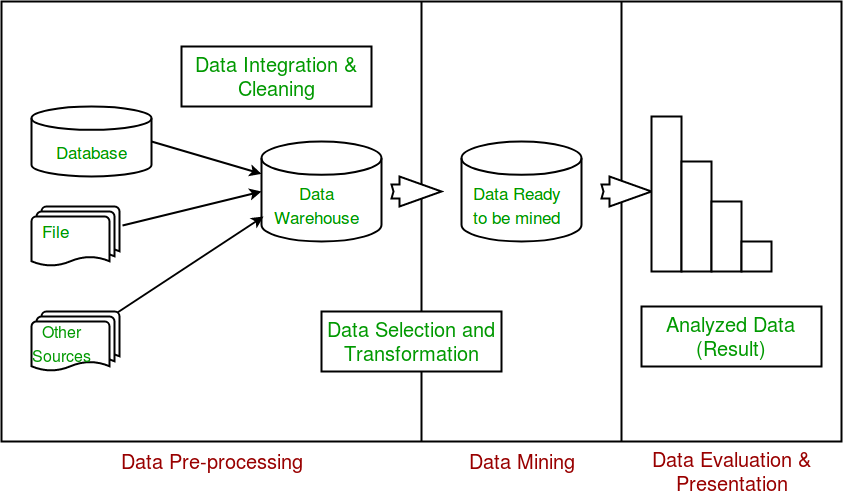
What's DM !
DM USAGE
HOW !
Data exploration
DATASET Manipulation
Data set opening , reading and printing
file=open("dataset_name","r",encoding="utf-8")

dataset=file.readlines()

for line in dataset:
	print(line)
Extract attributes type
- float
- string
- ...
Explore descriptive characteristics of the data
- Symmetry study :
Mean
Mode
Median
Min
Max
import numpy as np
mean=np.mean(array)
import numpy as np
mean=np.median(array)
from scipy import stats
mode =stats.mode(array)
Min= min(array)
Max= max(array)
import pickle
import numpy as np
from scipy import stats

pkl_file = open('heart.pkl', 'rb')
dataset= pickle.load(pkl_file)
pkl_file.close()

column=3

array=[]

for i in range(0,len(dataset)):
	array.append(dataset[i][column])


mean=np.mean(array)
median= np.median(array)
mode =stats.mode(array)
Min= min(array)
Max= max(array)

print("la moyenne est :"+str(mean)+"\n"+"la mediane est : "+str(median)+"\n"+" le mode est: "+str(mode)+"\n")
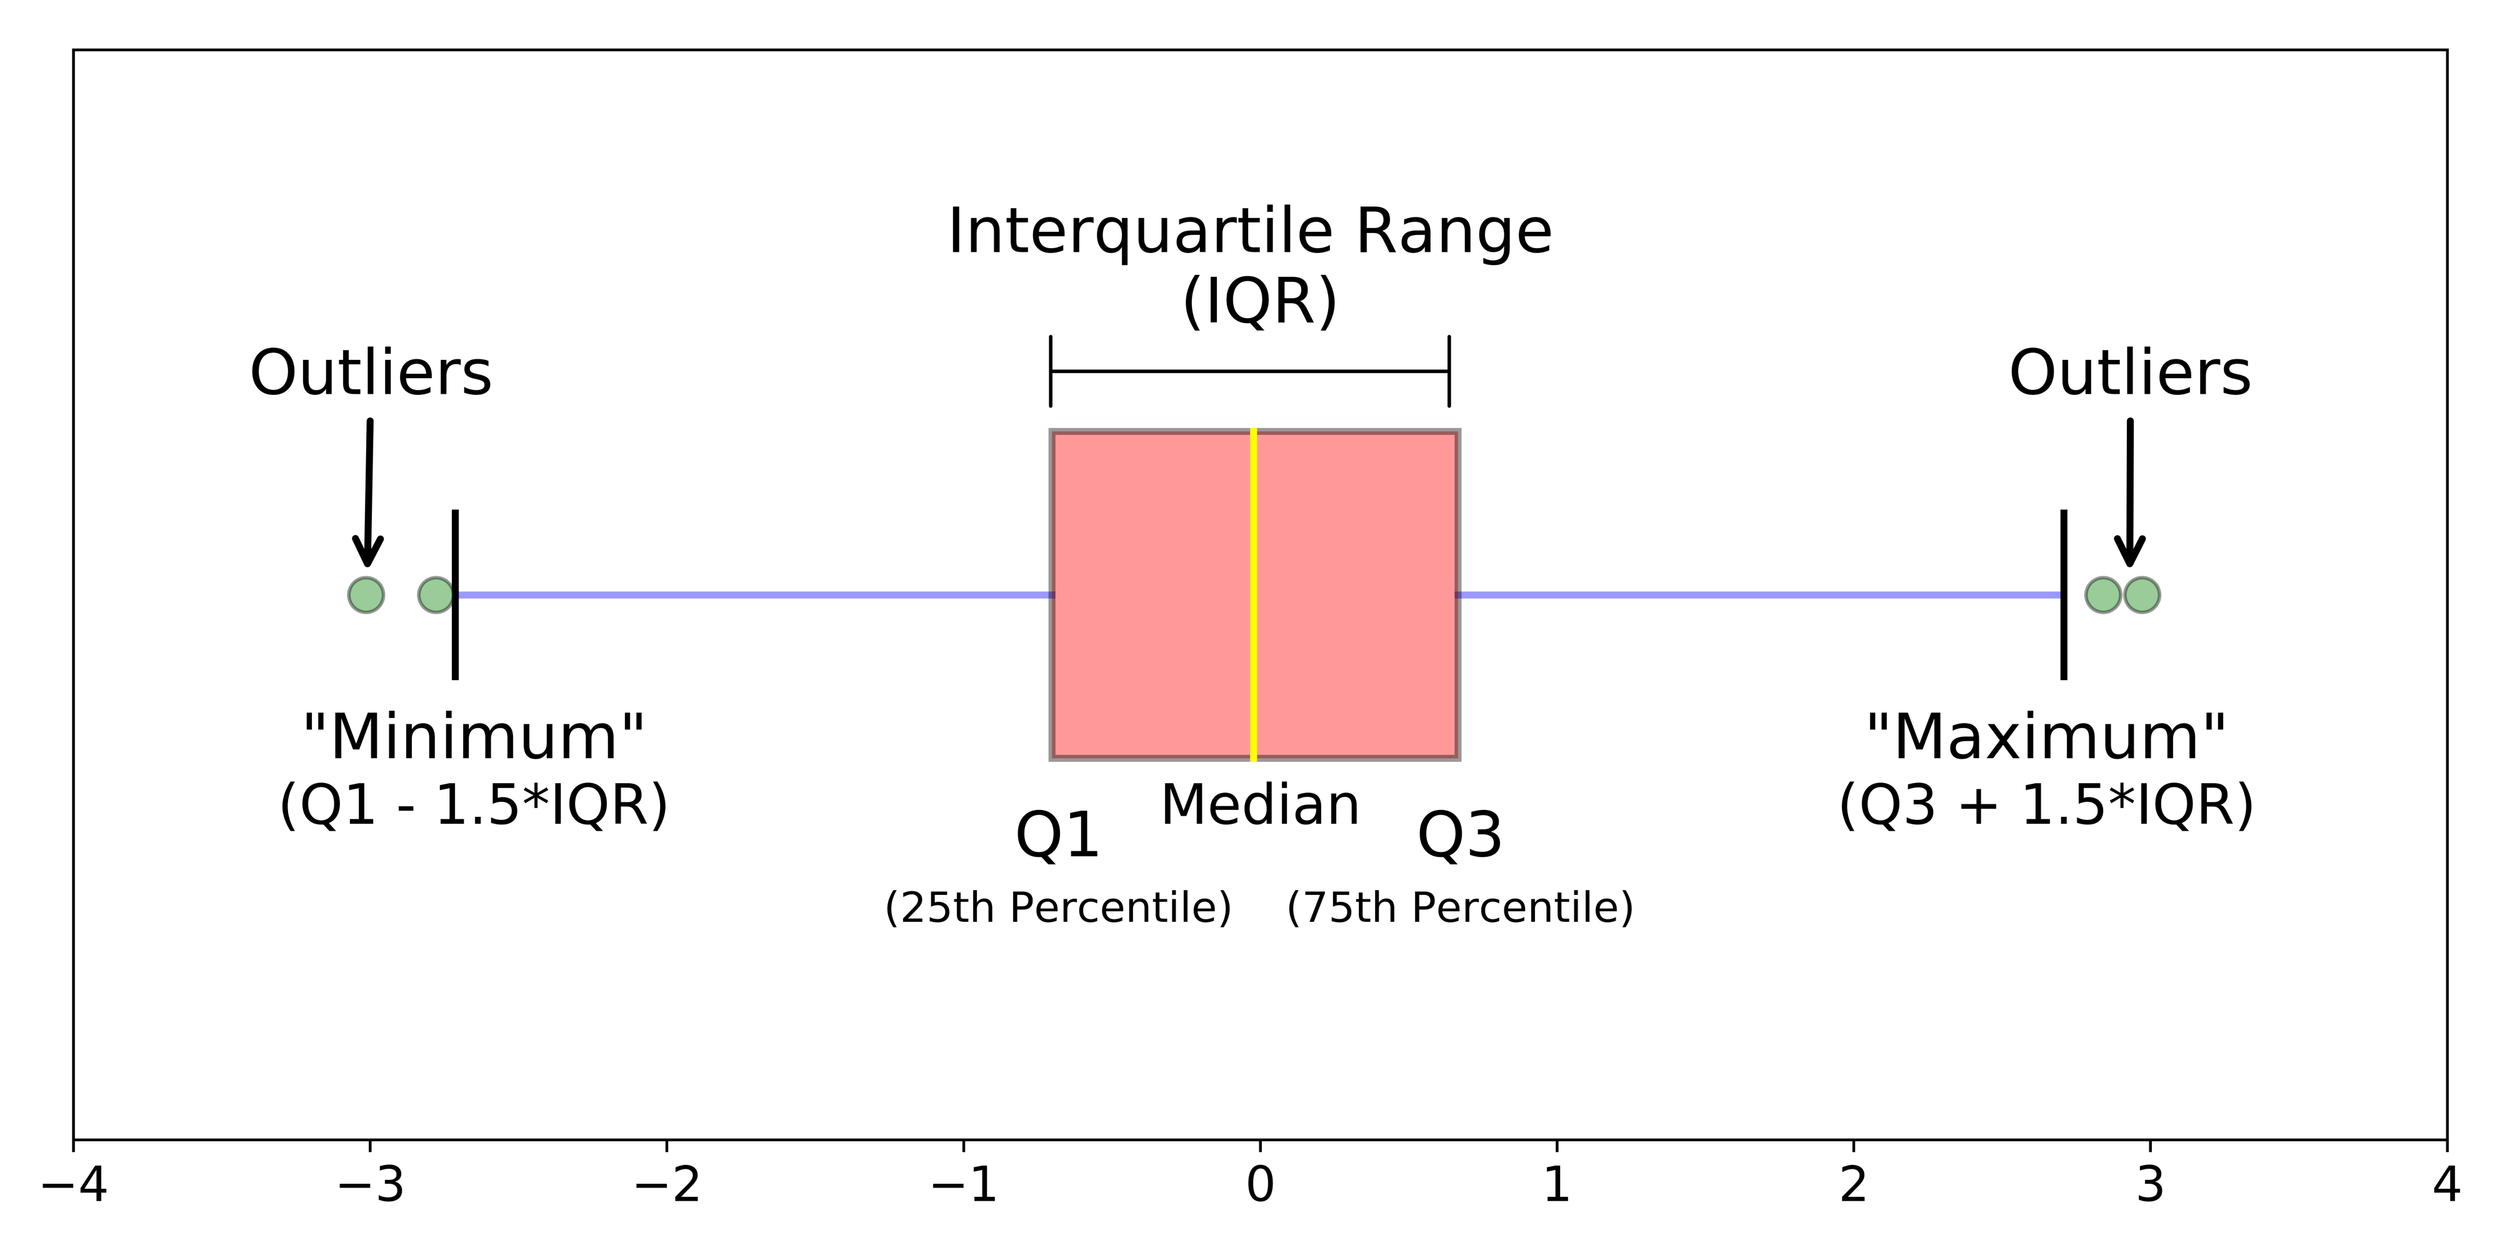
Data visualisation
Boxplot
Data visualisation
Histogram

Data visualisation
Scatter plot

import pickle
import numpy as np
import matplotlib.mlab as mlab
import matplotlib.pyplot as plot

def boxplot(Attribute):
	pkl_file = open('heart.pkl', 'rb')
	dataset= pickle.load(pkl_file)
	pkl_file.close()

	data=[]

	Attributes_names=['Age','Sex','Chest','Resting_blood_pressure','Serum_cholestoral','Fasting_blood_sugar','Resting_electrocardiographic_results','Maximum_heart_rate_achieved','Exercise_induced_angina','Oldpeak','Slope','Number_of_major_vessels','Thal']

	for i in range(0,len(Attributes_names)):
		if Attributes_names[i]==Attribute:
			for instance in dataset:
				data.append(float(instance[i]))


	fig1, ax1 = plot.subplots()
	ax1.set_title(Attribute)
	ax1.boxplot(data)
	plot.show()

def hist(Attribute):
	pkl_file = open('heart.pkl', 'rb')
	dataset= pickle.load(pkl_file)
	pkl_file.close()

	data=[]

	Attributes_names=['Age','Sex','Chest','Resting_blood_pressure','Serum_cholestoral','Fasting_blood_sugar','Resting_electrocardiographic_results','Maximum_heart_rate_achieved','Exercise_induced_angina','Oldpeak','Slope','Number_of_major_vessels','Thal']

	for i in range(0,len(Attributes_names)):
		if Attributes_names[i]==Attribute:
			for instance in dataset:
				data.append(float(instance[i]))


	fig1, ax1 = plot.subplots()
	ax1.set_title(Attribute)
	ax1.hist(data)
	plot.show()

def scatter(Attribute1 , Attribute2):
	pkl_file = open('heart.pkl', 'rb')
	dataset= pickle.load(pkl_file)
	pkl_file.close()

	data1=[]
	data2=[]

	Attributes_names=['Age','Sex','Chest','Resting_blood_pressure','Serum_cholestoral','Fasting_blood_sugar','Resting_electrocardiographic_results','Maximum_heart_rate_achieved','Exercise_induced_angina','Oldpeak','Slope','Number_of_major_vessels','Thal']

	for i in range(0,len(Attributes_names)):
		if Attributes_names[i]==Attribute1:
			for instance in dataset:
				data1.append(float(instance[i]))
		if Attributes_names[i]==Attribute2:
			for instance in dataset:
				data2.append(float(instance[i]))


	fig1, ax1 = plot.subplots()
	ax1.set_title(Attribute1+" "+Attribute2)
	ax1.scatter(data1,data2, facecolor='blue', alpha=1)
	plot.show()
	return np.corrcoef(data1, data2)


print(scatter("Age" , "Resting_blood_pressure"))
DM Techniques
PART 1 : FREQUENTE ITEMS
Data discretization : (Equal intervals)
- Choose the number of partition
- Calculate the diffirence between Min and Max
- Split the interval on the number of partition and assign your data to there partitions
For more informations visit : http://magrit.cnrs.fr/docs/discretisation_fr.html
PART 1 : FREQUENTE ITEMS
Apriori
Two parametres
Min_support
Min confidence
Eclat
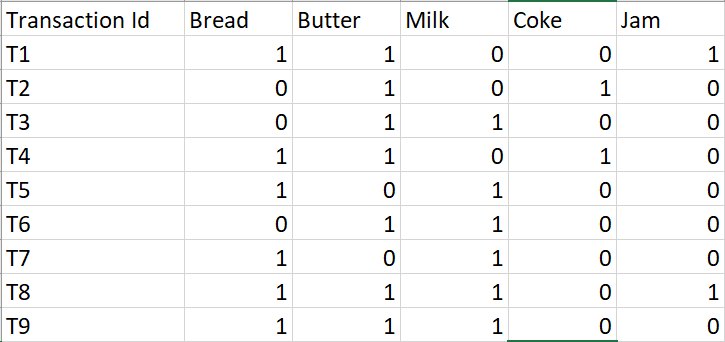
PART 1 : FREQUENTE ITEMS
Apriori
Exemple :
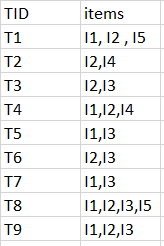
minimum support count is 2
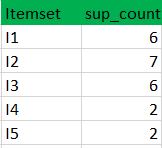
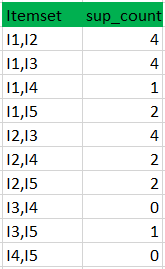
k=1
C1
L1
Data set
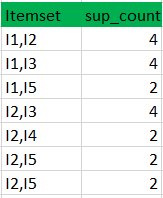
k=2
C2
L2
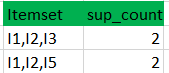
C3
L3
PART 1 : FREQUENTE ITEMS
Apriori
Exemple :
minimum confidence is 50%
[I1^I2]=>[I3] //confidence = sup(I1^I2^I3)/sup(I1^I2) = 2/4*100=50% taken
[I1^I3]=>[I2] //confidence = sup(I1^I2^I3)/sup(I1^I3) = 2/4*100=50% taken
[I2^I3]=>[I1] //confidence = sup(I1^I2^I3)/sup(I2^I3) = 2/4*100=50% taken
[I1]=>[I2^I3] //confidence = sup(I1^I2^I3)/sup(I1) = 2/6*100=33% ignored
[I2]=>[I1^I3] //confidence = sup(I1^I2^I3)/sup(I2) = 2/7*100=28% ignored
[I3]=>[I1^I2] //confidence = sup(I1^I2^I3)/sup(I3) = 2/6*100=33% ignored
Confidence(A->B) = Support_count(A∪B) / Support_count(A)
PART 1 : FREQUENTE ITEMS
Eclat :

k = 1, minimum support = 2
Dataset
k = 2, minimum support = 2


k = 3, minimum support = 2
k = 4, minimum support = 2
PART 2 : Unsuporvised classification
Data standarization : (min max methode)
new_value = old_value - min / max - min
Distance between data
d = sqrt ( (x_2 - x_1)² + (y_2 - y_1)² )
PART 2 : Unsuporvised classification
K-Means : k : clusters number
k=clusters_number

medeoids = [ k rundom data from the dataset]


for d in dataset:
	calculate the distance between d and each medoid
    assign d to the nearest medoid cluster


for c in clusters:
	calculate the new medoid

boolean = false

while( not boolean):

	recall k-mean with the new medoids

    if clusters dont change:
    	boolean = true
PART 2 : Unsuporvised classification
Other algorithms :
- K-medoid
- Clara
- Clarans
Clusters visualization :
- PCA algorithms
Algorithms of optimisation :
- Genetic algorithm
import pickle

pkl_file = open('heart.pkl', 'rb')
dataset= pickle.load(pkl_file)
pkl_file.close()

age=[]
resting_blood_pressure=[]
serum_cholestoral=[]
maximum_heart_rate_achieved=[]

for i in range (0,len(dataset)):
	age.append(float(dataset[i][0]))
	resting_blood_pressure.append(float(dataset[i][3]))
	serum_cholestoral.append(float(dataset[i][4]))
	maximum_heart_rate_achieved.append(float(dataset[i][7]))

#age descritization
min_age = min(age)
max_age = max(age)
ecart_age = (max_age - min_age ) / 4
for i in range(0,len(dataset)):
	if age[i]< min_age+ecart_age:
		age[i]="age_1"
	else:
		if ( age[i] < min_age+2*ecart_age):
			age[i]="age_2"
		else:
			if( age[i] < min_age+3*ecart_age):
				age[i]="age_3"
			else:
				age[i]="age_4"
#resting_blood_pressure normalisation
min_resting_blood_pressure= min(resting_blood_pressure)
max_resting_blood_pressure= max(resting_blood_pressure)
ecart_resting_blood_pressure = (max_resting_blood_pressure - min_resting_blood_pressure ) / 4
for i in range(0,len(dataset)):
	if resting_blood_pressure[i]< min_resting_blood_pressure+ecart_resting_blood_pressure:
		resting_blood_pressure[i]="rbp_1"
	else:
		if ( resting_blood_pressure[i] < min_resting_blood_pressure+2*ecart_resting_blood_pressure):
			resting_blood_pressure[i]="rbp_2"
		else:
			if( resting_blood_pressure[i] < min_resting_blood_pressure+3*ecart_resting_blood_pressure):
				resting_blood_pressure[i]="rbp_3"
			else:
				resting_blood_pressure[i]="rbp_4"

#serum_cholestoral normalisation
min_serum_cholestoral = min(serum_cholestoral)
max_serum_cholestoral = max(serum_cholestoral)
ecart_serum_cholestoral = (max_serum_cholestoral - min_serum_cholestoral) / 4
for i in range(0,len(dataset)):
	if serum_cholestoral[i]< min_serum_cholestoral+ecart_serum_cholestoral:
		serum_cholestoral[i]="sc_1"
	else:
		if ( serum_cholestoral[i] < min_serum_cholestoral+2*ecart_serum_cholestoral):
			serum_cholestoral[i]="sc_2"
		else:
			if( serum_cholestoral[i] < min_serum_cholestoral+3*ecart_serum_cholestoral):
				serum_cholestoral[i]="sc_3"
			else:
				serum_cholestoral[i]="sc_4"

#maximum_heart_rate_achieved  normalisation
min_maximum_heart_rate_achieved = min(maximum_heart_rate_achieved)
max_maximum_heart_rate_achieved = max(maximum_heart_rate_achieved)
ecart_maximum_heart_rate_achieved = (max_maximum_heart_rate_achieved - min_maximum_heart_rate_achieved) / 4
for i in range(0,len(dataset)):
	if maximum_heart_rate_achieved[i]< min_maximum_heart_rate_achieved+ecart_maximum_heart_rate_achieved:
		maximum_heart_rate_achieved[i]="max_hra_1"
	else:
		if ( maximum_heart_rate_achieved[i] < min_maximum_heart_rate_achieved+2*ecart_maximum_heart_rate_achieved):
			maximum_heart_rate_achieved[i]="max_hra_2"
		else:
			if( maximum_heart_rate_achieved[i] < min_maximum_heart_rate_achieved+3*ecart_maximum_heart_rate_achieved):
				maximum_heart_rate_achieved[i]="max_hra_3"
			else:
				maximum_heart_rate_achieved[i]="max_hra_4"


desc_data=[]

for i in range(0,len(age)):
	desc_data.append([age[i],resting_blood_pressure[i],serum_cholestoral[i],maximum_heart_rate_achieved[i]])

for d in desc_data:
	print(d)
output = open('desc_data.pkl', 'wb')
pickle.dump(desc_data, output)
output.close()
THE END
Thanks for your attention
Contact :
email : soheib.boudali@blactus.tech linkedin : Soheib BOUDALI facebook : Cédric so instagram : cedric_s
https://blactus.tech
DM
By Soheib Boudali


