D3.js Intro
(Data-Driven-Documents)
SVG
- 在網頁的世界裡,常常會用到圖形
- 在撰寫網頁時,可以使用 <svg> tag 來畫出簡單的向量圖形,並且可以控制它的變化

Title Text
<html>
  <body>
    <svg width="100%" height="100%">
      <circle
        cx="200"
        cy="200"
        r="100"
        fill="red"/>
    </svg>
  </body>
</html>
我們來畫個圓

一些SVG Element
<circle /> cx, cy, r
<rect /> x y width height
<line /> x1 y1 x2 y2
<path> d
<text></text>
Try YourSelf!

SVG ViewBox
放大定義視區
viewpoint
viewbox
viewbox
SVG
- SVG 不是 HTML 元素,所以無法用 innerHTML 或 append 直接操作
- 要用 createElementNS 才可操作 SVG
- 但如果你有 100 or 1000以上的 SVG ?
- 如果你想組 <path M10....></path>
Title Text
Subtitle
D3.js
處理資料很強大
動態視覺化資料
JS Library
用 d3.js 畫出一個圓
d3.js Data Binding
d3.select("rect").datum(data);rect
Data
未使用 datum 狀況下
如果要綁定多個資料
for(var i = 1; i <= 10; i++) {
  d3.select("svg")
    .append("rect")
    .select("rect")
    .styles({
     width: data[i] + "px"
    });
}

d3.select("rect:nth-of-type(5)");
有了 datum
d3.select("rect")
  .datum(資料你好)
  .attrs({
    "width": function(d, i) {
      return this;
    }
  })
多個資料時
for(var i = 1; i <= 10; i++ {
  d3.select("svg")
    .append("rect")
    .datum(data[i])
    .attrs({
      width: function (d, i) {
        return d * 10;
      }
    });
}
問題: 到底要多少個? 多出來的該怎辦?
幫我自動綁定
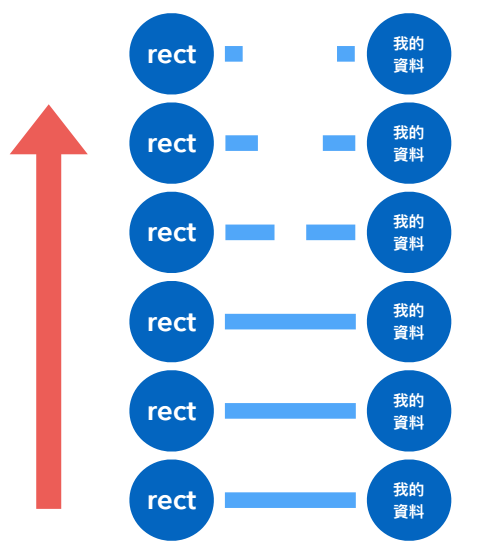
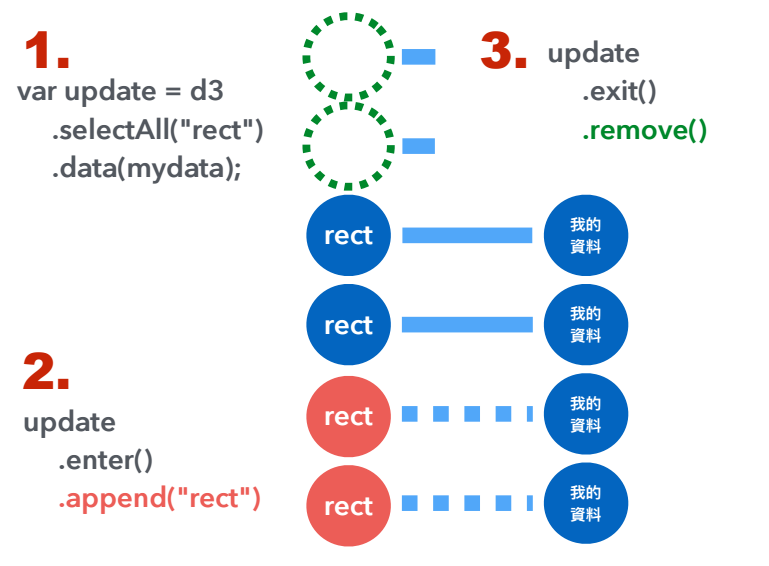
d3.js Data Binding
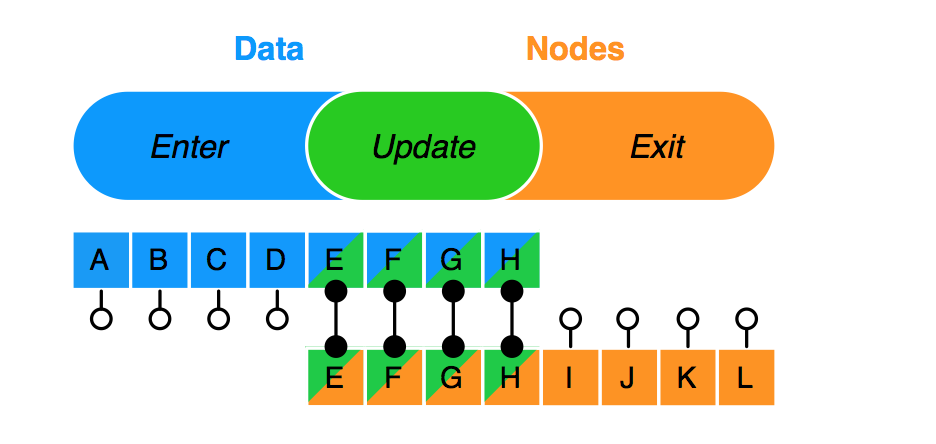
(...).data(data).enter().append("svg")
(...).exit().remove()
自動綁定步驟
Subtitle
來個長條圖看看

加上一點動畫看看
d3.selectAll("rect")
  .attrs({width: 0})
  .transition()
  .duration(1000)
  .delay(1000)
  .attrs({width: 100})
Path 動畫試試看
d3.js 一些函式介紹
d3.nest()
d3.pack()
d3.hierarchy()
d3.nest()
group array into hierarchy structure
d3.nest()
  .key()
  .entries()
var data = [
{value: 1, cat: 'A' },
{value: 2, cat: 'B' },
{value: 3, cat: 'B' },
{value: 4, cat: 'C' },
{value: 5, cat: 'C' },
]時間不太夠所以...
直接看看大魔王
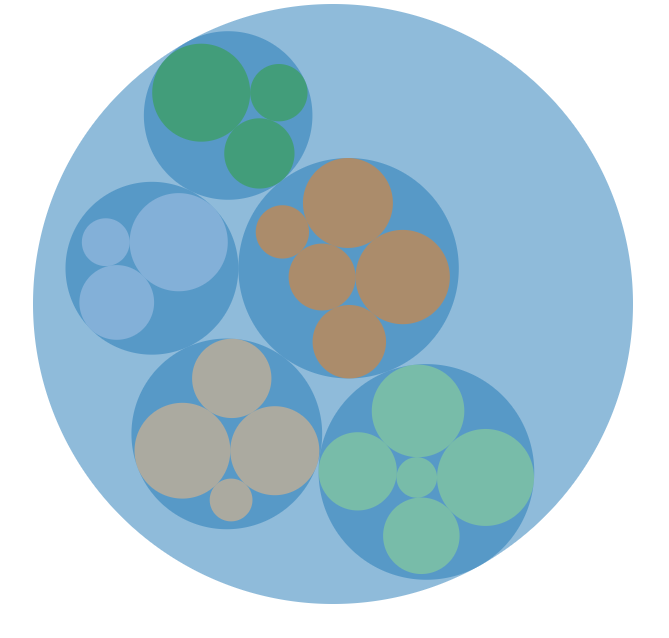
1. 準備資料
2. 建立 Hierarchy 物件
3. 建立 Pack Layout 物件
4. 利用 Pack Layout 更新Hierarchy 物件
5. 利用 Data Binding 建立元素並繪製物件
D3.js Introduction
By Stanney Yen


