Places, Data, and Understanding
Doing place-based research for
your summer internship
Simon Elichko (they/them)
Social Sciences & Data Librarian
What we'll work on today:
- Understanding challenges related to finding reliable data about local communities in the United States
- Developing practical skills for quickly finding a range of useful data about people and places
- Knowing how to extend and build your skills
(for example, in your field placement)
What does data represent?
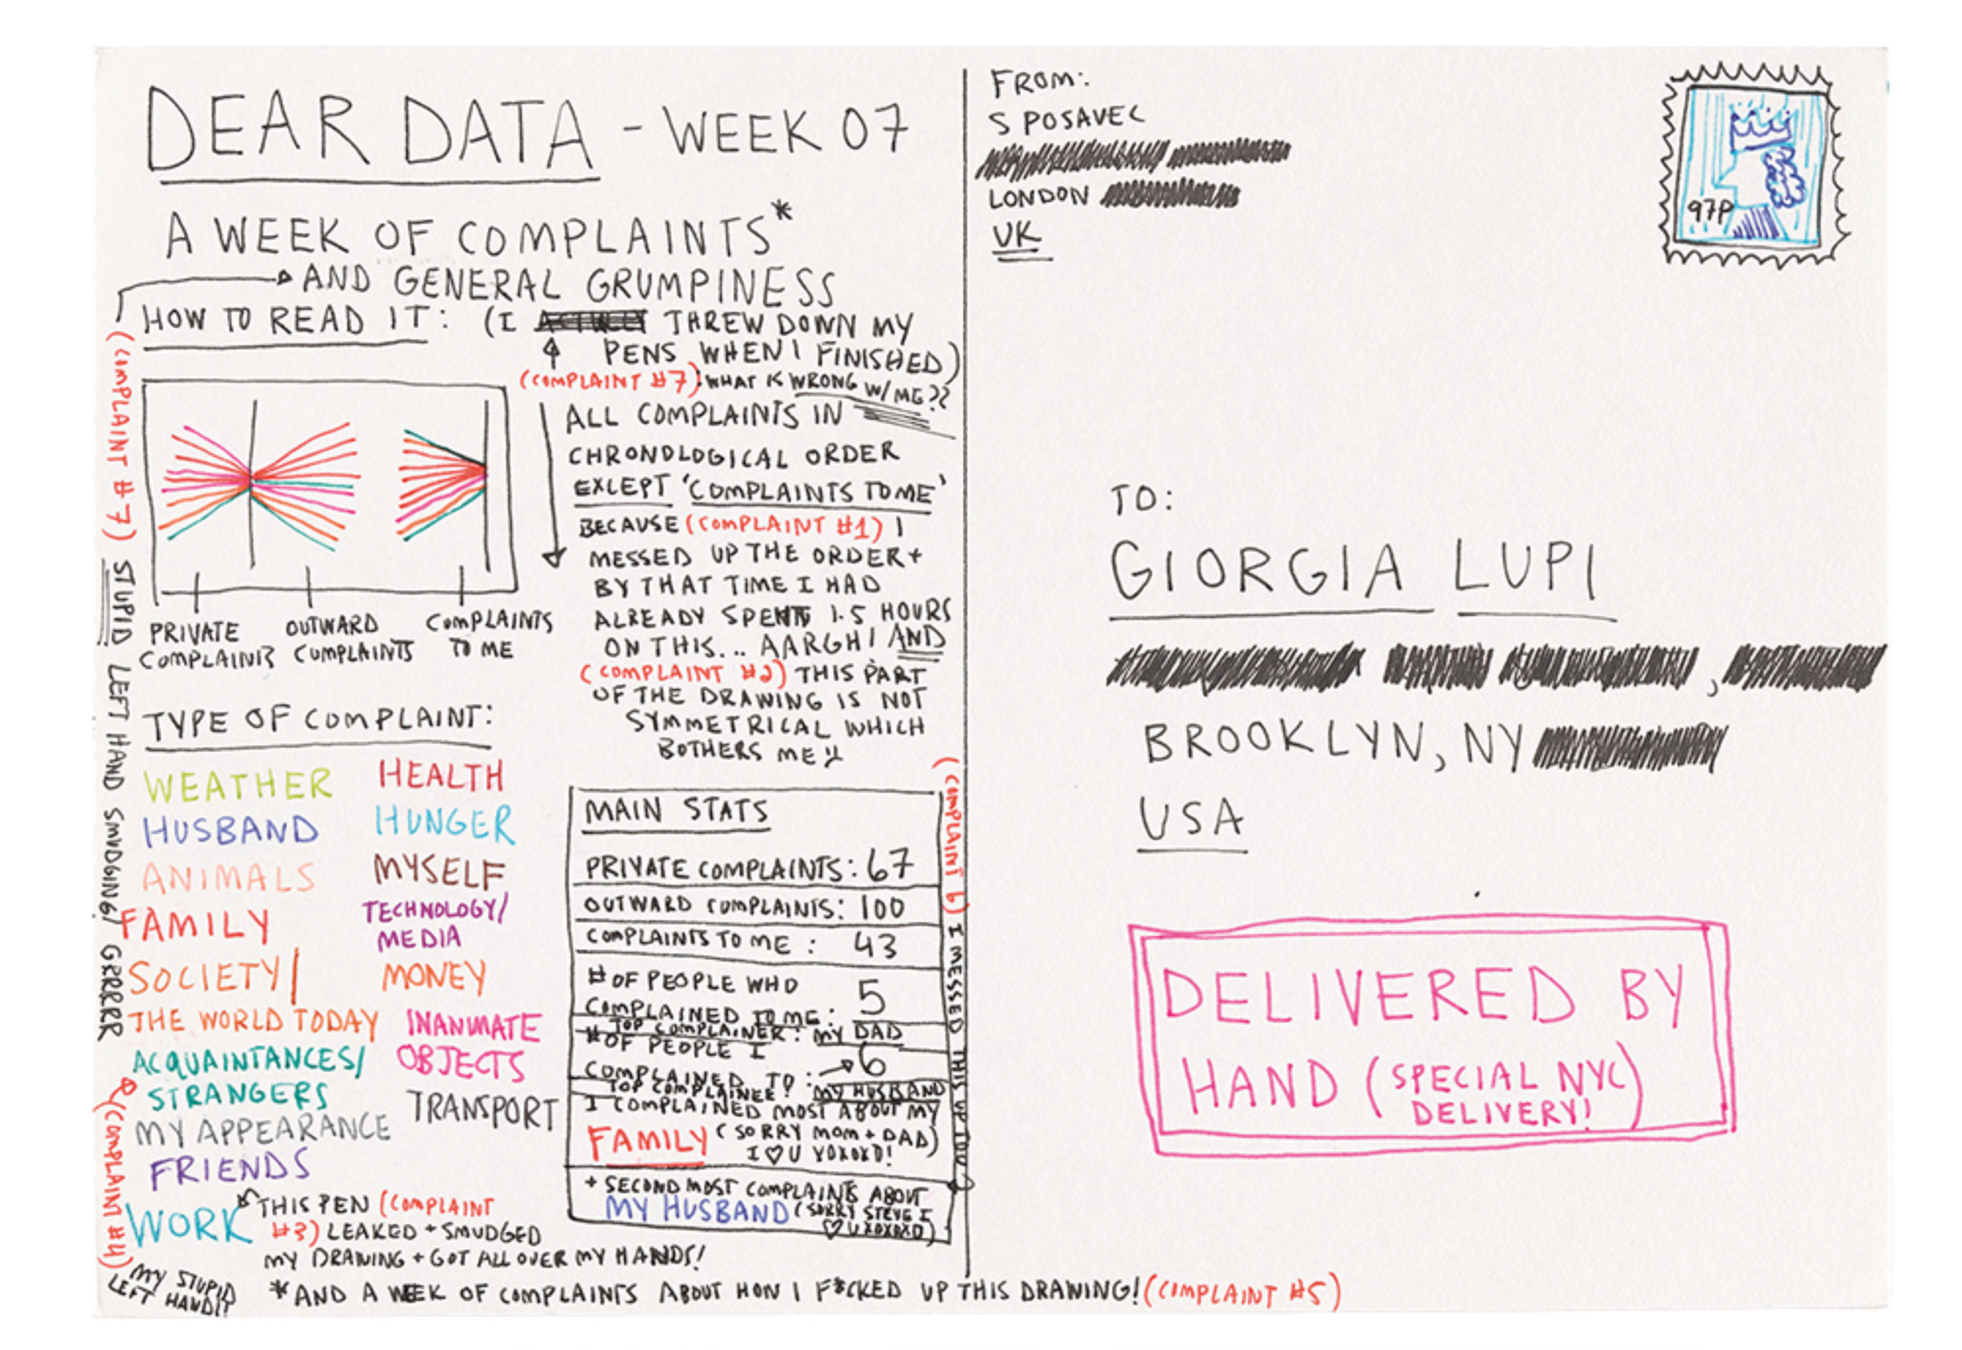
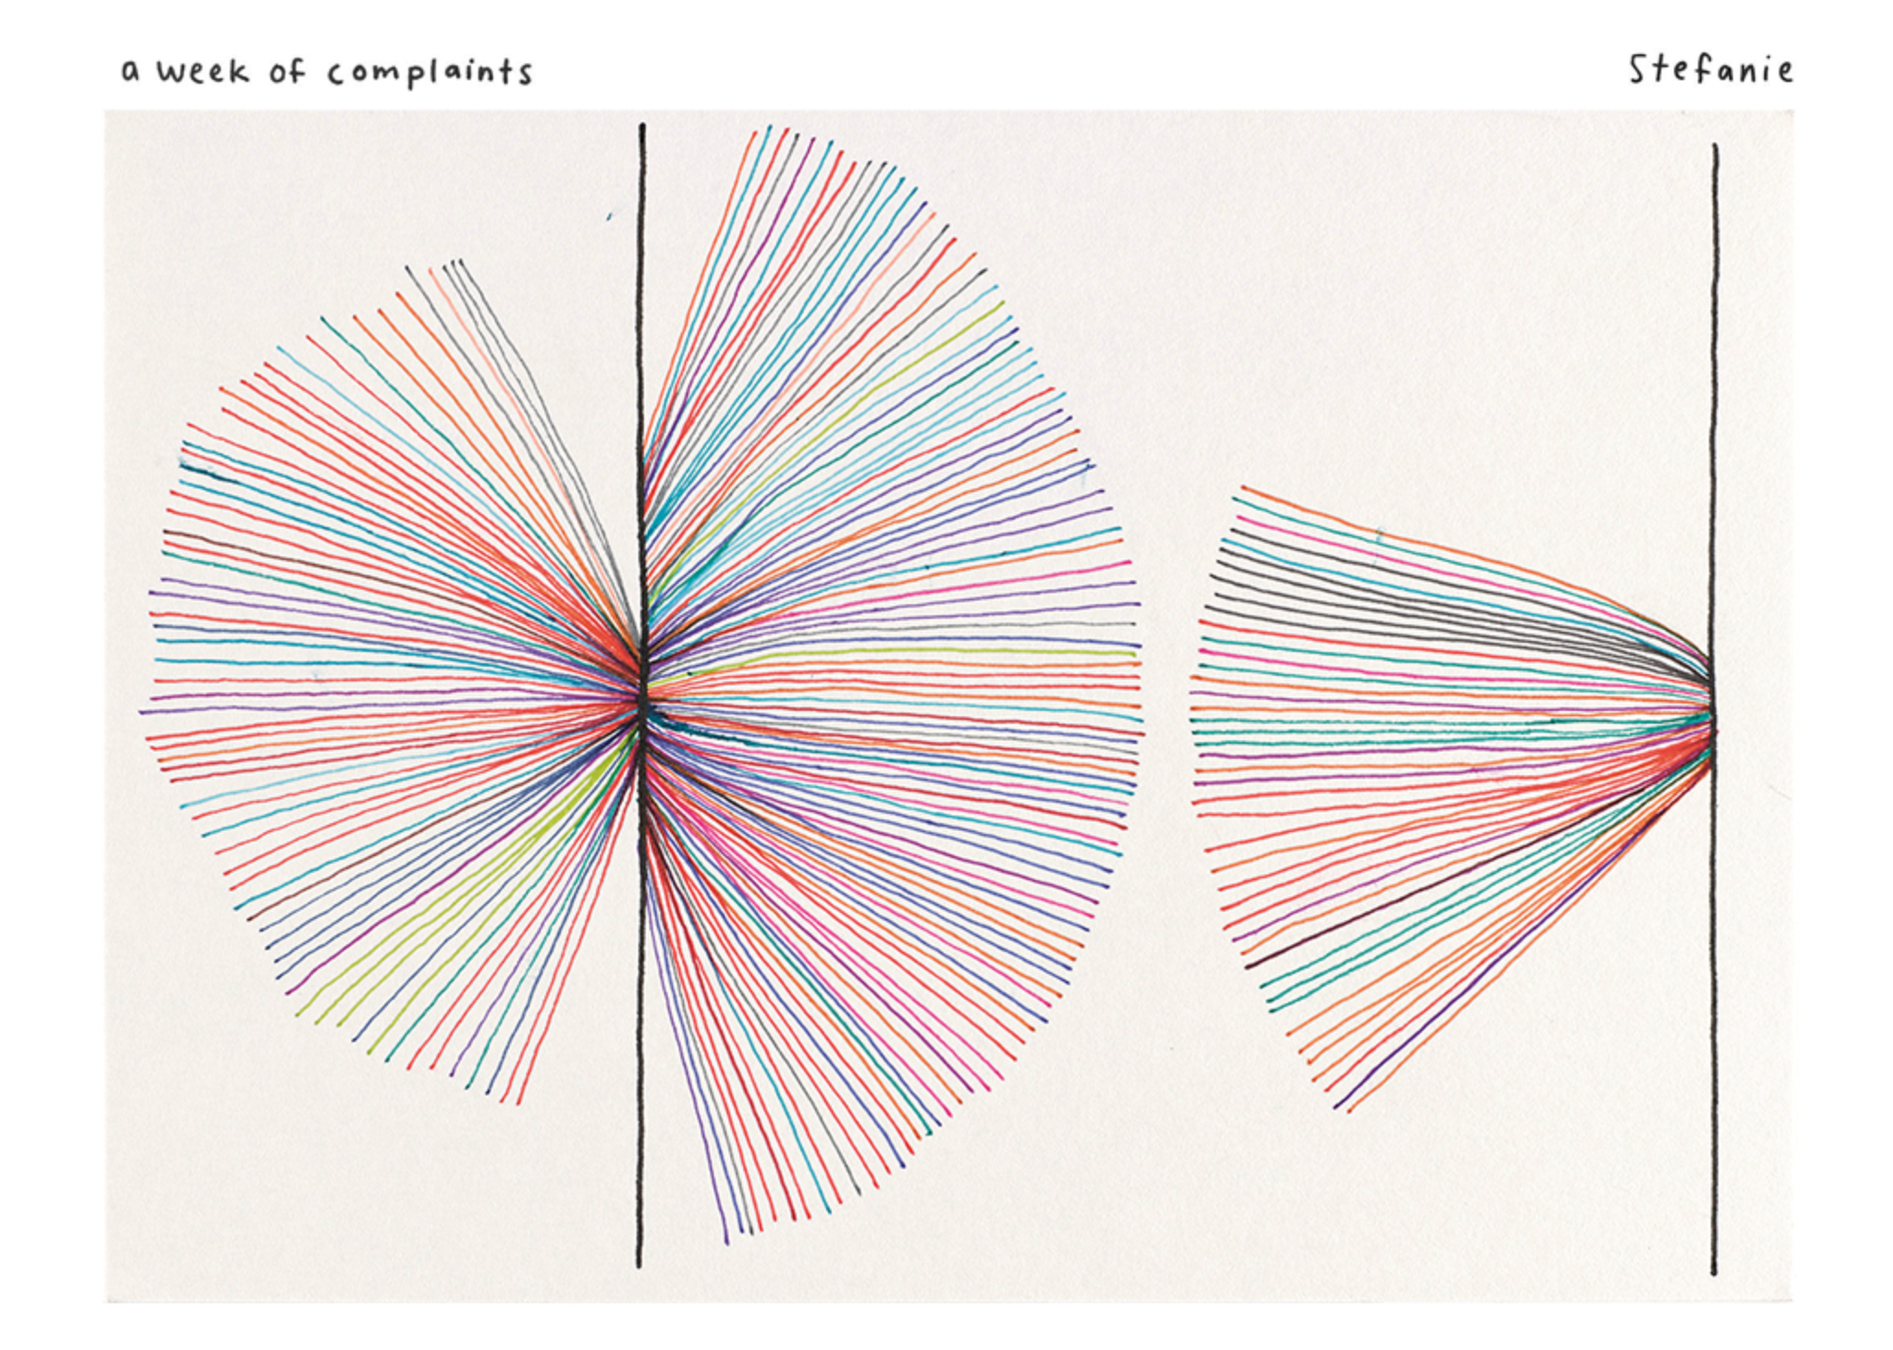
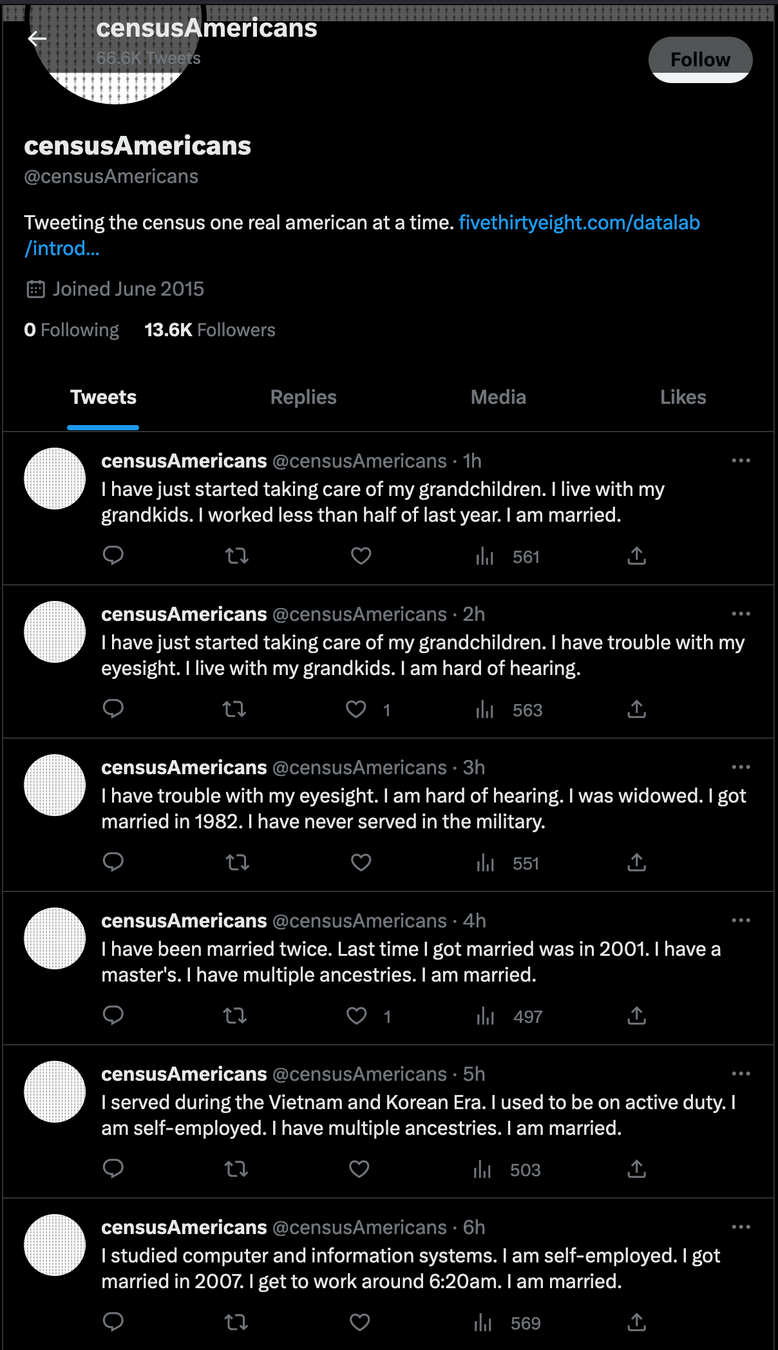
Why does it matter?
What can we learn about?
groups of people
neighborhoods
cities
metropolitan areas
counties
states
}
geographies
Learn about US Census geographies
Historical data and cross-country comparisons:
Our World in Data + other sources
Easiest to find data is generally:
-
High-level - US or state level; outside the US, country level
-
Recent past - last year, 5-10 years before that
Challenges with
local areas:
- Smaller samples have increased privacy concerns (easier to identify individuals)
- Higher margins of error
- Cost
When should we place limits?
Considerations:
• Identifiability
• Sensitivity
• Risk
(ethical practice + data use)
Throughout the process:
• Collecting
• Curating (describing)
• Representing (analysis)
• Sharing (publishing)
See this New York Times article from April 9, 2025 for historical background and current concerns
Where can you look for data?
Tradeoffs between ease of use and flexibility/control
-
Published statistics from reports, news, books
-
Curated data tools
-
e.g. Social Explorer and Policy Map
-
-
Creating custom data tables
-
e.g. Data.Census.gov
-
-
Working with raw data & microdata
-
e.g. Integrated Public Use Microdata (IPUMS)
-
e.g. Research datasets from ICPSR
-
Data & Stats Research Guide:
bit.ly/data-stats-swat-libraries
Understanding Census tract numbers
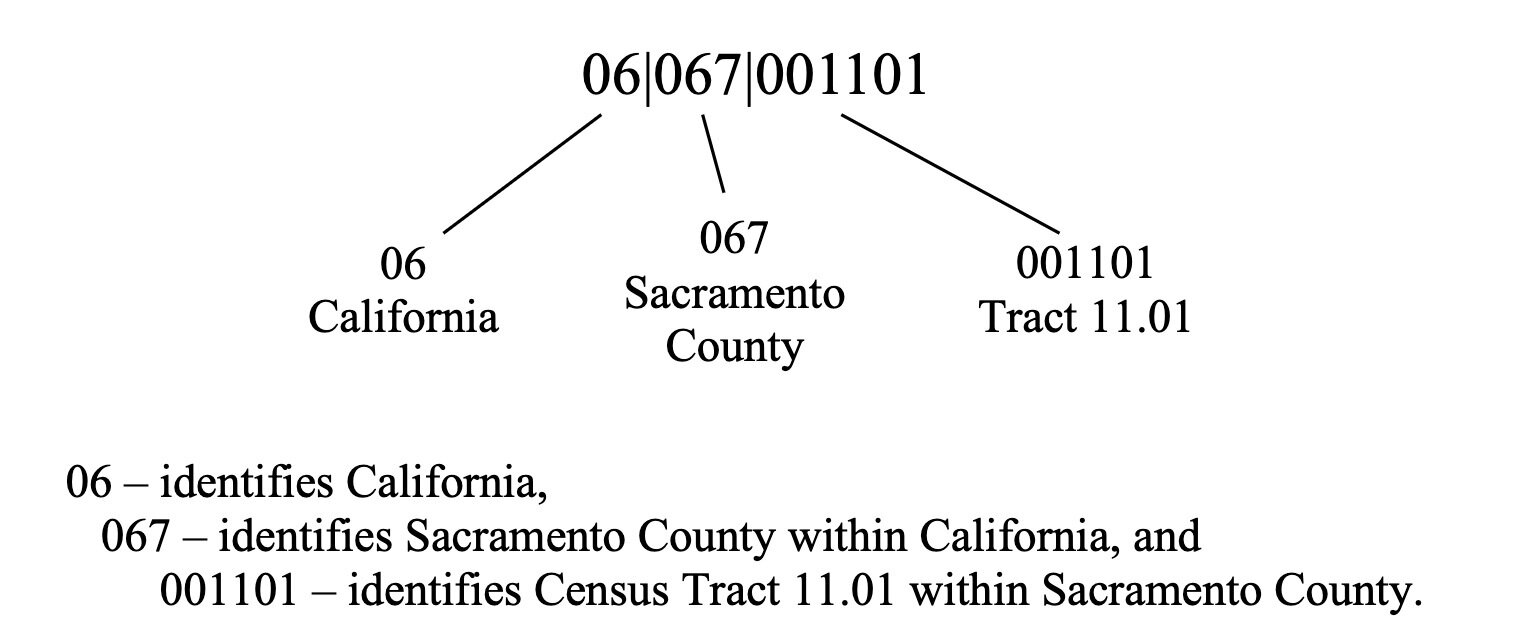
More info about Census tracts
• Changes over Time
• Interesting Factoids
• Surprising Connections
• Personal Experiences
• Revealing Comparisons
Getting help with data & research
including over the summer!
Meet with Simon
- Schedule at bit.ly/selichk1
-
Email them at selichk1@swarthmore.edu
(including if you need an alternative meeting time)
Other ways to get library & research help:
- Email librarian@swarthmore.edu
- Use the chat in Tripod
- Research & Info Associates (RIAs) are available in McCabe most evenings
Places, data, and understanding
By Swarthmore Reference


