INFOGRAPHICS
(BN-INFGRA-04-GY)
Krisztián Szabó
Krisztián Szabó
Eötvös Loránd University (ELTE)
Átlátszó
ATLO


Text
Introduction to data visualisation and data journalism
Plan of the semester:
23rd February: Introduction to data visualisation and data journalism
2nd March: Origins of data visualisation and data journalism
9th March: Methods and classification of data visualisation
16th March: Intentional and unintentional mistakes made during the visualisation process
23rd March: works of general and investigative data journalism (GDJ/IDJ)
30th March: tutor absence
6th April: spring break
13th April: getting, making, cleaning data sources
20th April: softwares used in data acquiring and cleaning
27th April: Free to use softwares for making charts and graphs (Flourish)
4th May: Free to use softwares for making maps (QGIS, Unfolded)
11th May: process of writing and assembling a data-oriented article
18th May: Presentation and evaluation of the individual/group projects
Origins of data visualisation and data journalism
Methods and classification of data visualisation
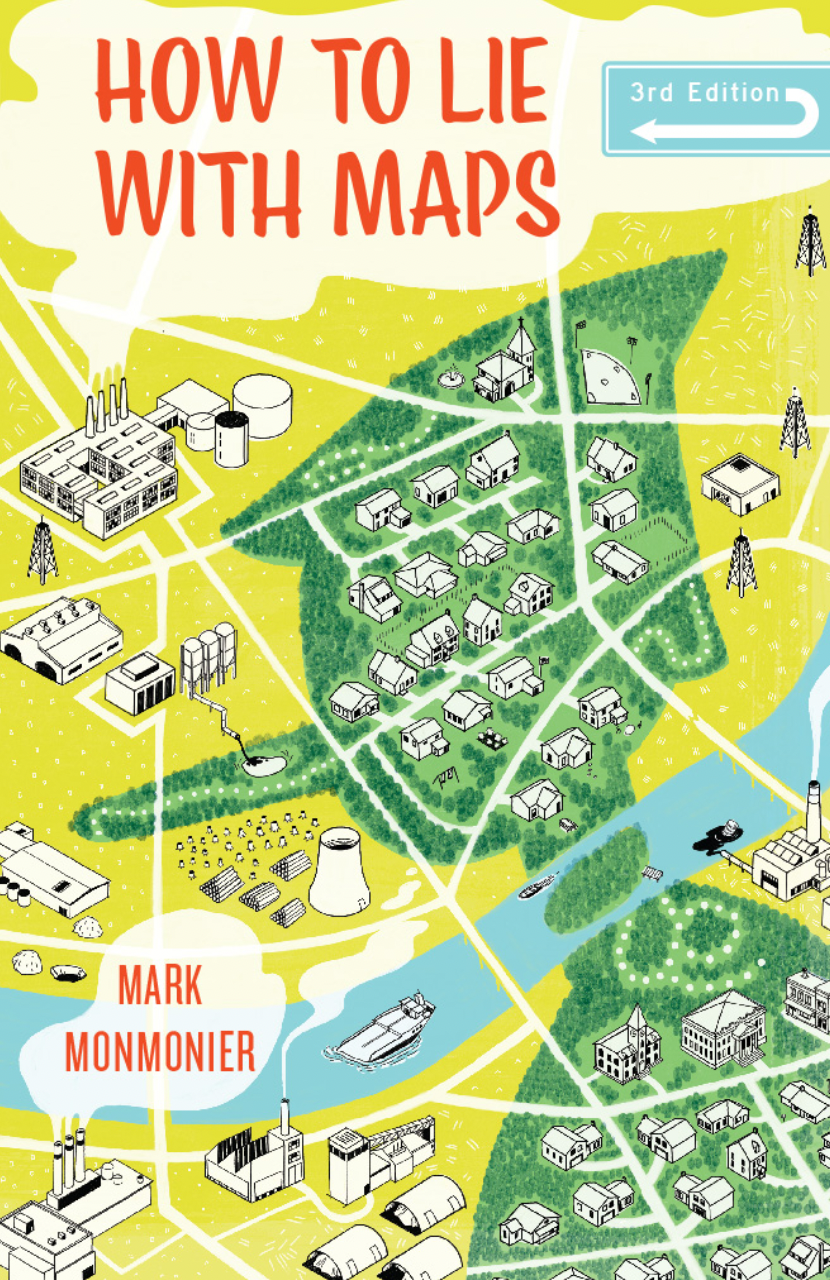
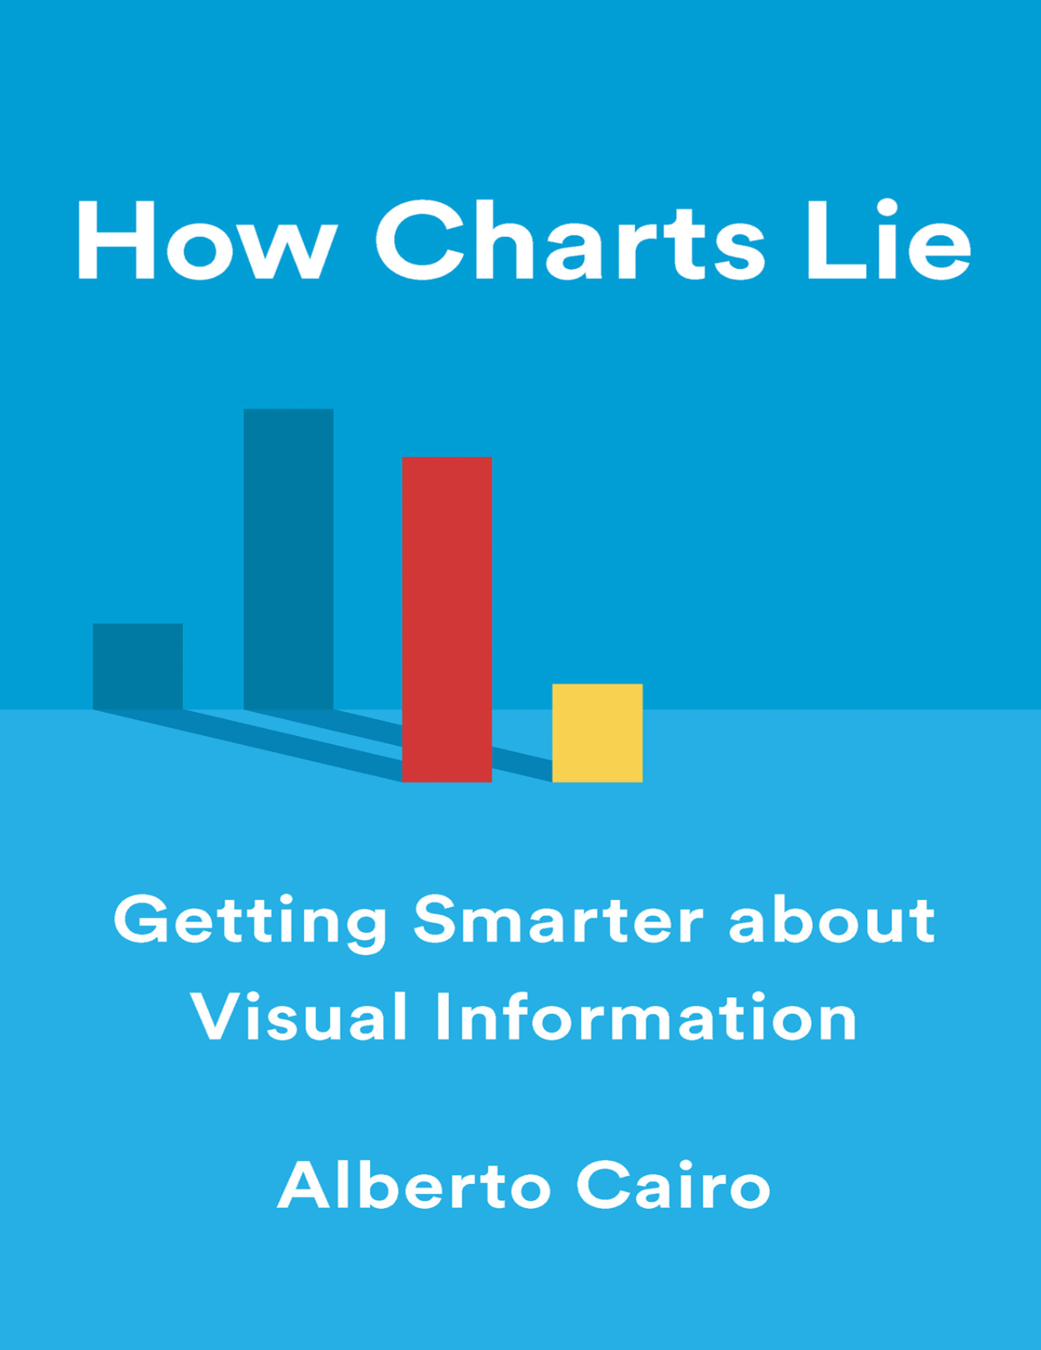
Intentional and unintentional mistakes, lies

General data journalism (GJD)
Investigative data journalism (IDJ)
Methods:
getting, making, cleaning data sources
softwares used in data acquiring and cleaning (Excel, Google Sheets)
Free to use softwares for making charts and graphs (Flourish)
Free to use softwares for making maps (QGIS, Unfolded)
process of writing and assembling a data-oriented article
Evaluation
Completing the week-to-week exercises and class activity (40%)
Realising and presenting a final project (60%)
Accepted absence: from no more than three lessons
| Percentage | Grading |
|---|---|
| 95< | Outstanding (A+) |
| 90-94 | Excellent (A) |
| 80-89 | Very Good (B) |
| 70-79 | Good (C) |
| 60-69 | Satisfactory (D) |
| 50-59 | Pass (E) |
| 0-49 | Fail (F) |
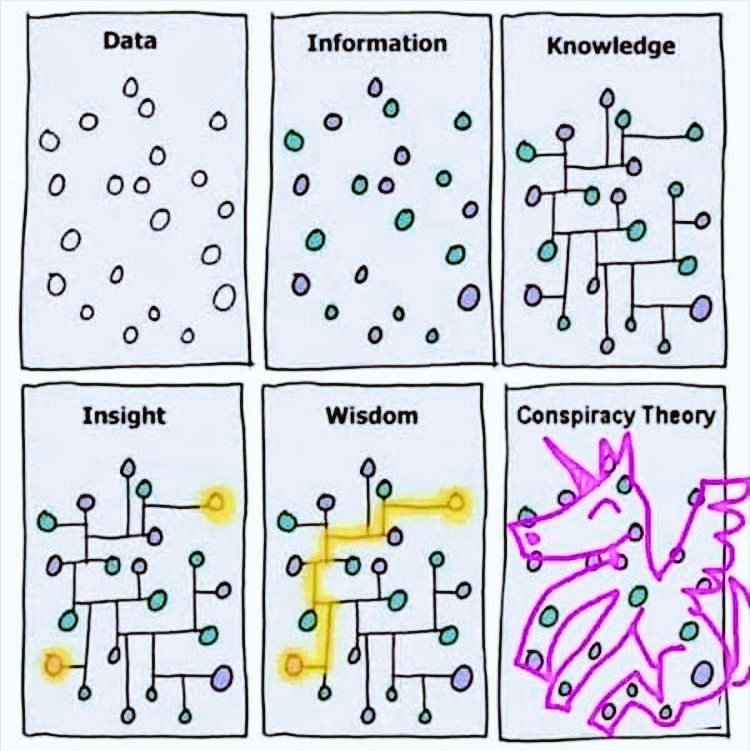
What is data?
| Raw data | Reality |
| Ovservation | Data |
| Meaning | Information |
| Understanding | Knowledge |
| Decision | Wisdom |
What is data?
Exercise
1. What data do we "have" on ourselves?
2. How can we describe a community/group through their data?
3. How can we describe a nation through data?
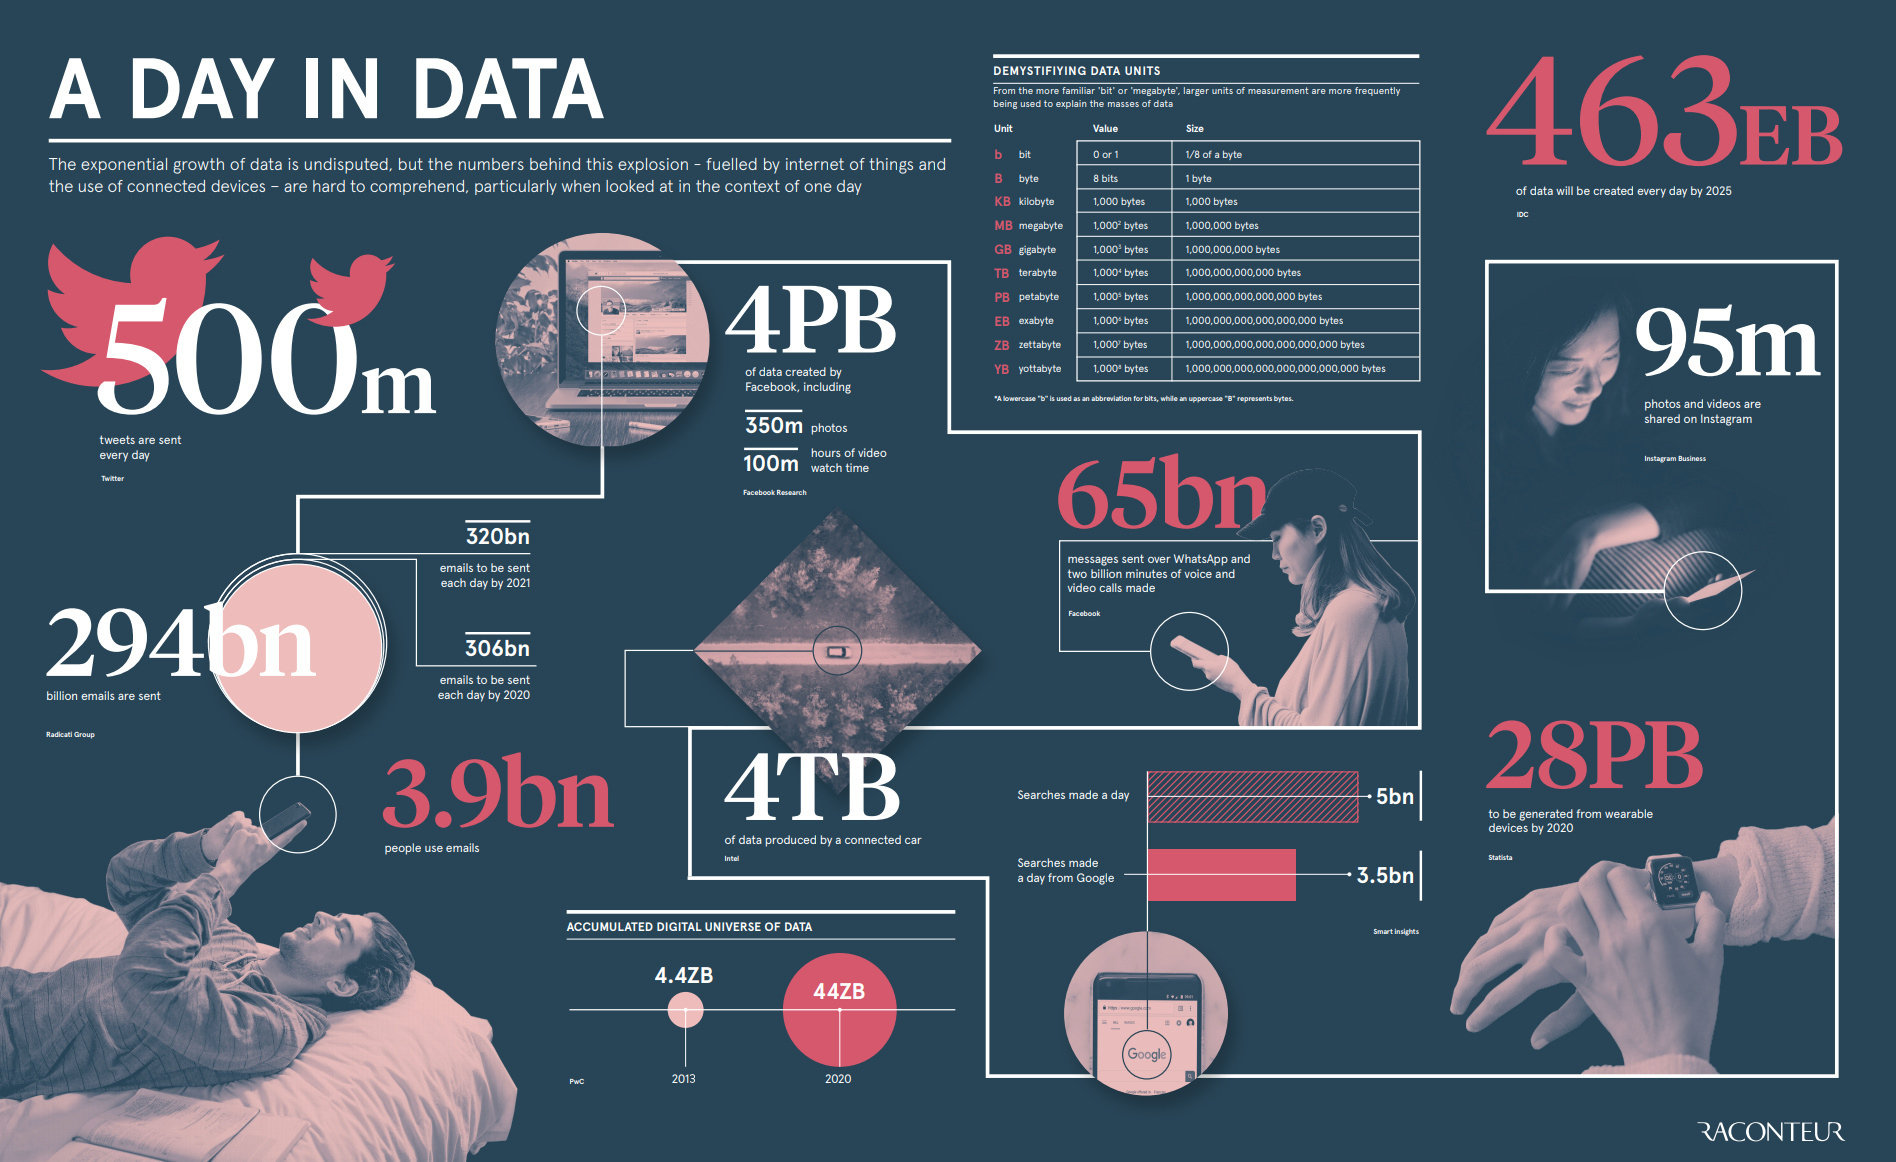
What is data visualisation?
showing of data and information with visual signs
graphic representation of data
information graphics
infographics
https://www.nytimes.com/interactive/2020/05/31/nyregion/coronavirus-birding-nyc.html
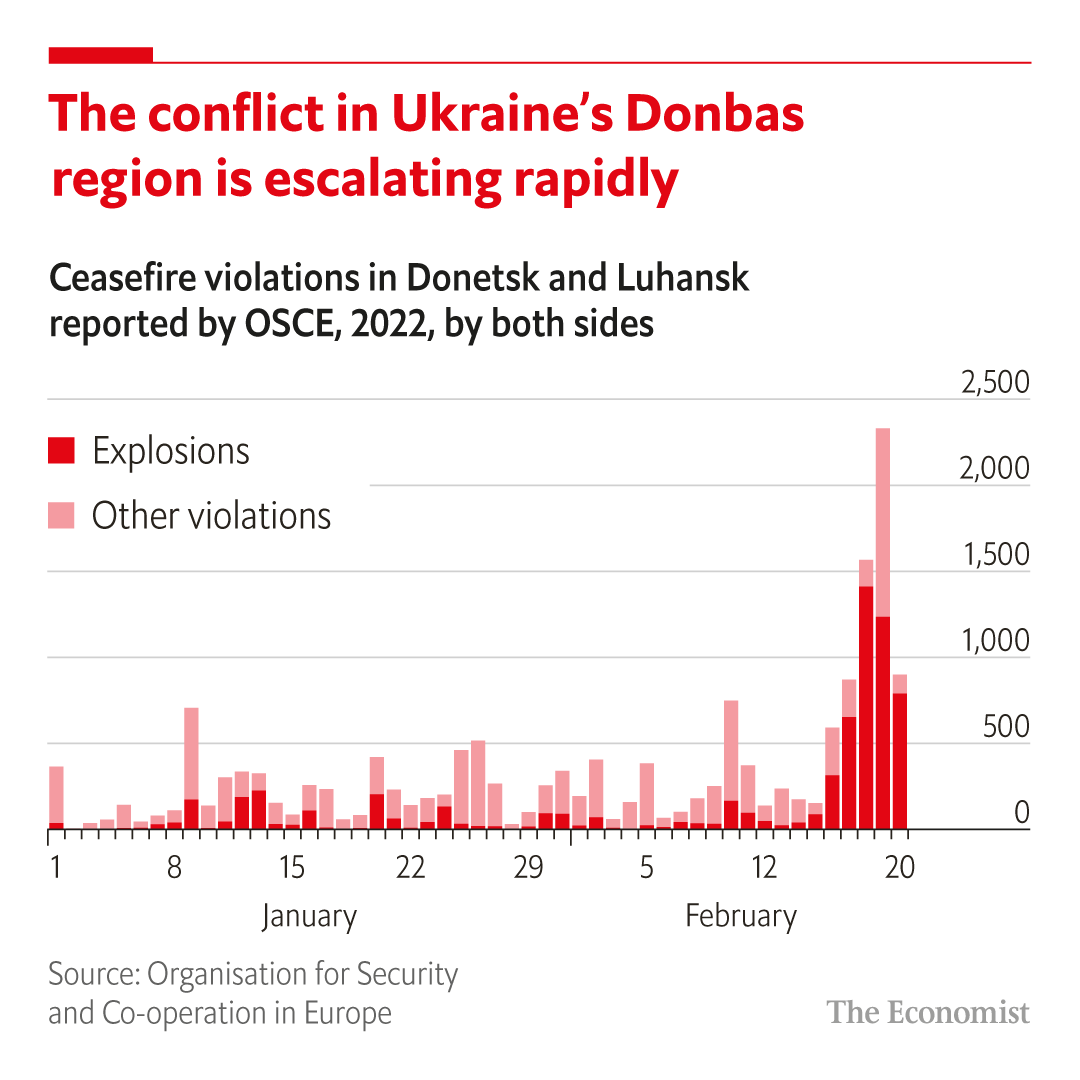
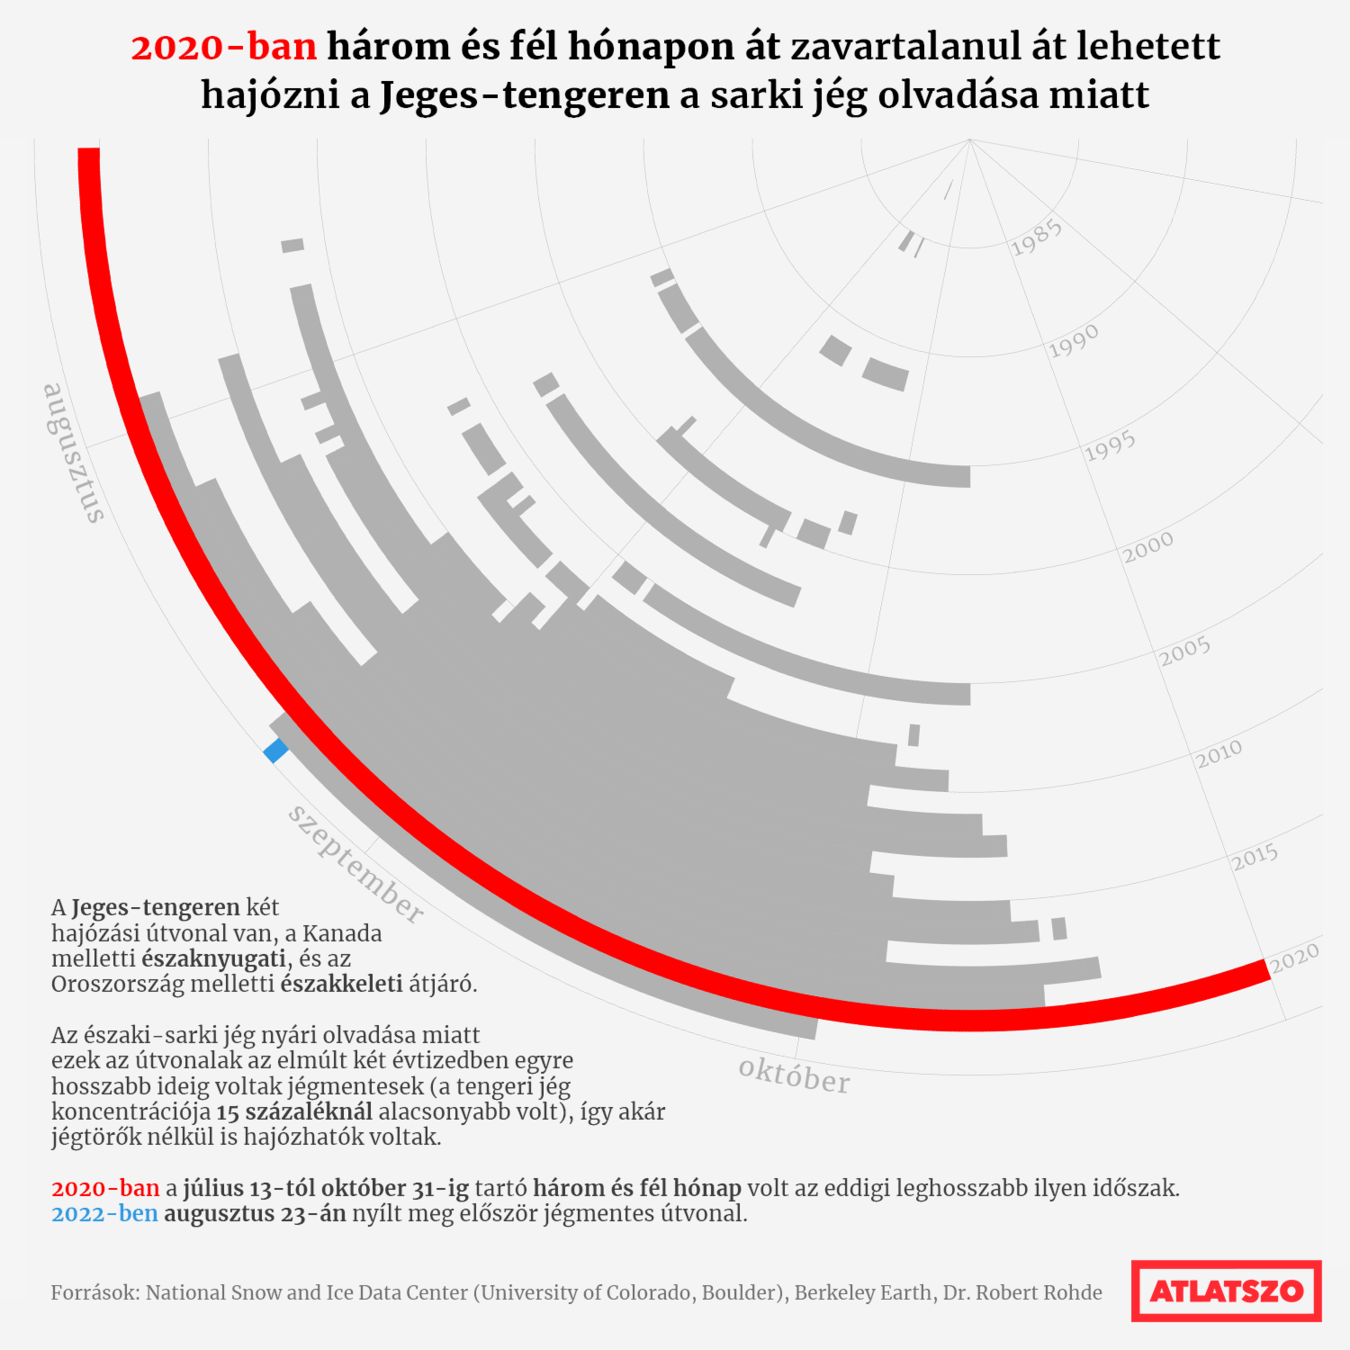
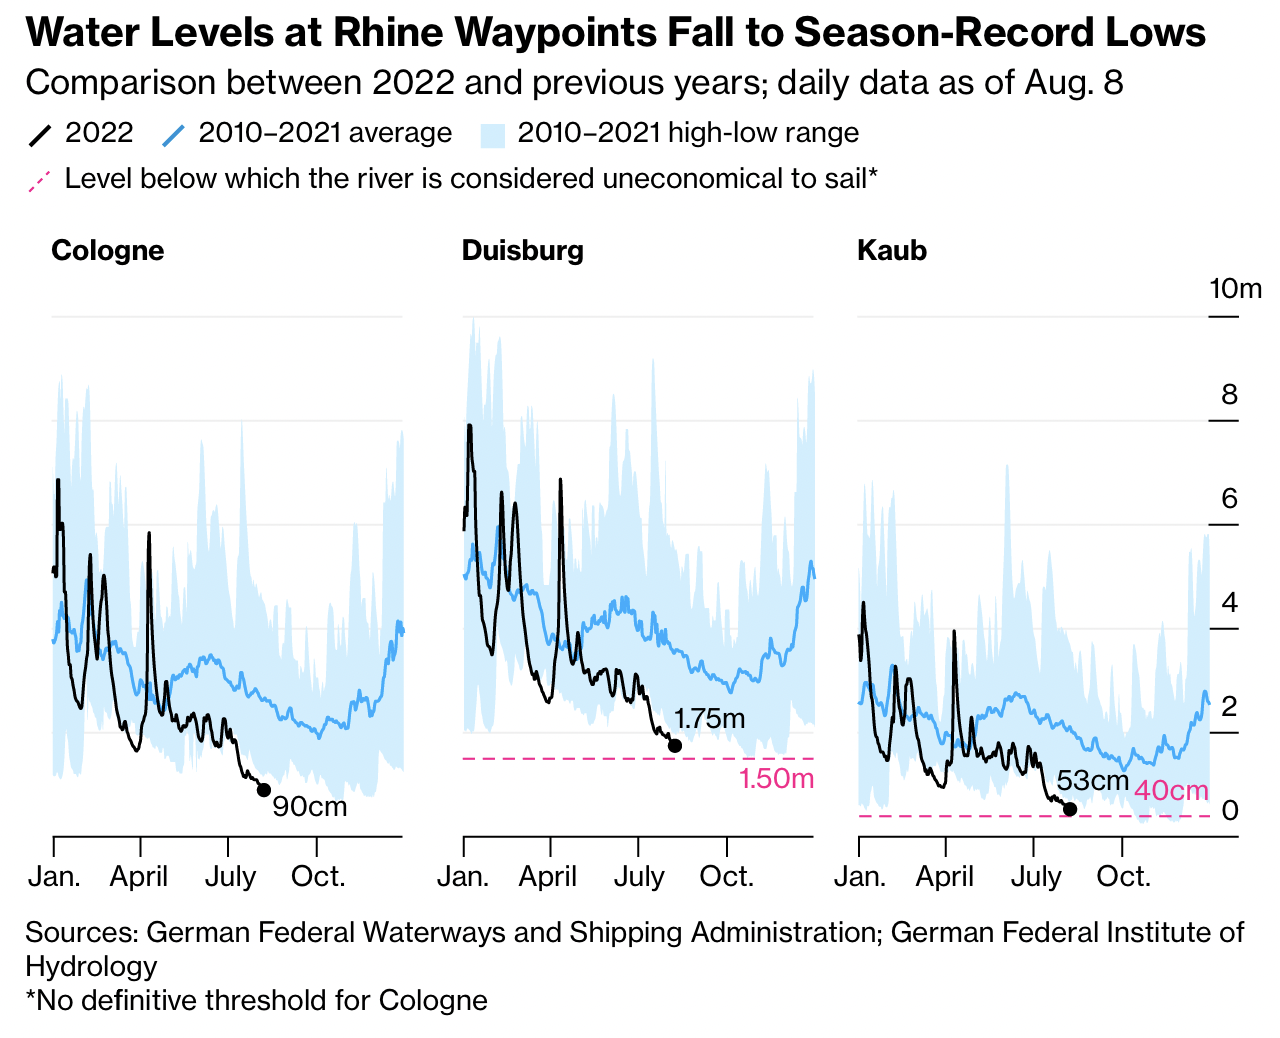
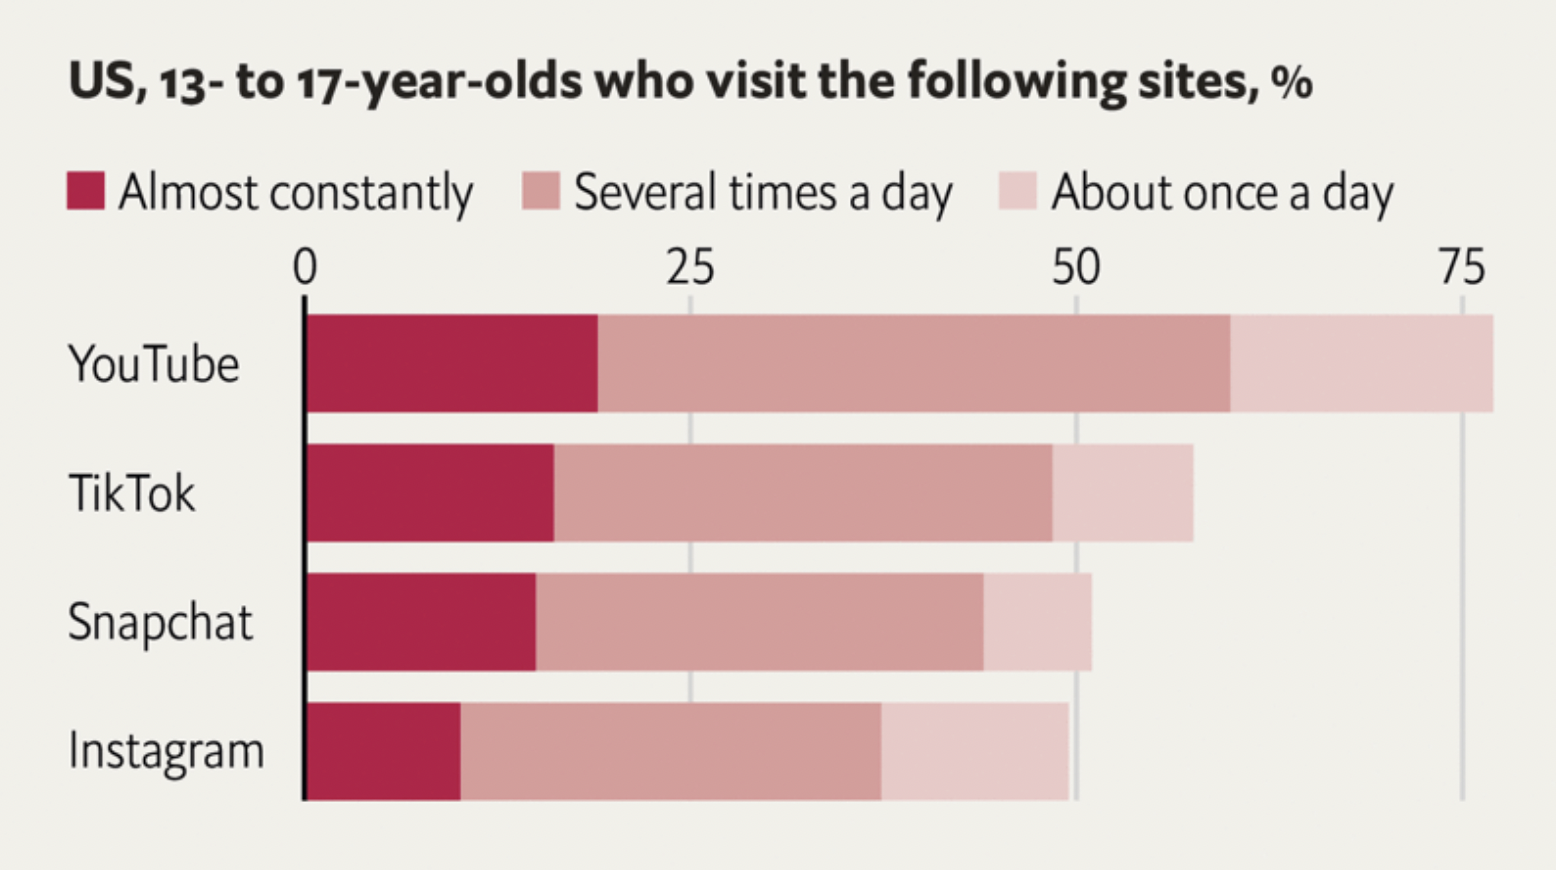
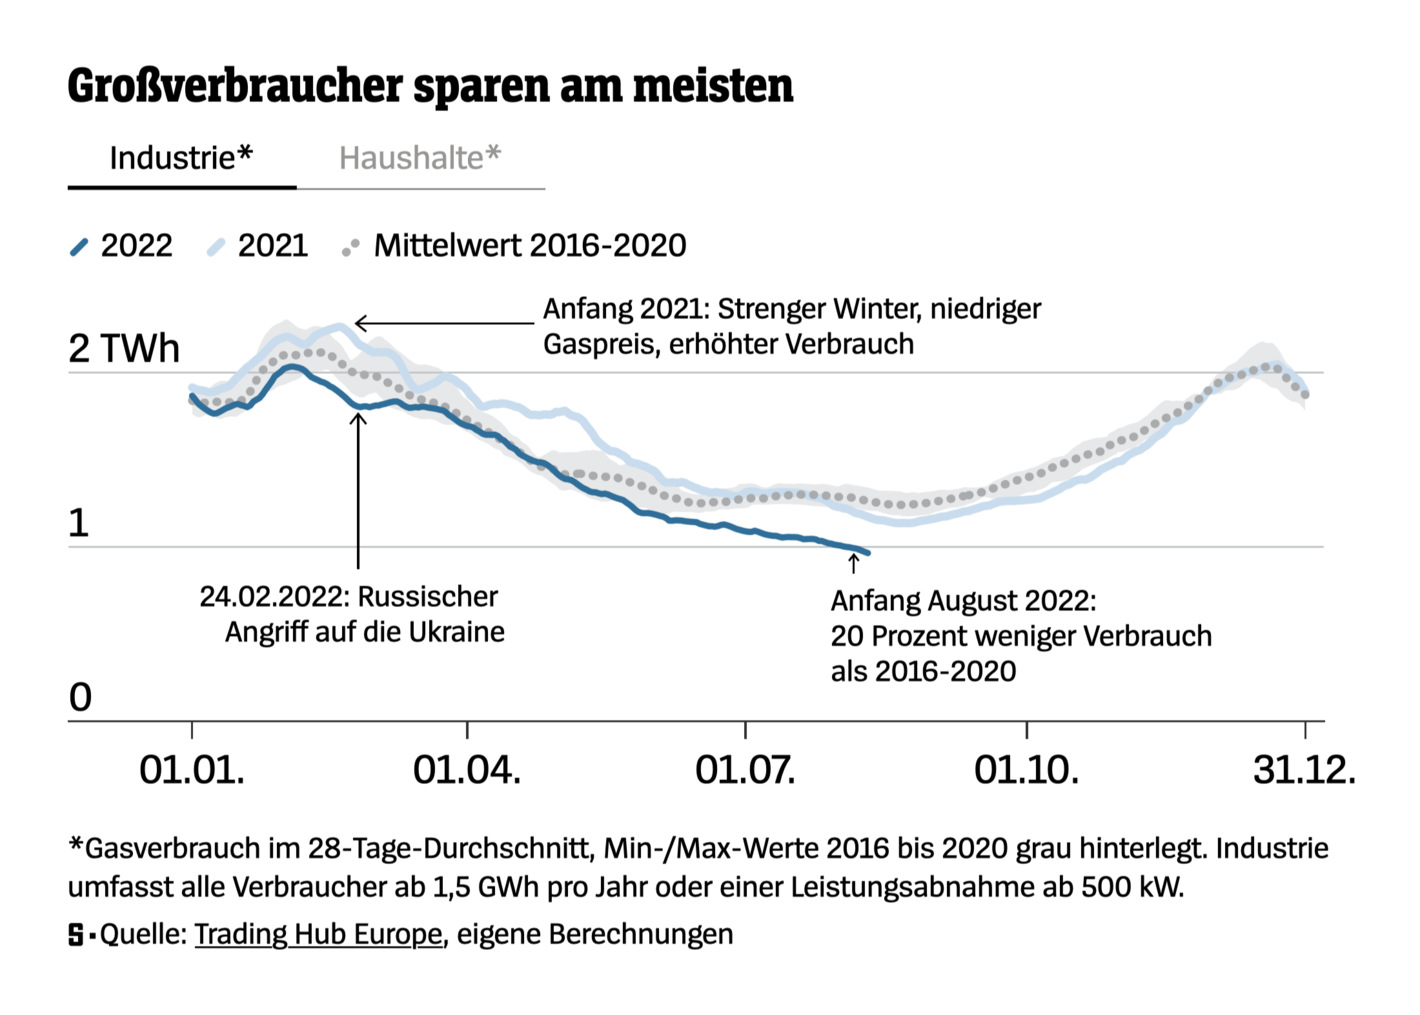
Data visualisation in the news
data journalism, data-driven journalism, database journalism, computational journalism, data visualization (Kalatzi et al. 2018)
news graphics (Cairo 2017)
(news) infographics (Weber 2017, Rendgen 2019)
Data journalism can be defined as the process of extracting useful information from data, writing articles based on the information and embedding visualizations (interacting in some cases) in the articles that help the readers understand the significance of the story or allow them to pinpoint data that relate to them.
– Veglis & Bratsas (2017)
〞
Data visualisation in the news
Reuters Graphics
The New York Times
The Guardian
Zeit Online
Bloomberg
The Economist
Financial Times
The Washington Post
FiveThirtyEight
National Geographic
South China Morning Post
Le Monde
Der Spiegel
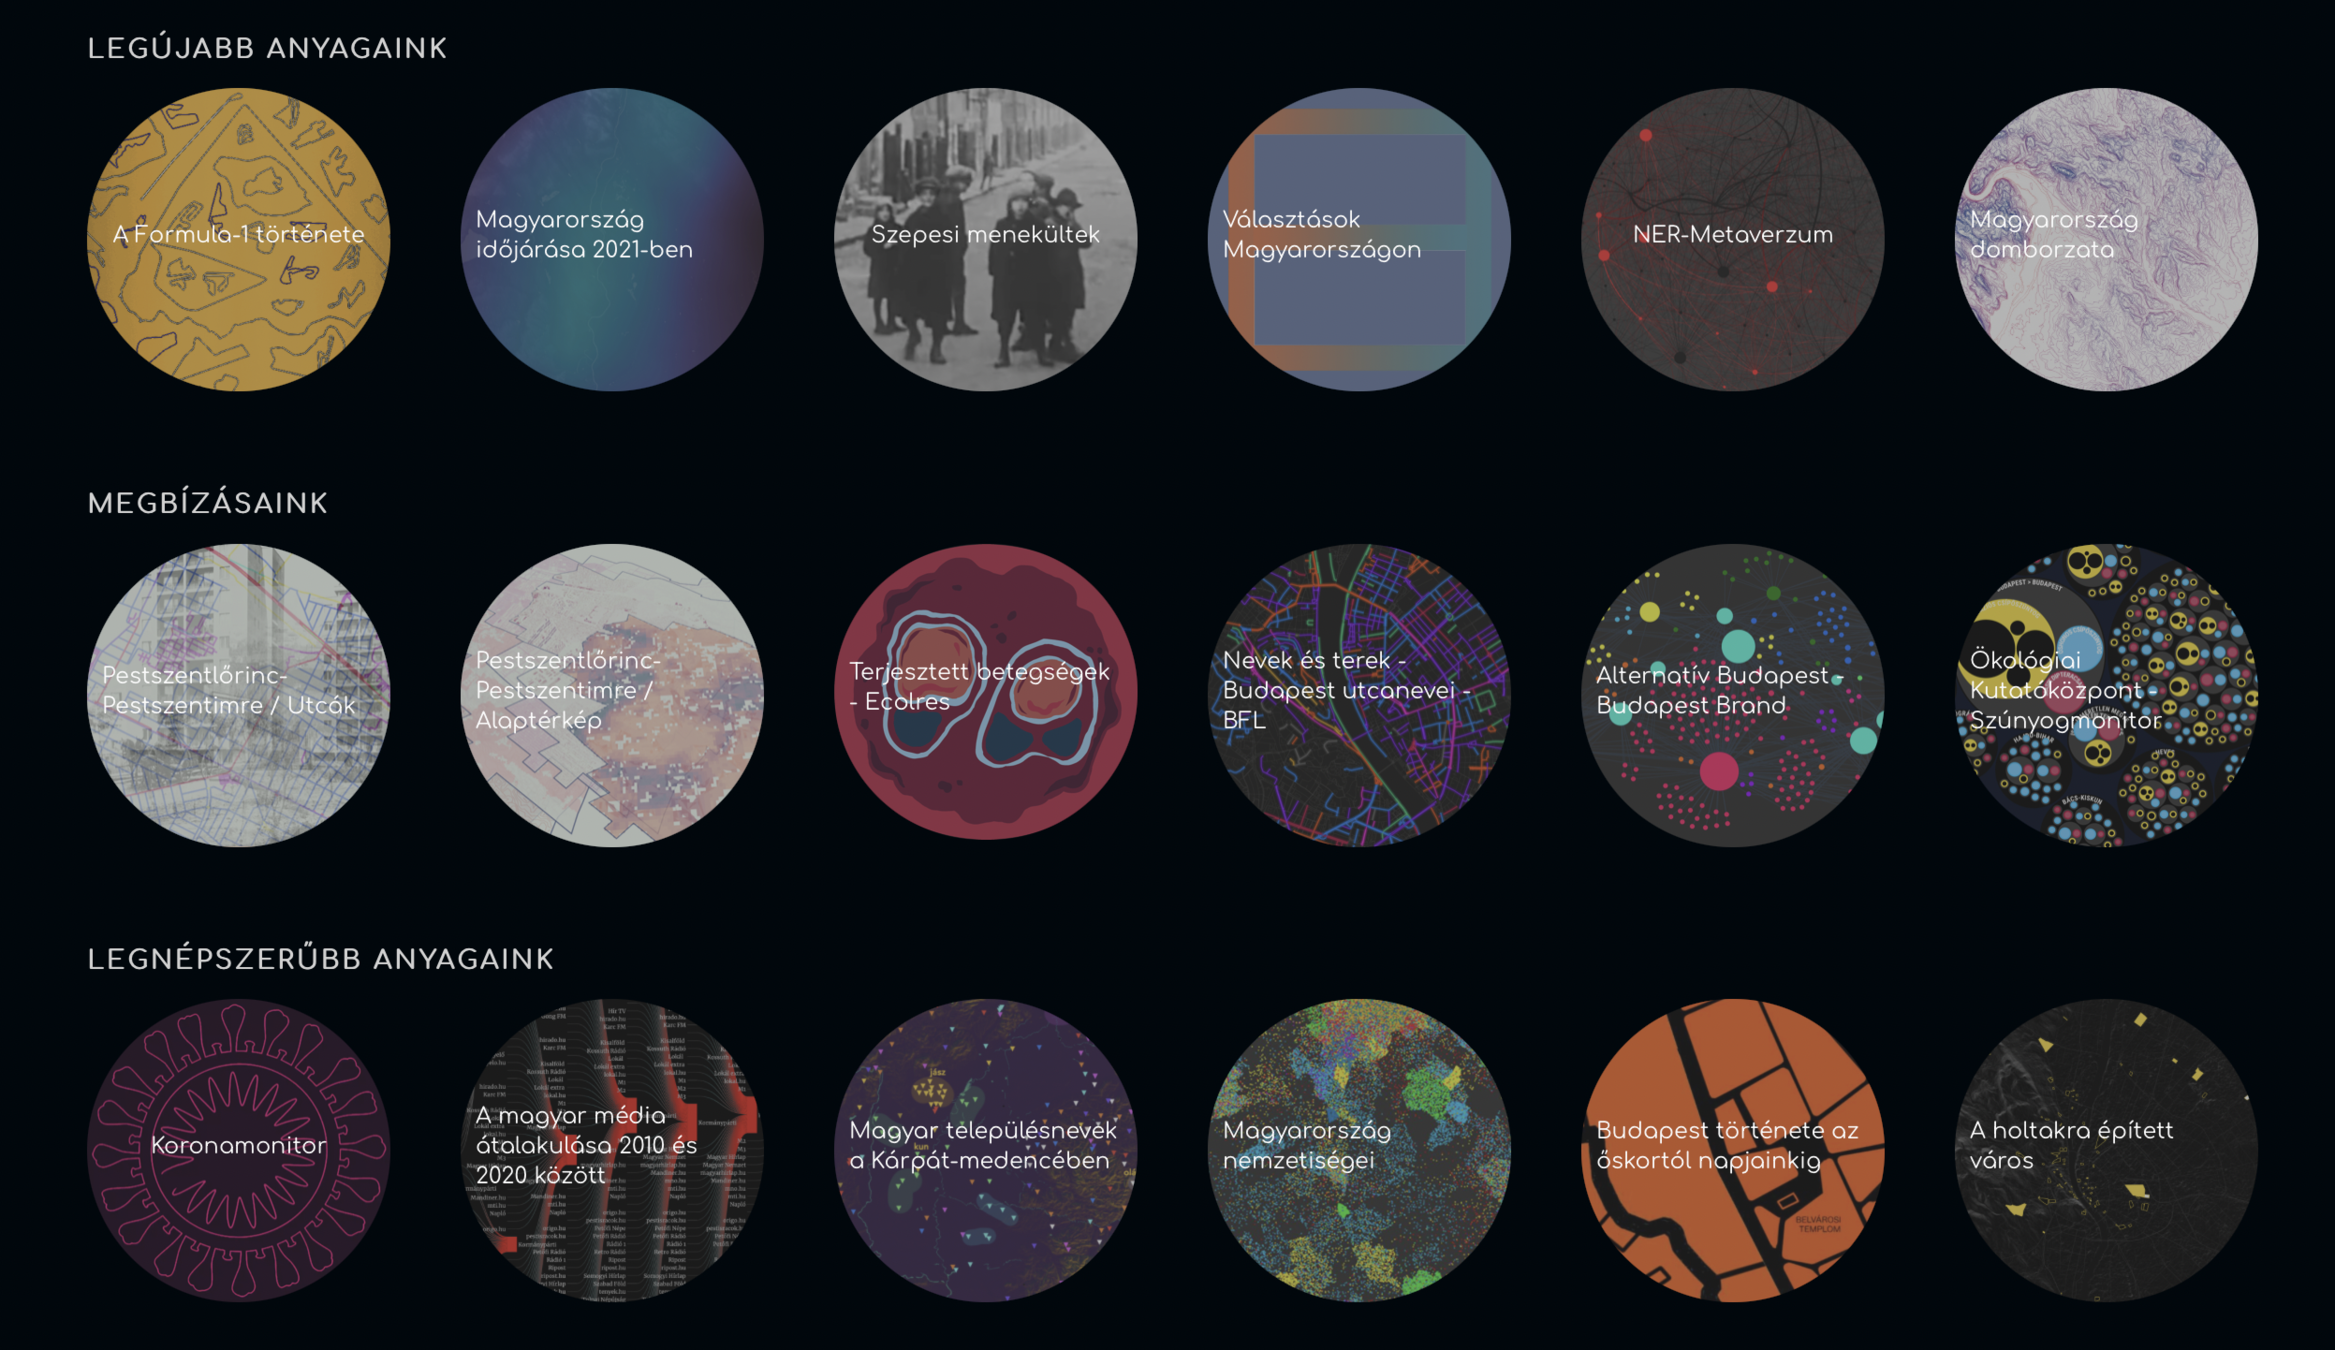
Átlátszó
Átló
Stb.
https://www.nytimes.com/interactive/2022/12/28/us/2022-year-in-graphics.html
https://www.nytimes.com/interactive/2019/12/20/opinion/location-data-national-security.html
Next lesson
23rd September: Origins of data visualisation and data journalism
Homework:
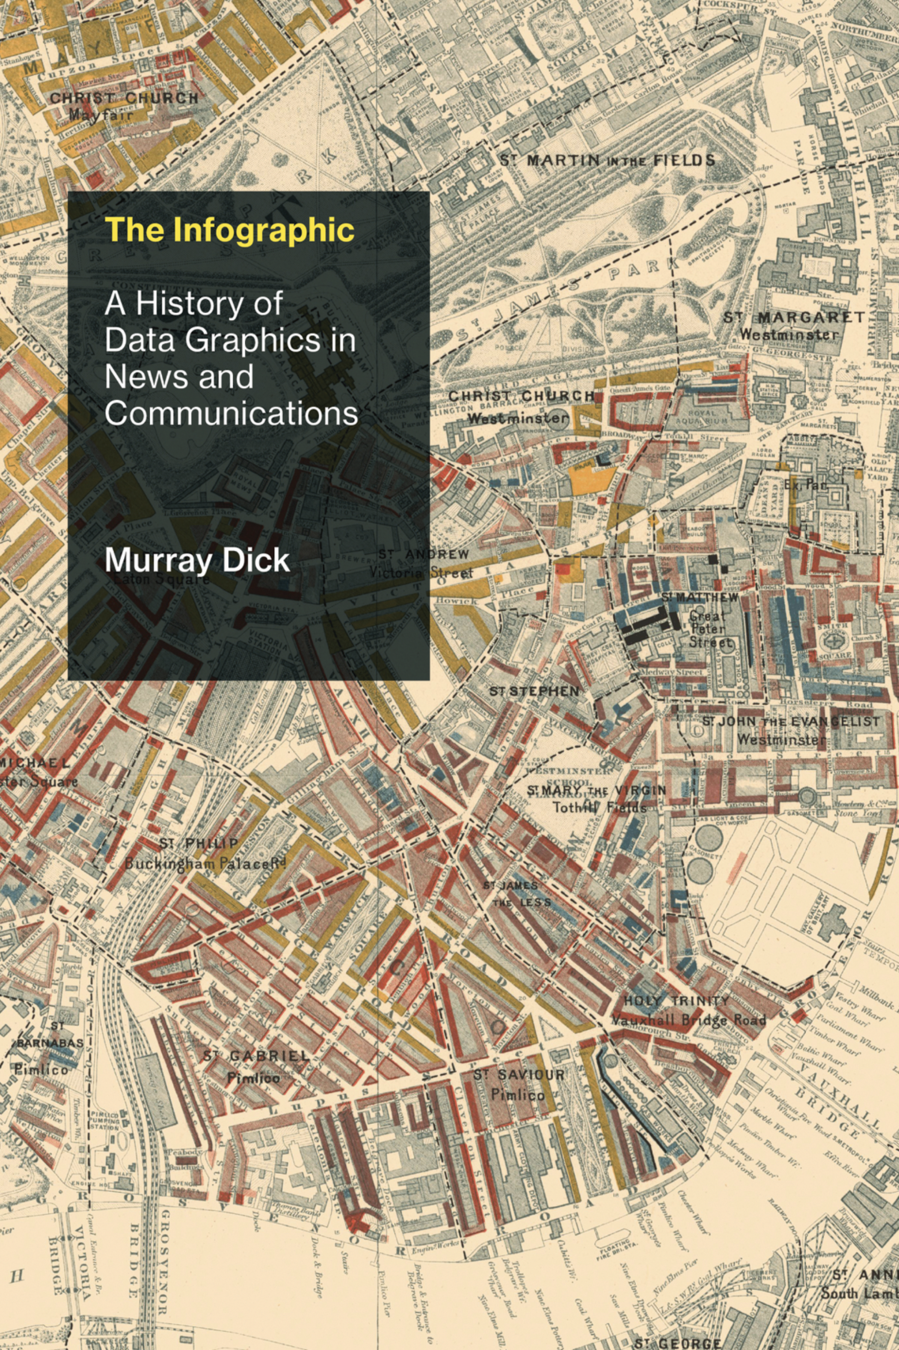
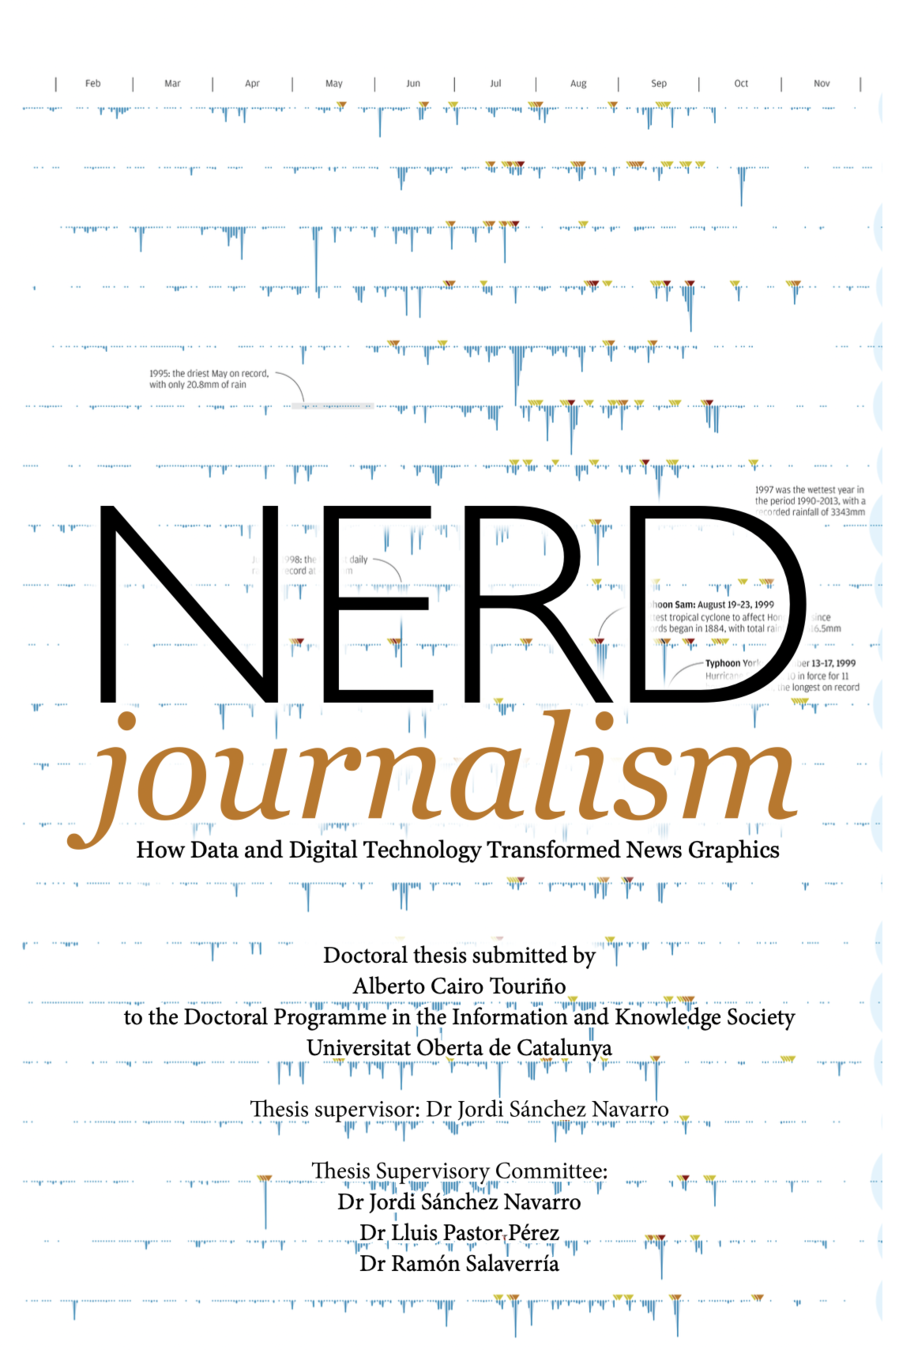
Write a half-page summary of Alberto Cairo's Nerd Journalism, pages 35-45: what early pioneers does he mention, what memorable visualisations did they create?
Deadline: 28th February Tuesday 20:00.
Thank you for your attention!
szabo.krisztian96@gmail.com
METU
By Szabó Krisztián


