Supercharge your Tableau Server Monitoring with Grafana and InfluxDB
Tamas Foldi, Starschema
@tfoldi
Who am I?

*old picture, I am way older than this.
- Five times Tableau Zen Master
- Co-founder of a consulting company (Starschema)
- Like to hack and glue things together
Monitoring. But Why?
- Status and Availability
- Real time usage statistics
- Early alerts for performance issues
Level 1: Built-in Alerts
-
Free as fresh air
-
Tableau Status updates, disk space alerts
-
Alerts in emails only
-
No hardware, performance or customer metrics
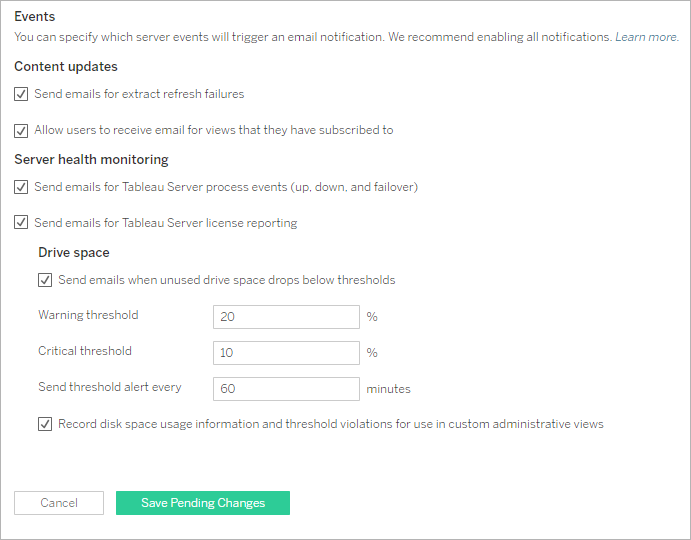
If your Tableau Server dies - your monitoring dies too.
Level 2: TabMon
-
Open source, pretty comprehensive
-
Stores data in Postgres (not good)
-
JMX, Windows Perf Counters
-
Windows only :(
-
Tableau Dashboard based - limited alerting
Might be an option for Windows based small deployments.
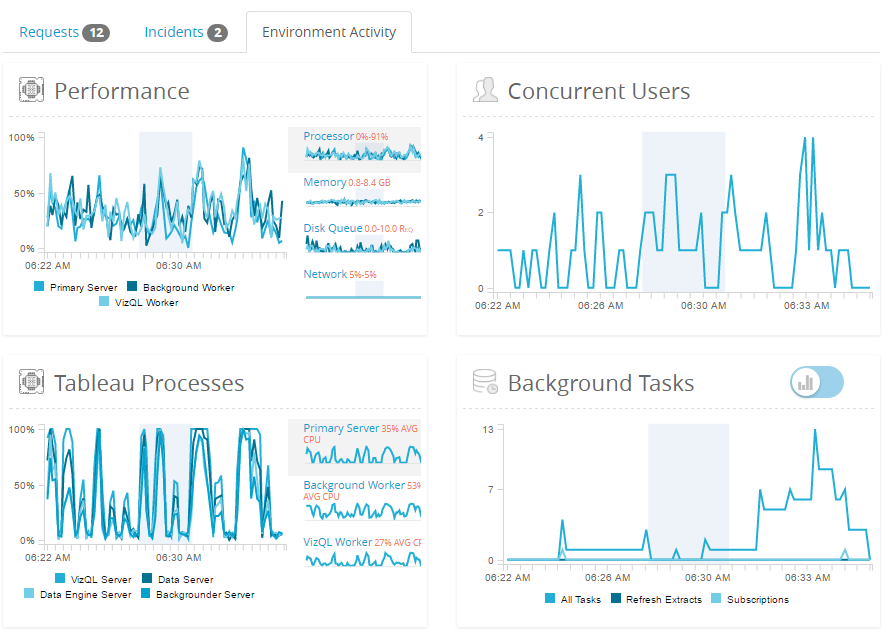
Level 3: Resource Monitor Tool
-
Licensed Add-on ($$)
-
Former PowerTools (acquisition)
-
Windows and Linux
-
Decent solution
Default in case you have the admin option
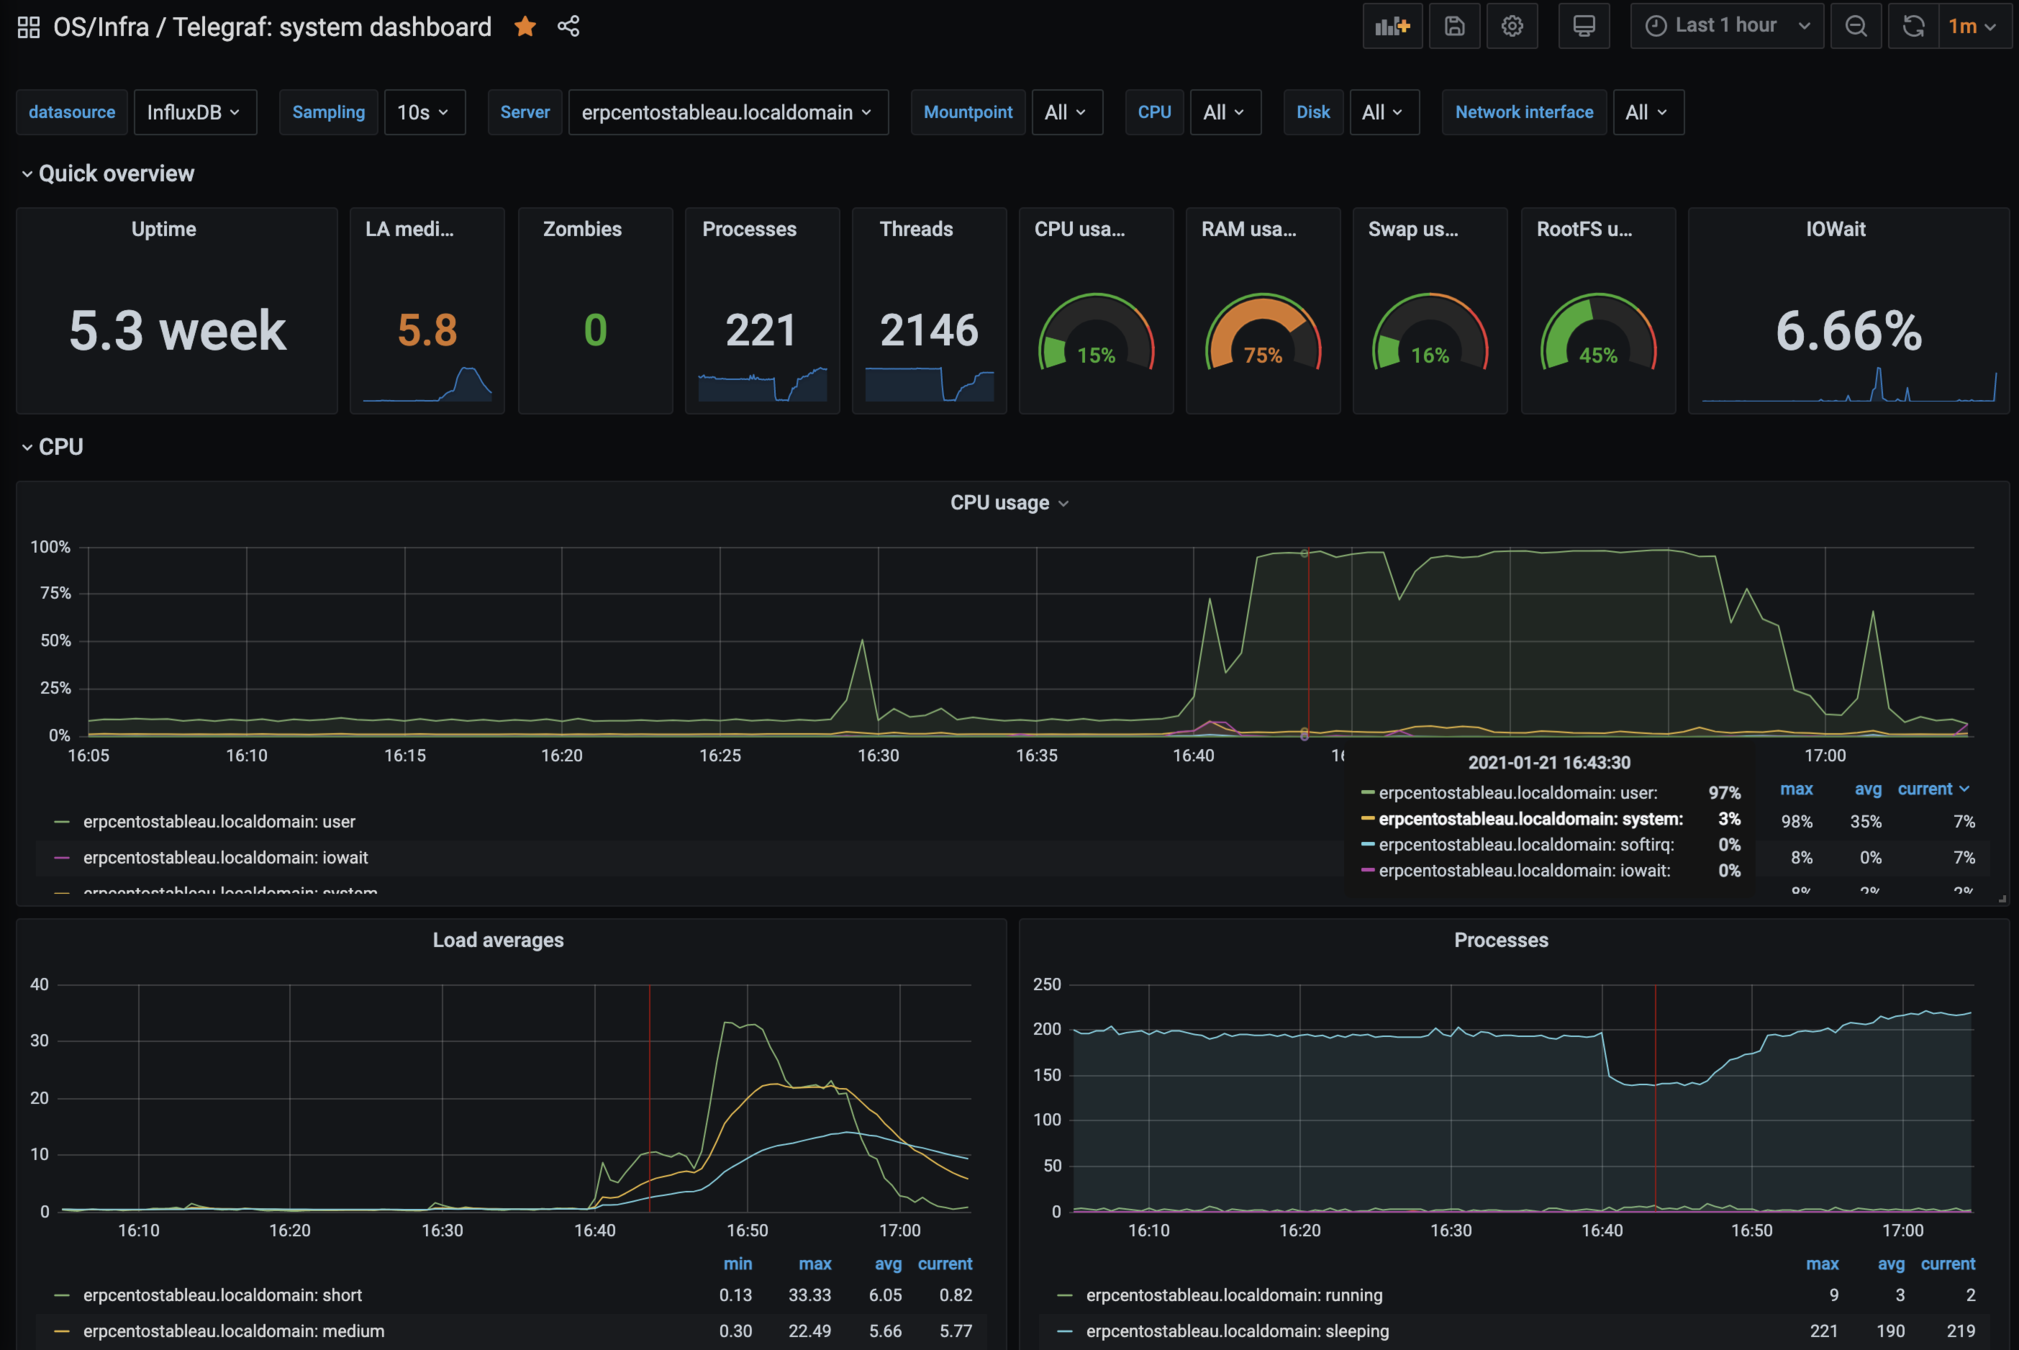
Level 9000: TIG Stack
Telegraf
InfluxDB
Grafana
Telegraf
Telegraf is an agent for collecting, processing, aggregating, and writing metrics.
Its design goals were to have a minimal memory footprint with a plugin system so that developers in the community can easily add support for collecting metrics.
InfluxDB
InfluxDB is an open-source time series database (TSDB).
It is optimized for fast, high-availability storage and retrieval of time series data in fields such as operations monitoring and real-time analytics
Supports retention and down scaling.
And Grafana is just such a beauty.
play.grafana.com
Ingredients
- OS Level Metrics
- CPU, Memory, IO, Disk Usage
- Network Info
- Load balancer latency from end-users
- Tableau Server Status
- Status as whole and for each services
- JMX Counters
- # of VizQL Sessions, Cache Hit ratio
- Log files (optional
- Postgres Data (optional)
all, without impacting the Server performance
Installing the
TIG stack
https://www.howtoforge.com/tutorial/how-to-install-tig-stack-telegraf-influxdb-and-grafana-on-ubuntu-1804/
https://medium.com/starschema-blog/monitor-your-infrastructure-with-influxdb-and-grafana-on-kubernetes-a299a0afe3d2
OS Level Monitoring
    [[inputs.cpu]]
      percpu = true
      totalcpu = true
      collect_cpu_time = false
      report_active = false
    [[inputs.disk]]
      ignore_fs = ["tmpfs", "devtmpfs", "devfs"]
    [[inputs.diskio]]
    [[inputs.kernel]]
    [[inputs.mem]]
    [[inputs.processes]]
    [[inputs.swap]]
    [[inputs.system]]
telegraf.conf
Serverinfo.xml
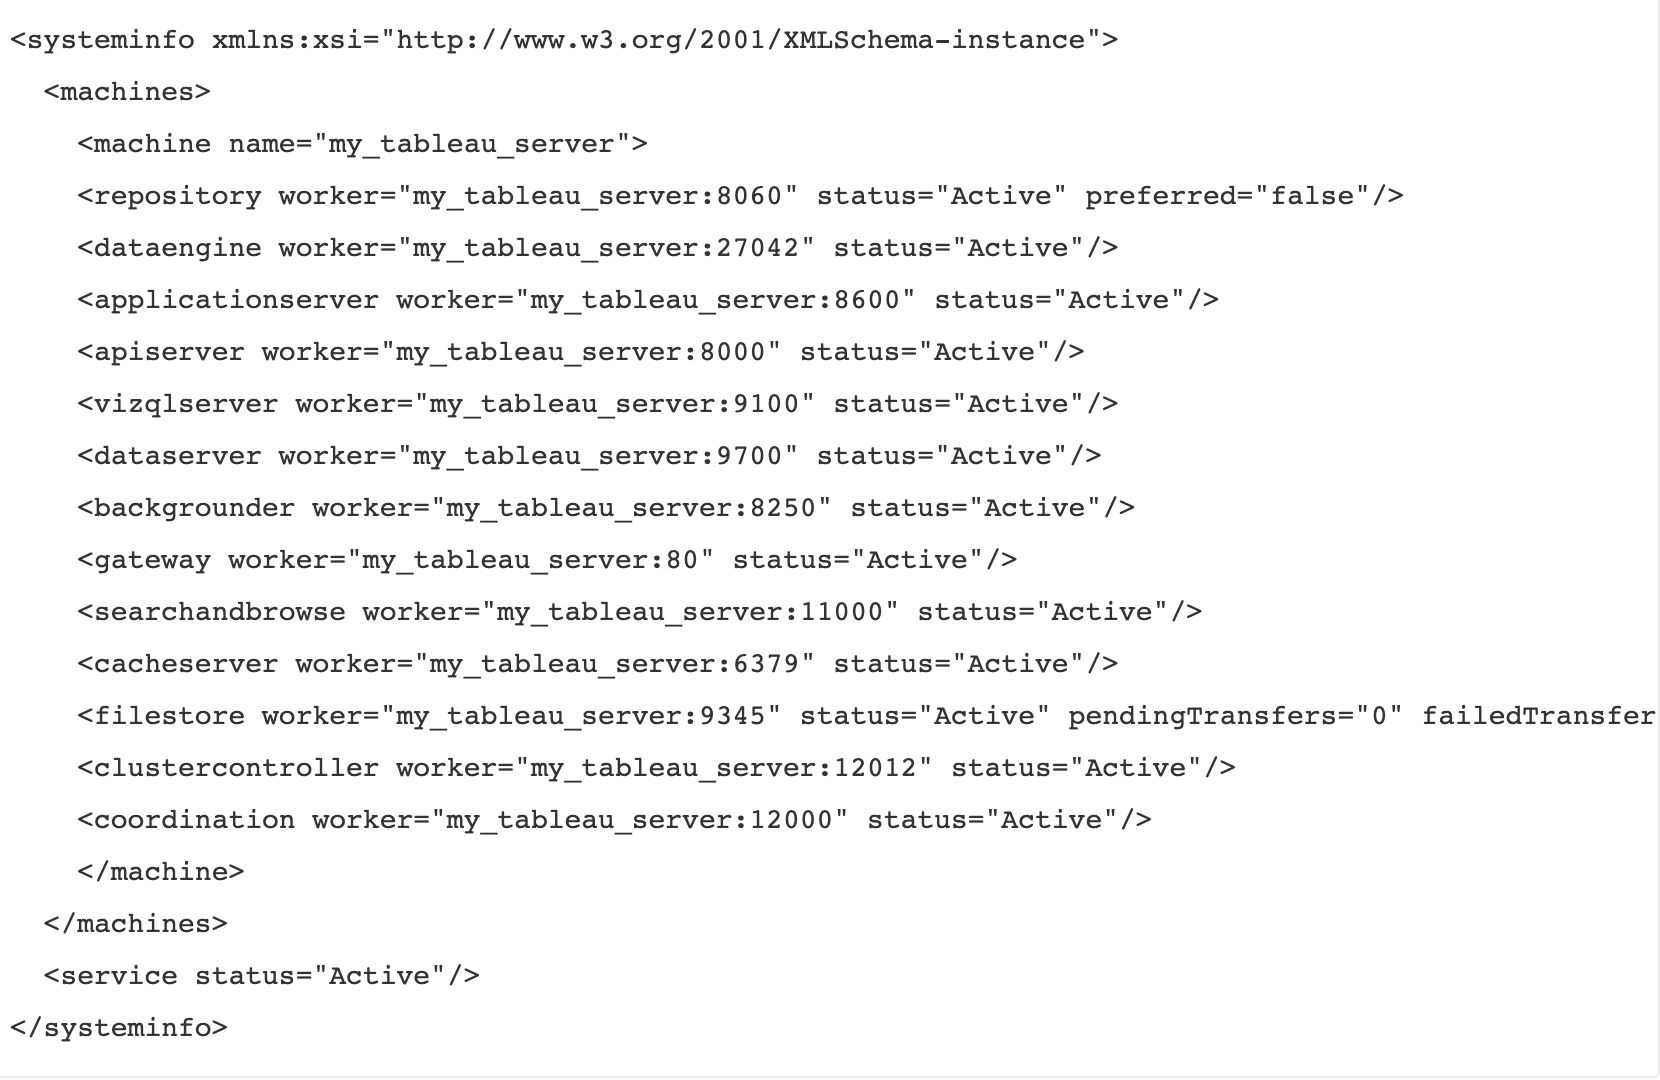
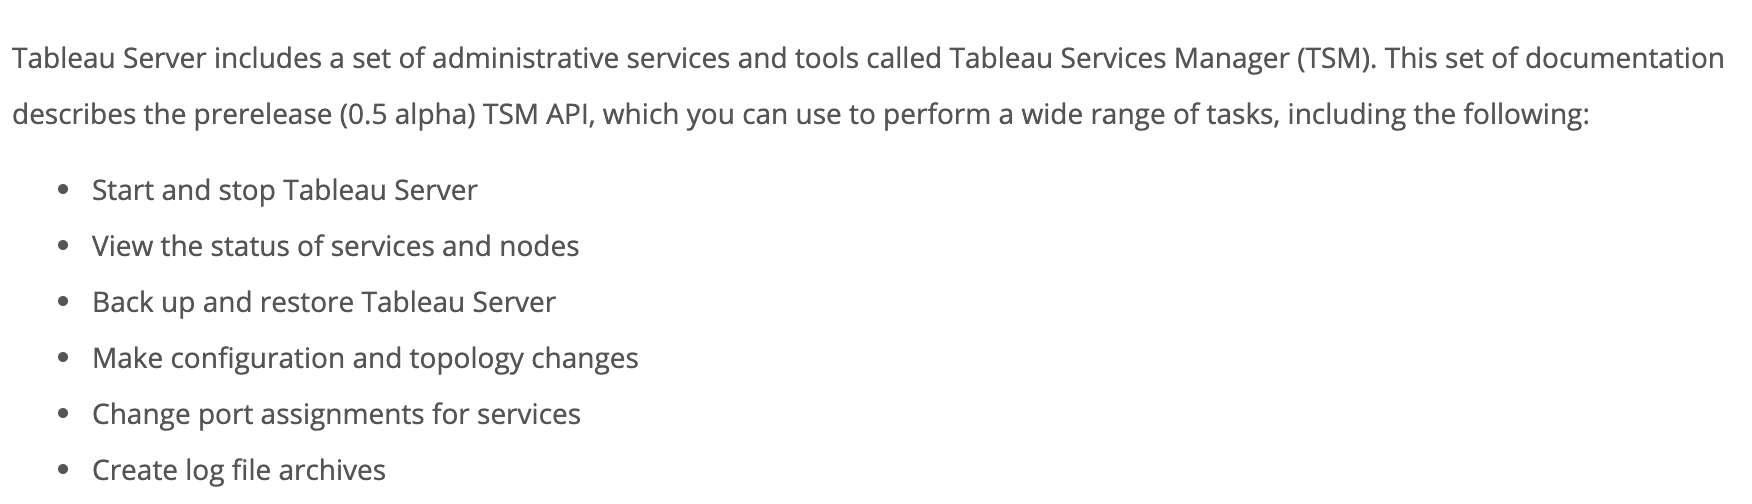
TSM API
https://help.tableau.com/v0.0/api/tsm_api/en-us/docs/tsm-reference.htm
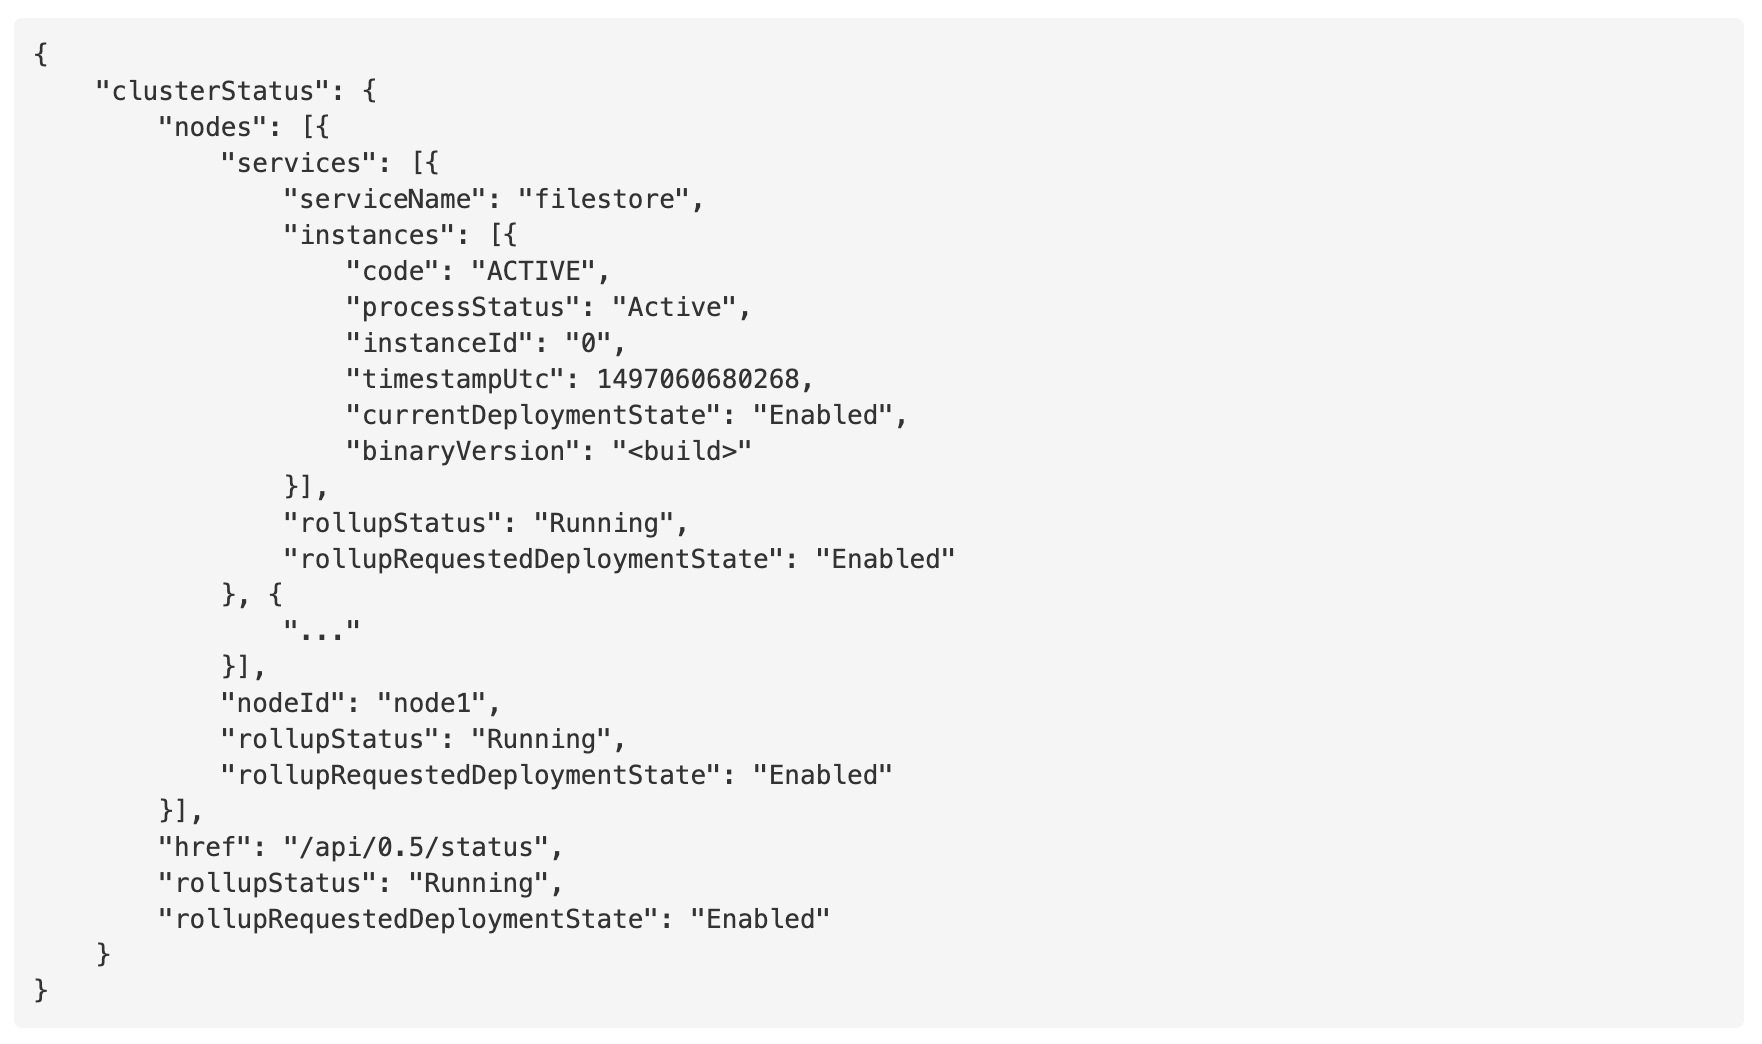
TSM API - /status
https://help.tableau.com/v0.0/api/tsm_api/en-us/docs/tsm-reference.htm#status
In Grafana
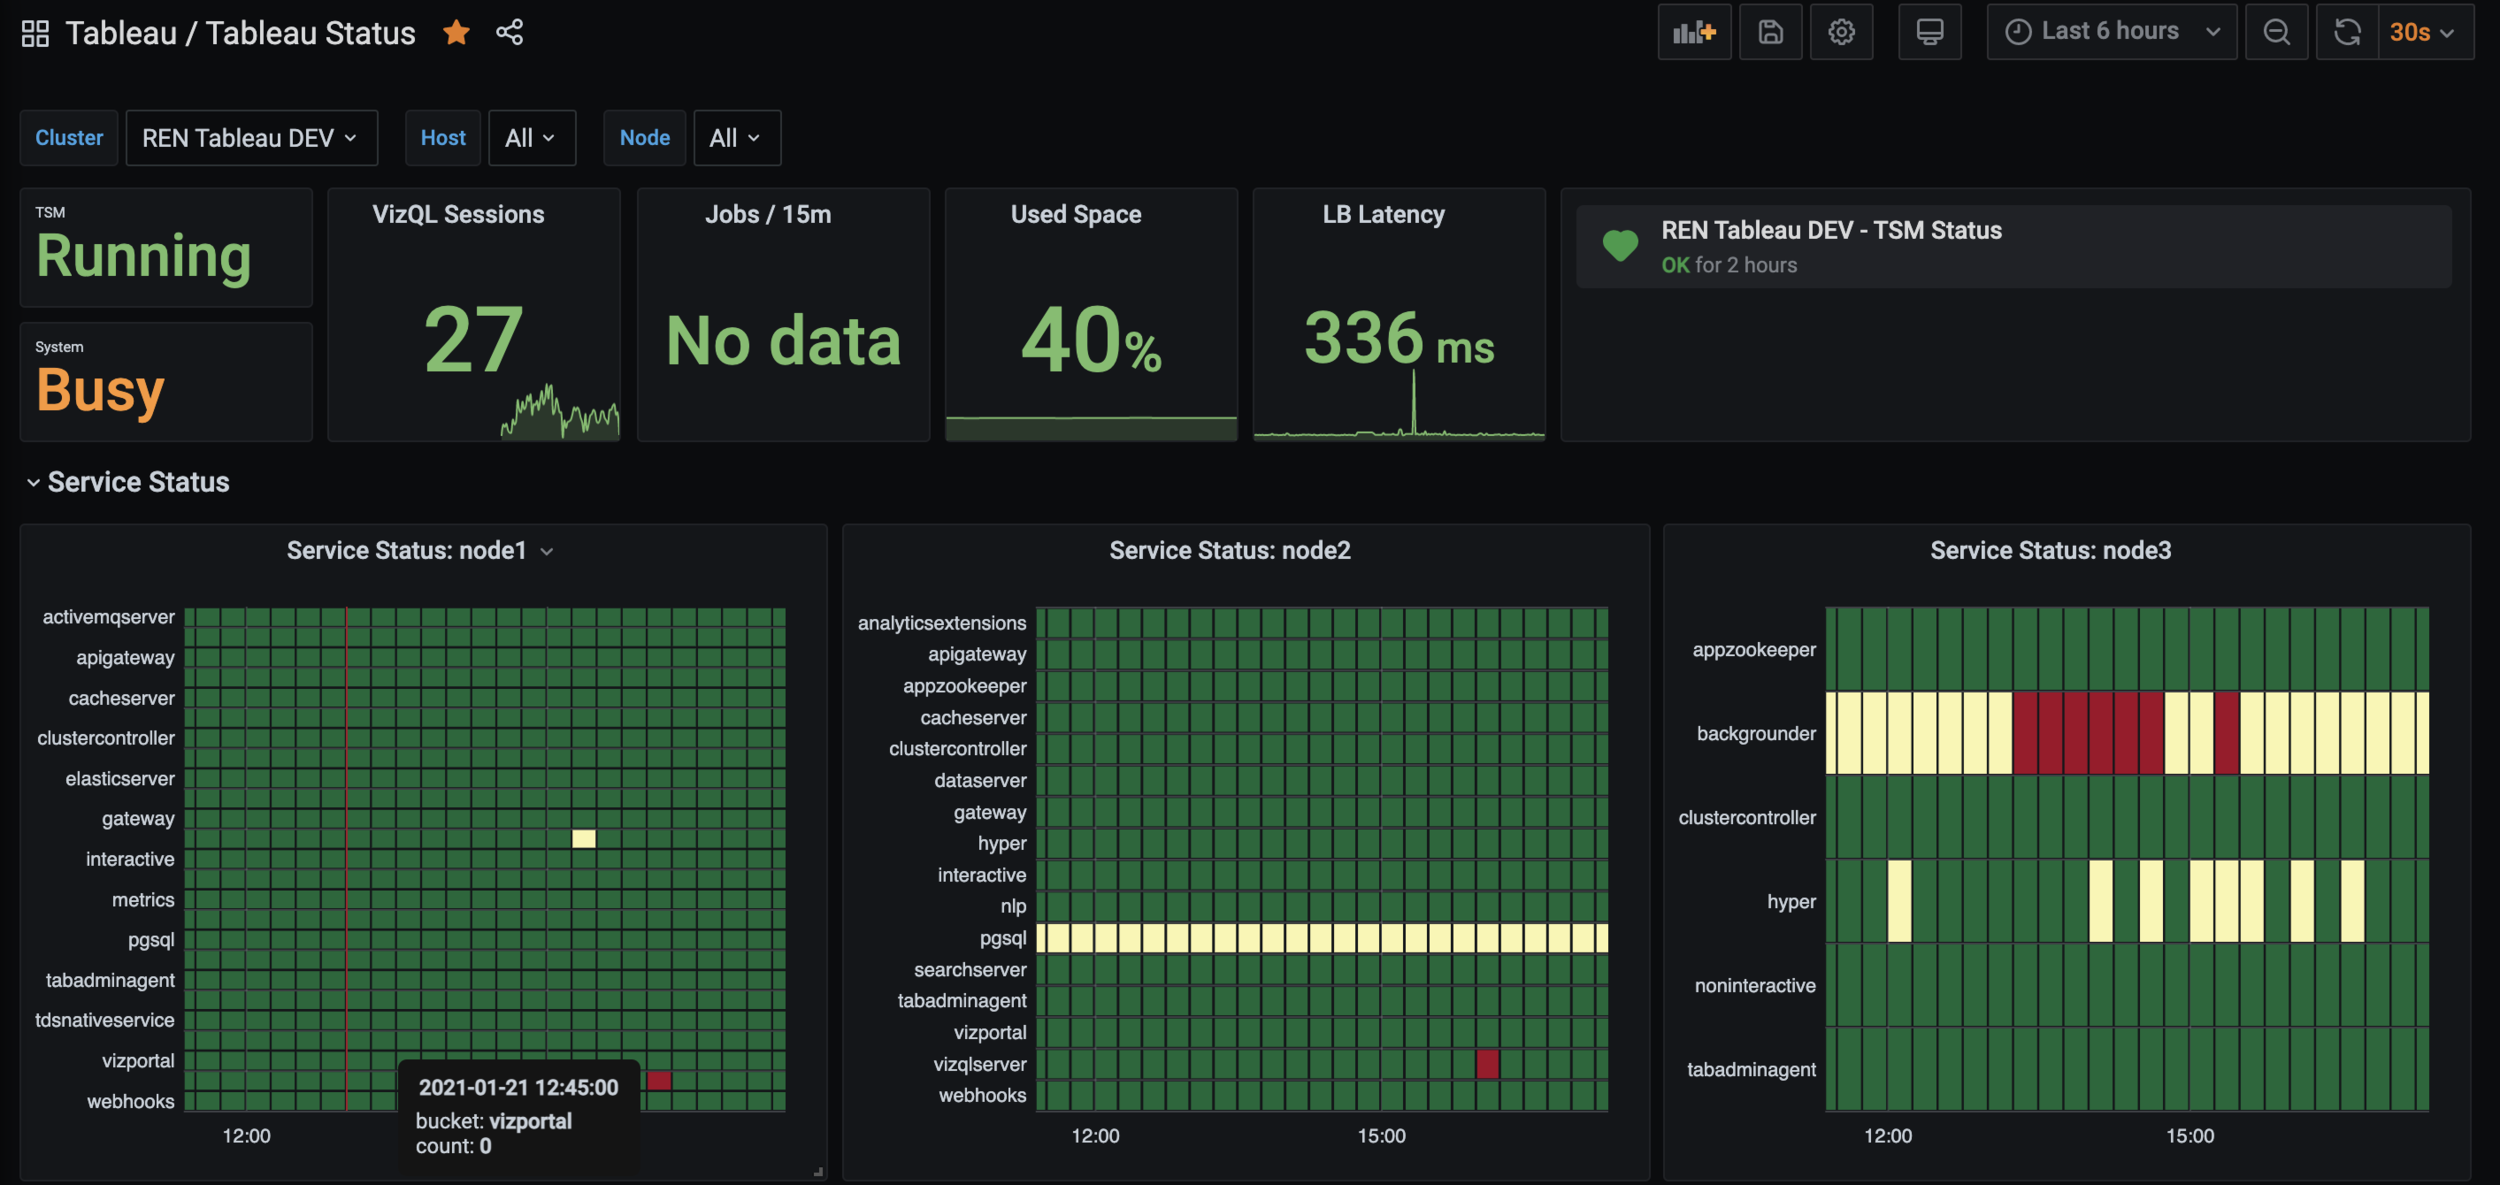
https://medium.com/starschema-blog/tableau-services-manager-tsm-api-the-undocumented-passwordless-authentication-9b76ed00119d
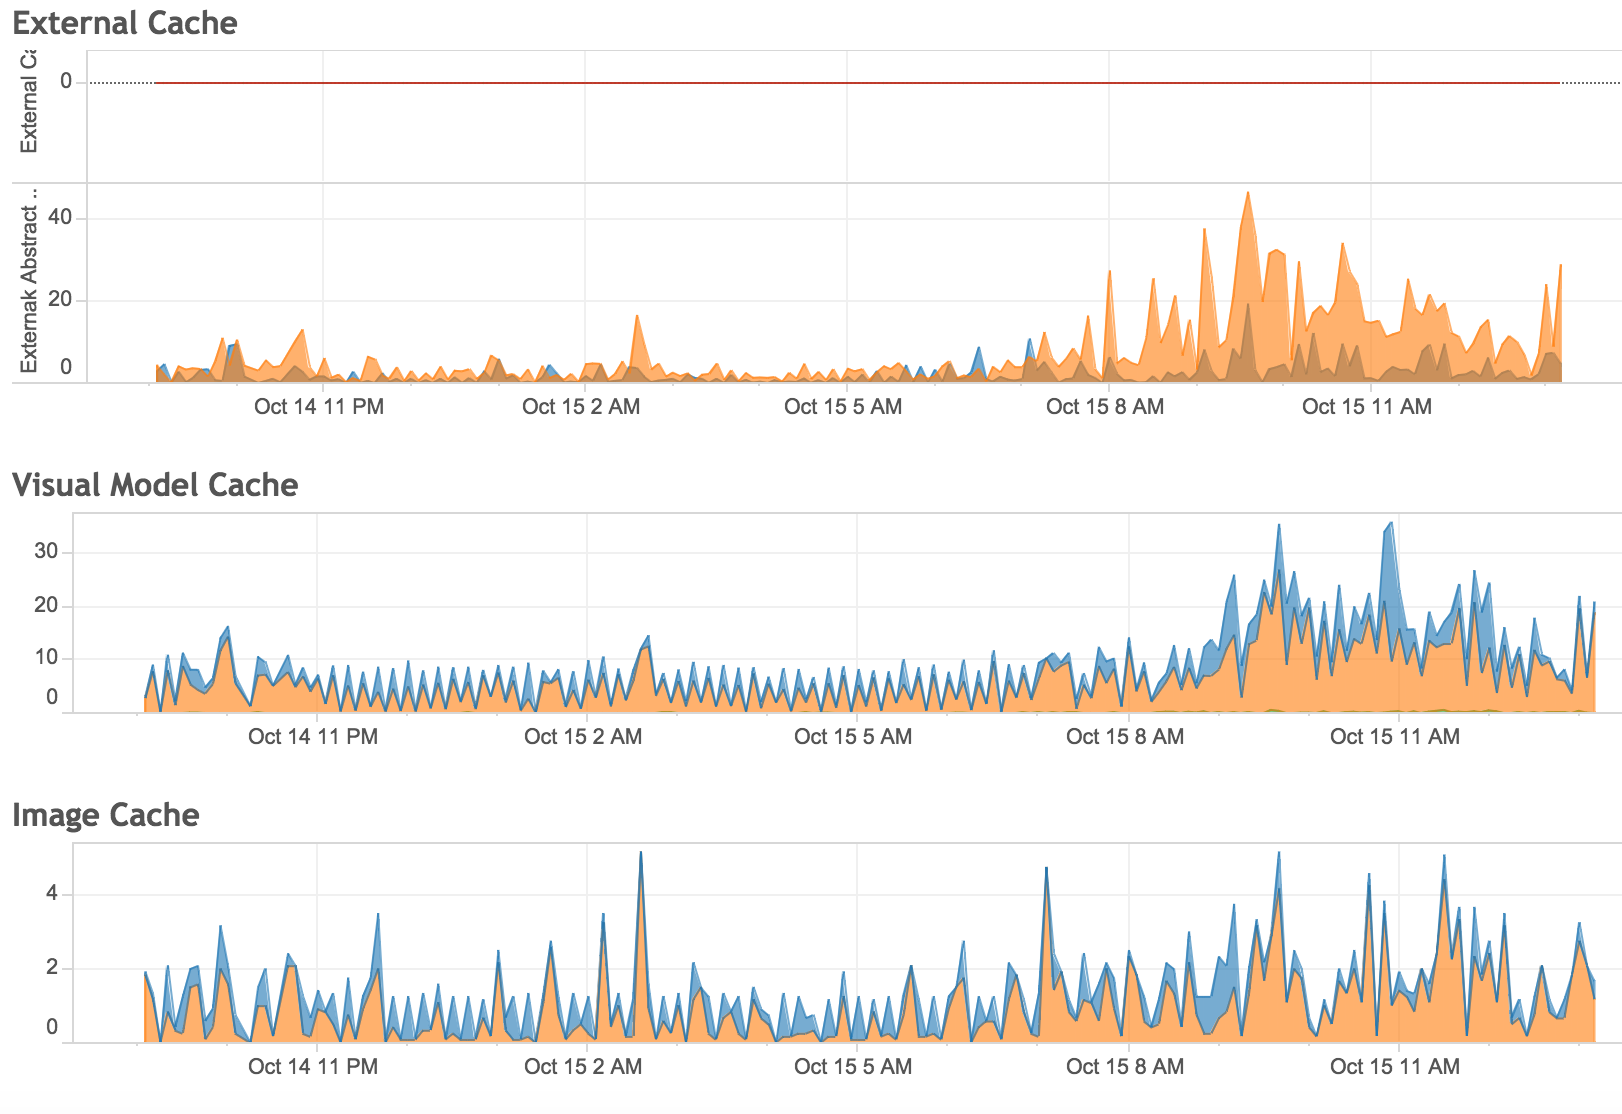
And finally, JMX.
Tableau JMX
JMX allows getting application-specific performance counters from vizql servers
Disabled by default, to enable:
tsm configuration set -k service.jmx_enabled -v true
Metrics to read
- Number of bootstraps, active sessions
- Backgrounder jobs (failed, succeeded, extract jobs)
- Cache/hit ratio
- Memory consumption
- Query times
Last but not least.
Alerting.
All together:
https://medium.com/starschema-blog/
Thank you!
Got questions?
Tableau Server Monitoring with Grafana and InfluxDB
By Tamas Foldi


