Debugging Heap Snapshots to Find Memory Leaks
🔍🕵️♂️📈
- Theryn Groetken
What the wat?
- 📸 What are Heap Snapshots?
- 🤷♂️ Why did we do this?
- 🕵️♂️ How Heap Snapshots were used to find a big leak!

📸 What are heap snapshots?
Intro and Terminology
The Chrome DevTools heap profiler shows memory distribution by your application's JavaScript objects and related DOM nodes.

Again, wat?
Fancier Explanation - JS heap snapshots can be used to analyze memory graphs, compare snapshots, and find memory leaks.
TL;DR - Heap Snapshots let you see what is happening with your app's JavaScript, in memory.

👁🗨 Views of Snapshots
-
Summary
- shows objects grouped by the constructor name. Use it to hunt down objects (and their memory use) based on type grouped by constructor name.
-
Comparison
- displays difference between two snapshots. Use it to compare two (or more) memory snapshots of before and after an operation.
-
Containment
- allows exploration of heap contents. It provides a better view of object structure, helping analyze objects referenced in the global namespace (window) to find out what is keeping them around.
-
Dominators
- shows the dominators tree and can be useful to find accumulation points.


🏛Columns In Views
- 👷♀️Constructor
- 🏊Shallow size
- 🪣Retained size
- 🏃♀️Distance
👷♀️Constructor

- global property
- roots
- closure
- array, string, number, regexp
- compiled code
- HTMLDivElement, HTMLAnchorElement, DocumentFragment
🏊Shallow Size
Shallow size column displays the sum of "shallow sizes" of all objects created by a certain constructor function.
The shallow size is the size of memory held by an object itself (generally, arrays and strings have larger shallow sizes).
🪣 Retained Size
Retained size column displays the maximum retained size among the same set of objects.
The size of memory that can be freed once an object is deleted (and this its dependents made no longer reachable) is called the retained size.
🏃♀️Distance
Distance displays the distance to the root using the shortest simple path of nodes.
🥛Got all that?

🤷♂️ Why did we do this?
A case study with Jest 🃏
Dun Dun Dun
Mobile has been collecting test coverage on Pull Request for about ~8 months now. But the github action being used was faulty.
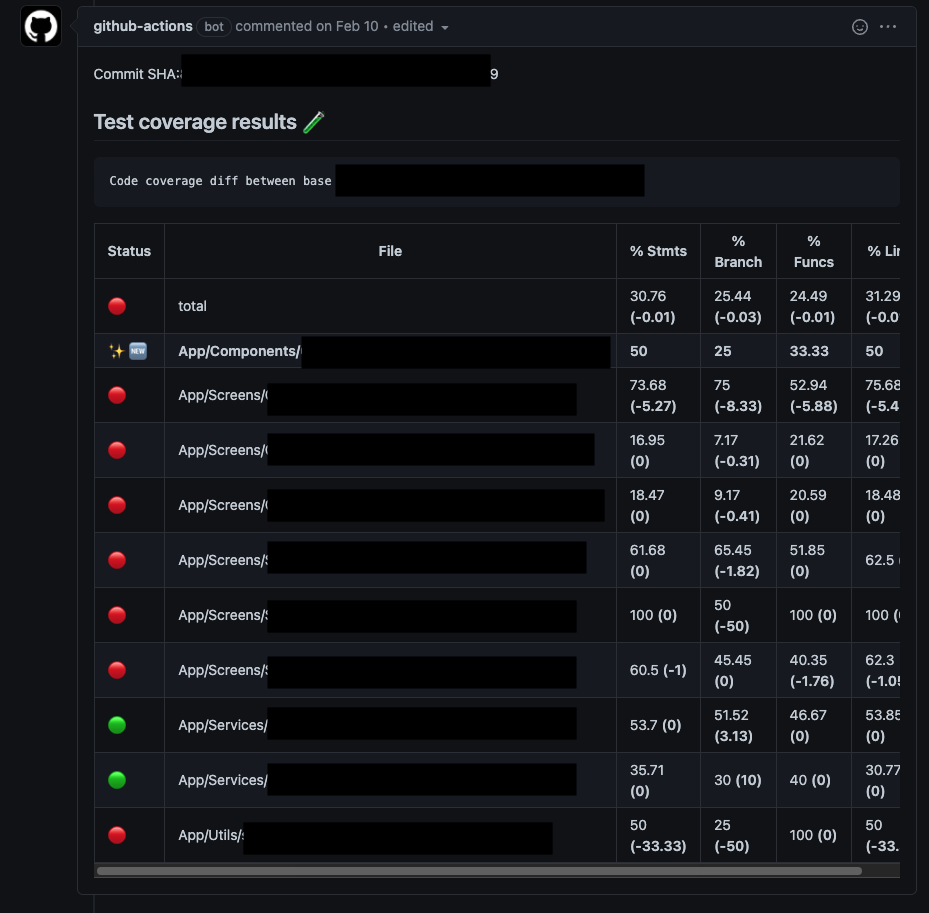
So we decided to move back to one that has had a recent rewrite and added cool new features like "annotations of where coverage could be added" on changed files in a PR.
So what's the problem?
Funny enough - there really shouldn't have been one. But low and behold - you can't just upgrade something without something else breaking - can you? 😅
<--- Last few GCs --->

[3140:0x5772ae0]   200367 ms: Scavenge 1840.0 (2074.6) -> 1833.6 (2074.6) MB, 8.1 / 0.2 ms  (average mu = 0.389, current mu = 0.489) allocation failure
[3140:0x5772ae0]   200466 ms: Scavenge 1841.2 (2074.6) -> 1836.8 (2080.4) MB, 13.8 / 0.1 ms  (average mu = 0.389, current mu = 0.489) allocation failure
[3140:0x5772ae0]   201606 ms: Mark-sweep 1852.6 (2082.3) -> 1840.4 (2085.6) MB, 975.2 / 0.2 ms  (average mu = 0.393, current mu = 0.398) allocation failure scavenge might not succeed


<--- JS stacktrace --->

FATAL ERROR: Ineffective mark-compacts near heap limit Allocation failed - JavaScript heap out of memory
 1: 0xb09980 node::Abort() [/usr/local/bin/node]
 2: 0xa1c235 node::FatalError(char const*, char const*) [/usr/local/bin/node]
 3: 0xcf77be v8::Utils::ReportOOMFailure(v8::internal::Isolate*, char const*, bool) [/usr/local/bin/node]
 4: 0xcf7b37 v8::internal::V8::FatalProcessOutOfMemory(v8::internal::Isolate*, char const*, bool) [/usr/local/bin/node]
 5: 0xeaf3d5  [/usr/local/bin/node]
 6: 0xeafeb6  [/usr/local/bin/node]
 7: 0xebe3de  [/usr/local/bin/node]
 8: 0xebee20 v8::internal::Heap::CollectGarbage(v8::internal::AllocationSpace, v8::internal::GarbageCollectionReason, v8::GCCallbackFlags) [/usr/local/bin/node]
 9: 0xec1d9e v8::internal::Heap::AllocateRawWithRetryOrFailSlowPath(int, v8::internal::AllocationType, v8::internal::AllocationOrigin, v8::internal::AllocationAlignment) [/usr/local/bin/node]
10: 0xe83012 v8::internal::Factory::AllocateRaw(int, v8::internal::AllocationType, v8::internal::AllocationAlignment) [/usr/local/bin/node]
11: 0xe7b624 v8::internal::FactoryBase<v8::internal::Factory>::AllocateRawWithImmortalMap(int, v8::internal::AllocationType, v8::internal::Map, v8::internal::AllocationAlignment) [/usr/local/bin/node]
12: 0xe7d330 v8::internal::FactoryBase<v8::internal::Factory>::NewRawOneByteString(int, v8::internal::AllocationType) [/usr/local/bin/node]
13: 0x110e678 v8::internal::String::SlowFlatten(v8::internal::Isolate*, v8::internal::Handle<v8::internal::ConsString>, v8::internal::AllocationType) [/usr/local/bin/node]
14: 0x110ede4 v8::internal::String::SlowEquals(v8::internal::Isolate*, v8::internal::Handle<v8::internal::String>, v8::internal::Handle<v8::internal::String>) [/usr/local/bin/node]
15: 0x121c12a v8::internal::Runtime_StringEqual(int, unsigned long*, v8::internal::Isolate*) [/usr/local/bin/node]
16: 0x15f0a99  [/usr/local/bin/node]
Run after run - OOMs were the cause of failure.
🐛 Debugging memory seems preemptive, right?
✅ Correct! There were a few things that were tried before moving onto heap snapshots.
- 🚫 Don't `yarn install` every test run
- 🚫 Upgrade Jest to 28-alpha
- 🚫 Try setting `max-workers` with dynamic core size
- 🚫 --clearCache
- 🚫 --coverageProvider=v8
🙅 None of that Worked
So now what?

We figure out why...
📸 Heap Snapshots... 🙌

🕵️♂️ How Heap Snapshots were used to find a big leak!
The moment we've all been sort of waiting for...🥸
How can we debug jest?
Subtitle
node --inspect-brk --expose-gc ./node_modules/.bin/jest --runInBand --logHeapUsage
🧰 Dev Tools
From here - it is just applying the knowledge we just covered.
Since we're looking for a memory leak - we can record a couple of snapshots (in the `memory tab`) and use the `compare` view to diff between two snapshots. Which is exactly what we'll do.
⏳Jest's output
The heap snapshots will definitely help us - but it's important to call out that this was a clear memory leak.
Looking at the heap logging - it's apparent that there is a leak and that the leak is linear in nature. As each test passes, the heap size increases.
 PASS  App/1.spec.tsx (375 MB heap size)
 PASS  App/2.test.tsx (413 MB heap size)
 PASS  App/3.test.tsx (460 MB heap size)
 PASS  App/4.spec.ts (500 MB heap size)
 PASS  App/5.spec.tsx (540 MB heap size)
 PASS  App/6.spec.tsx (581 MB heap size)
 PASS  App/7.spec.tsx (617 MB heap size)
 PASS  App/8.spec.tsx (750 MB heap size)
 PASS  App/9.tsx (786 MB heap size)
 PASS  App/10.spec.tsx (824 MB heap size)
 PASS  App/11.tsx (898 MB heap size)
(note the above is an aggregate of a few tests - so it looks potentially exponential but it isn't - at least not from my observations it wasn't)
Before we do that its worth mentioning...
The Snapshots
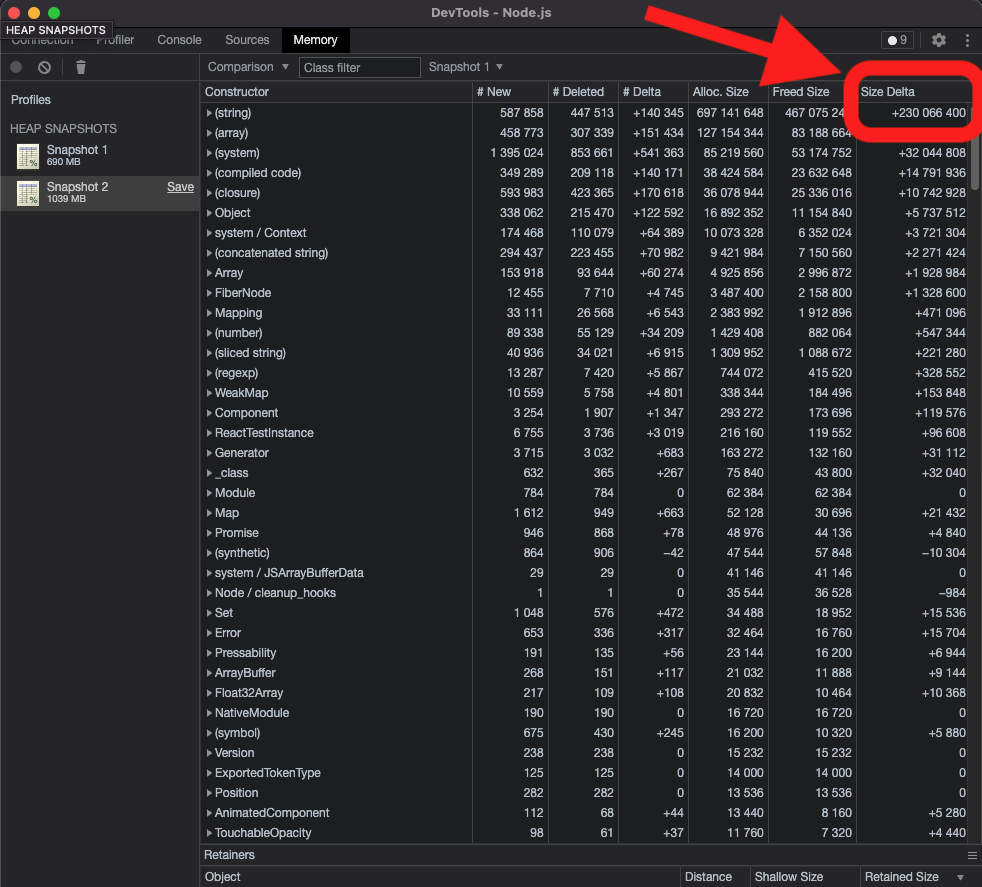
🚰And there it is!

But what is it?
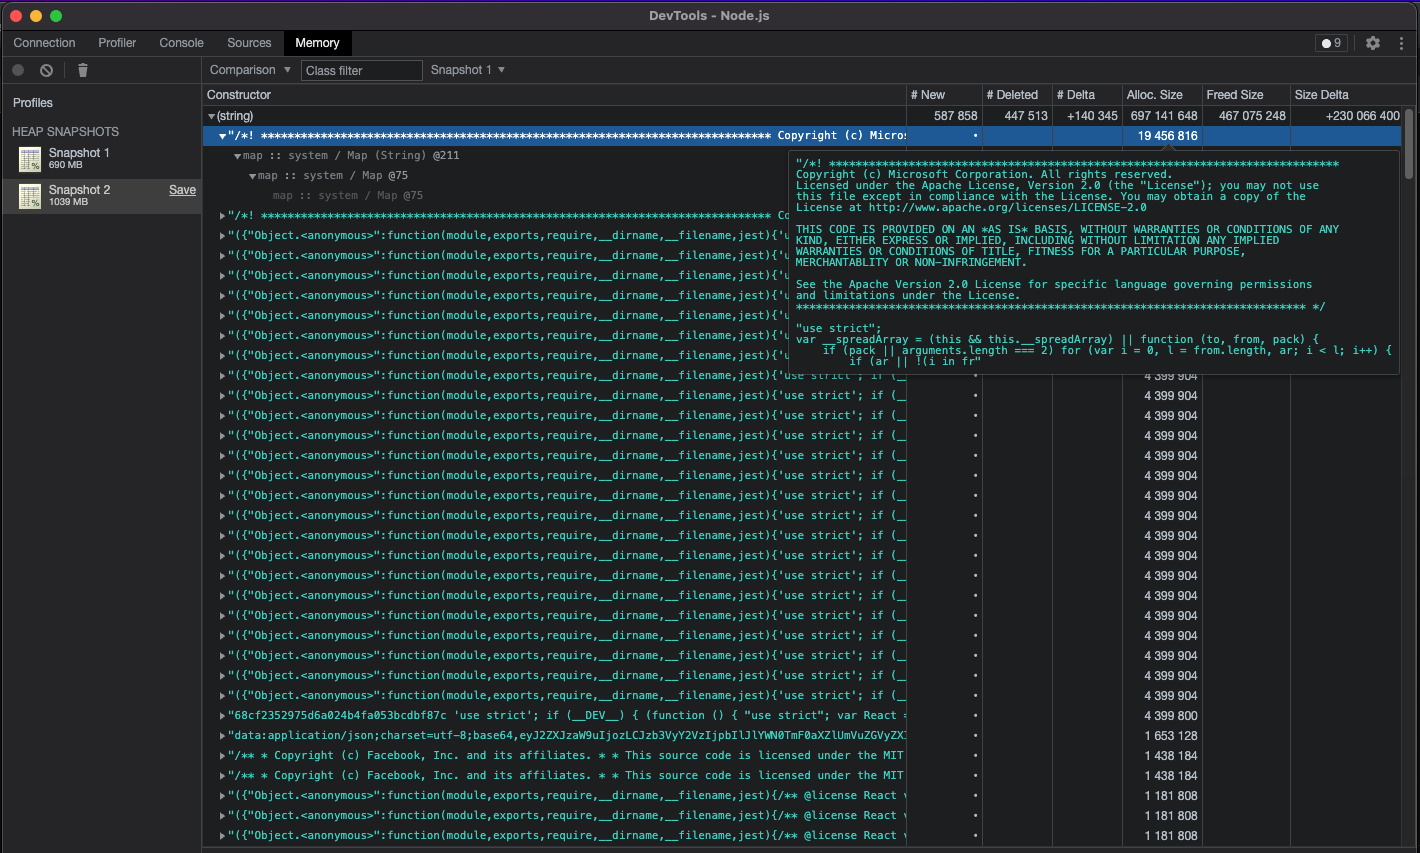
A license? This looks like a node_module being loaded in... and with every test? 🤔
💾 What do the Retainers tell us?
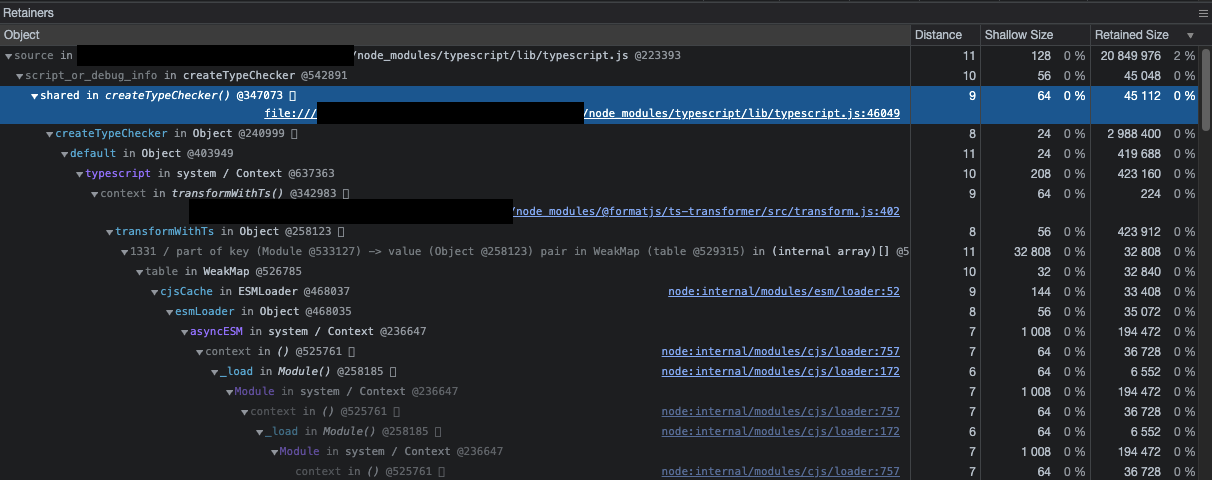
Oh dear 🦌 - is the entire TypeScript library being imported on every test?!
🔍 Time to google
> typescript - jest - memory leak
https://github.com/kulshekhar/ts-jest/issues/1967
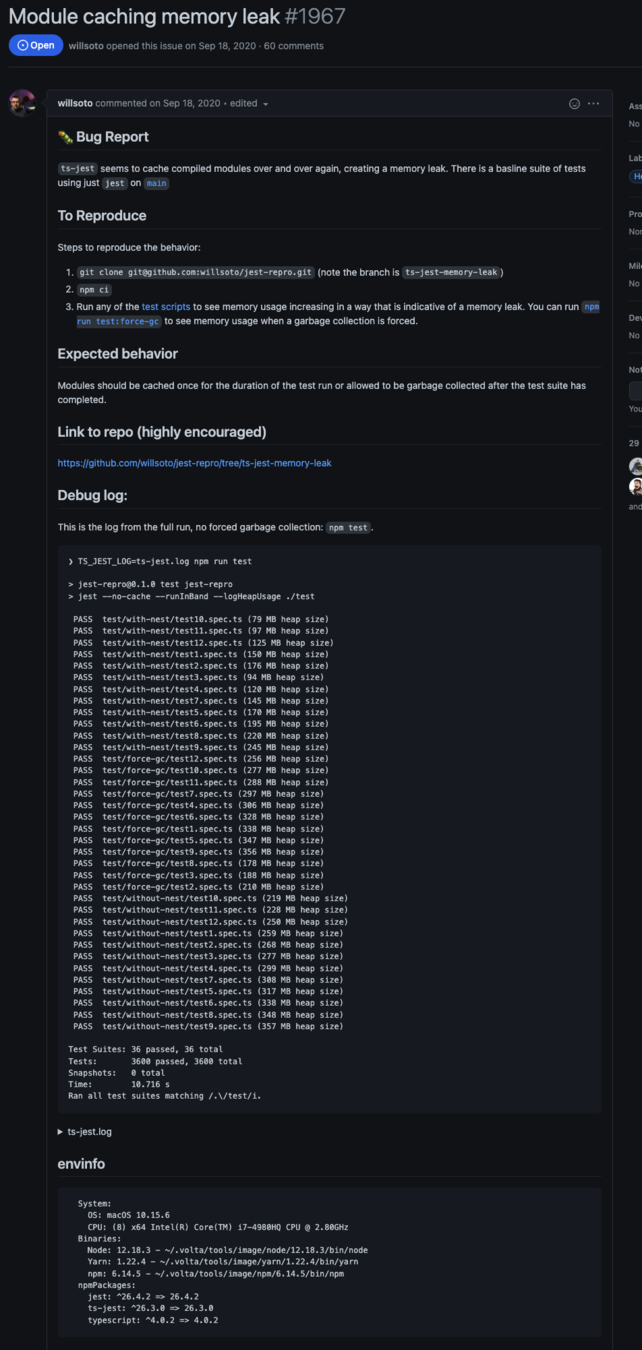

...
📚TL;DR
Turns out - there is a significant memory leak in Jest. But the neat part is - no one can agree on whose fault it is. Jest, ts-jest, node? 🤷♂️
The only thing we do know is that this problem appears after upgrading to anything after `v16.10.0`.

So what can we do?
In React Native land - not much at all. There were attempts to integrate with newer build packages like `@swc/jest` and `@esbuild/jest` but neither of them have good support for React Native. (Web may be able to use these packages with some success - and added benefit of much faster test times).
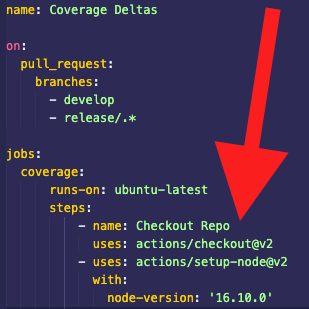
For mobile - we have to pin our actions to `node v16.10.0` as well as our `engines` in our package.json.
Pinning Node in an Action
Since we can't change our build tooling - we'll have to pin our version.
Theoretically - this should mitigate our CI issues until the Open Source teams at play have time to resolve the issue.
Did it work?

📝 Take Aways?
- Jest is a memory hog
- Just because its new - doesn't mean its better (node versions) - always double check your upgrades!
- Heap Snapshots have some seriously practical applications that can help us find and resolve problems faster than otherwise would be possible
Questions?

📸 Heap Snapshots
By Theryn


