Xdebug will forever change the way you debug your PHP code
Tim Bond
Cascadia PHP Conference - September 21, 2019
What can Xdebug do?
- Pretty formatting for var_dump
- Stack traces for Notices, Warnings, Errors and Exceptions
- Step debugger to use with IDEs
- Profiler
- Function call/variable assignment recording
- Code coverage functionality for use with PHPUnit
var_dump
object(DateTime)#1 (3) {
  ["date"]=>
  string(26) "1970-01-01 00:00:00.000000"
  ["timezone_type"]=>
  int(3)
  ["timezone"]=>
  string(19) "America/Los_Angeles"
}
object(DateTime)#1 (3) {
["date"]=>
string(26) "1970-01-01 00:00:00.000000"
["timezone_type"]=>
int(3)
["timezone"]=>
string(19) "America/Los_Angeles"
}
var_dump
xdebug.overload_var_dump=1
object(DateTime)[1]
  public 'date' => string '1970-01-01 00:00:00.000000' (length=26)
  public 'timezone_type' => int 3
  public 'timezone' => string 'America/Los_Angeles' (length=19)
Alternatively:
xdebug_var_dump
Error messages
Notice: Trying to get property 'foo' of non-object in index.php on line 3
Error messages

xdebug.default_enable=1 #on by default
Other error reporting tricks
- Scream: Show errors suppressed by @
- Override PHP error display settings:
- force_error_reporting
- force_display_errors
- Dump
- Collection
Today's examples use PhpStorm
You can also use
- Chrome
- Dev-PHP
- Eclipse
- Emacs
- KDevelop
- Komodo
- MacGDBP
- NetBeans
- Notepad++
- PHPEdit
- Protoeditor
- pugdebug
- Sublime Text
- VIM
- Visual Studio (and VS Code)
- XDebugClient
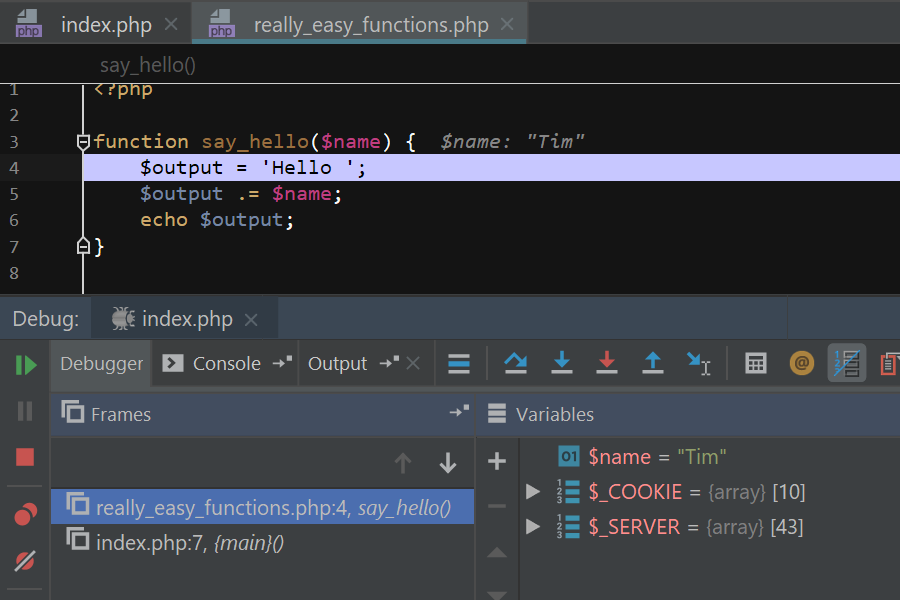
Step Debugging
- Pause script execution on a specific line
- "Follow" code as it is executed
- View/edit any variable
- Execute arbitrary code
Installation
Windows, no PECL, or if all else fails:
pecl install xdebugMac, Linux

Installation Wizard
- Download php_xdebug-2.6.1-7.2-vc15.dll
- Move the downloaded file to C:\xampp\php\ext
-
Edit
C:\xampp\php\php.iniand add the linezend_extension = C:\xampp\php\ext\php_xdebug-2.6.1-7.2-vc15.dll
- Restart the webserver
Docker?
version: '2'
services:
  webserver:
    image: phpstorm/php-73-apache-xdebug-27
    ports:
      - "80:80"
    volumes:
      - ./:/var/www/html
    environment:
      XDEBUG_CONFIG: remote_host=host.docker.internal
Try this
docker-compose.yml and then docker-compose up
Pro Tip
- Never edit php.ini
- See "Scan this dir for additional .ini files" in phpinfo
- Place an
xdebug.inifile there
Confirm installation

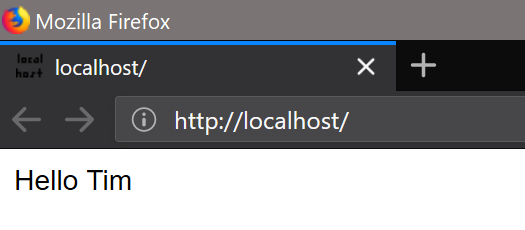
Normal Request/Response


Request/Response with Debugger

Turn on settings
xdebug.remote_enable=1
xdebug.remote_autostart=1

xdebug.remote_connect_back=1
#Alternatively:
xdebug.remote_host=localhost

#Optional, default 9000
xdebug.remote_port=9000
Then restart the webserver
Turn on the debugger
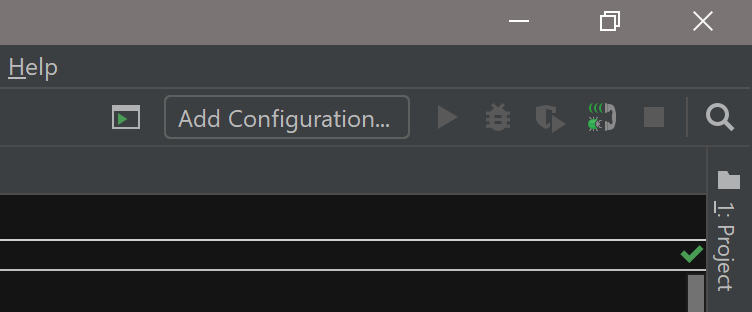
Debugger states


Off
On
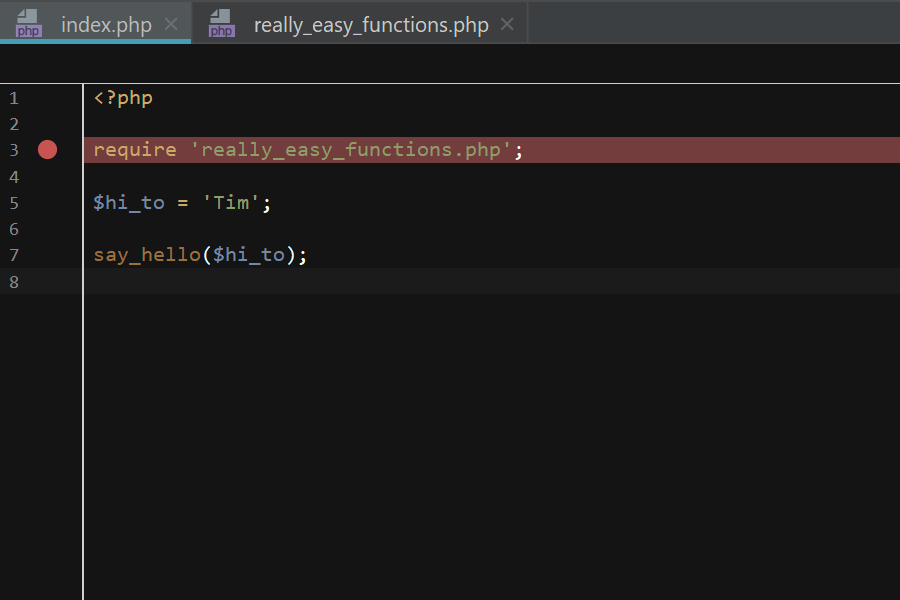
Breakpoints
- Line on which to stop
- Can only break where "something happens"
- Yes:
- Function call
- Variable assignment
- No:
- Blank line
- Curly brace
- Yes:
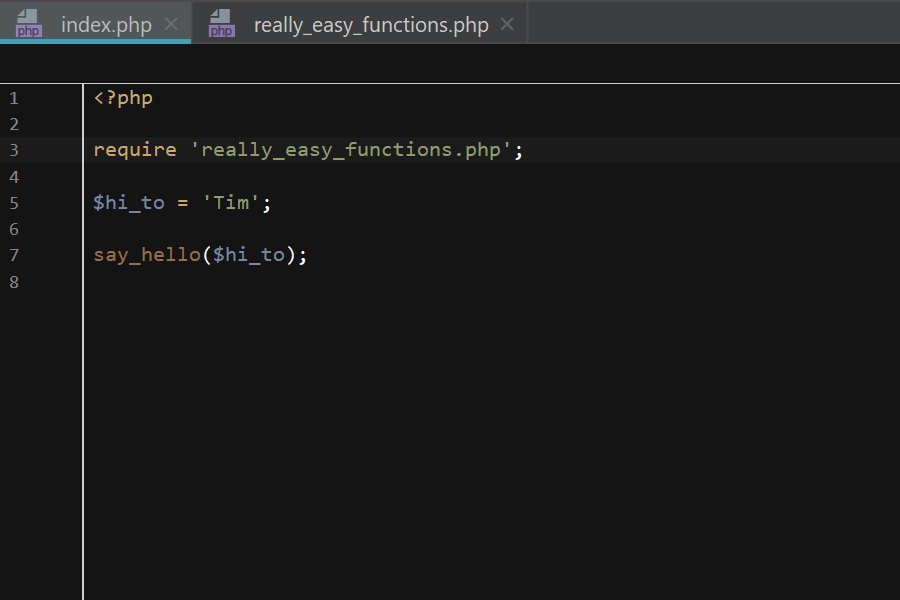
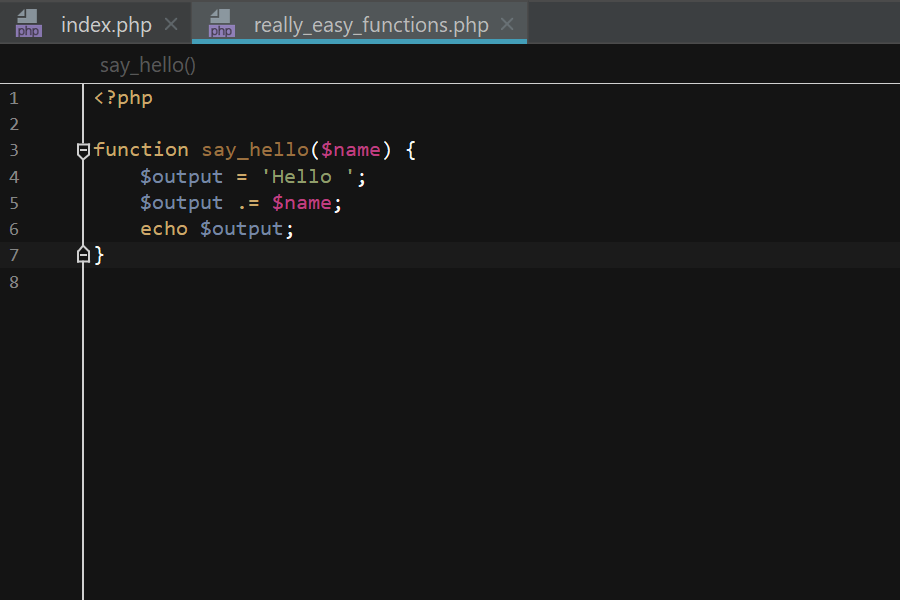
Setting a breakpoint


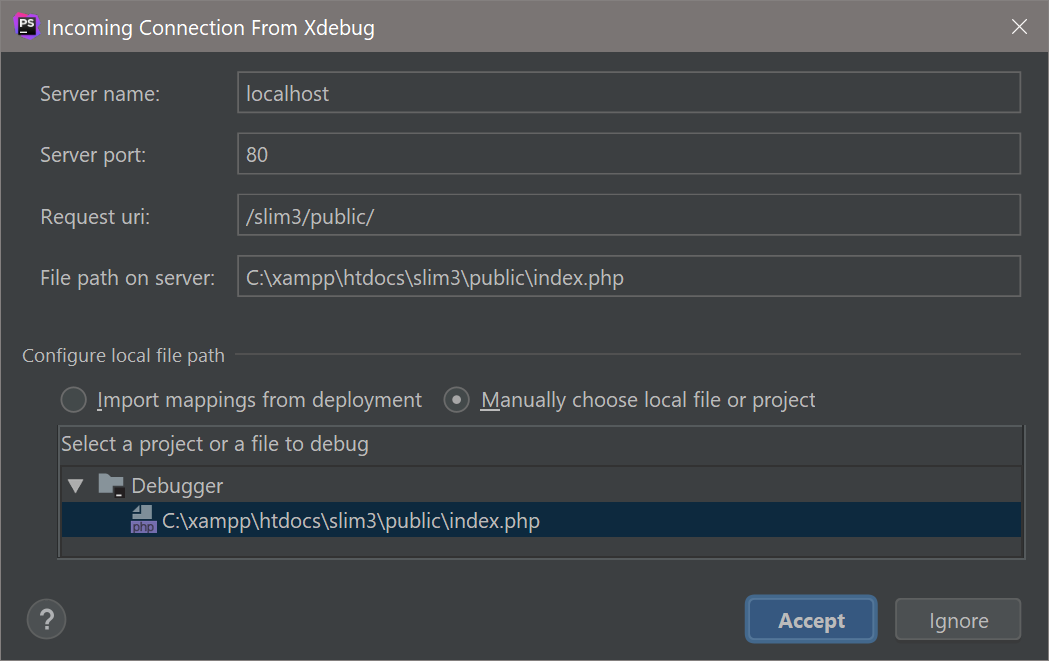
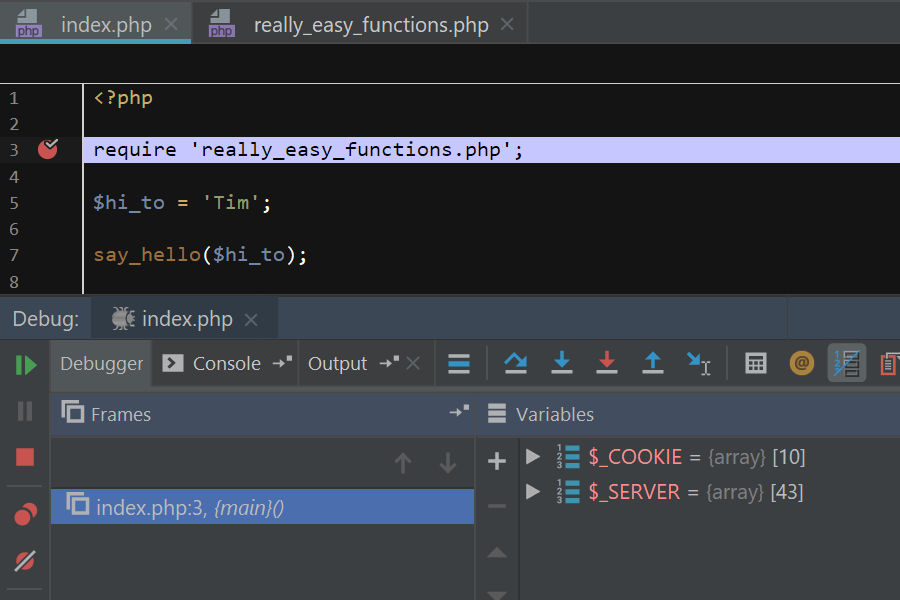
First Run (Zero Config)
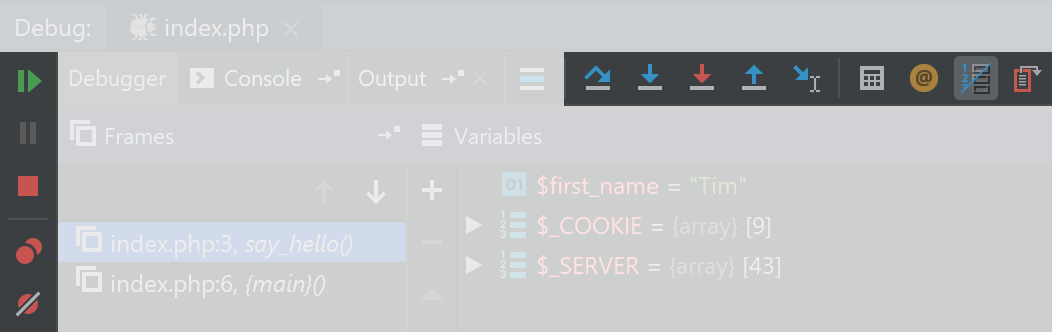
The Debugger

Icons
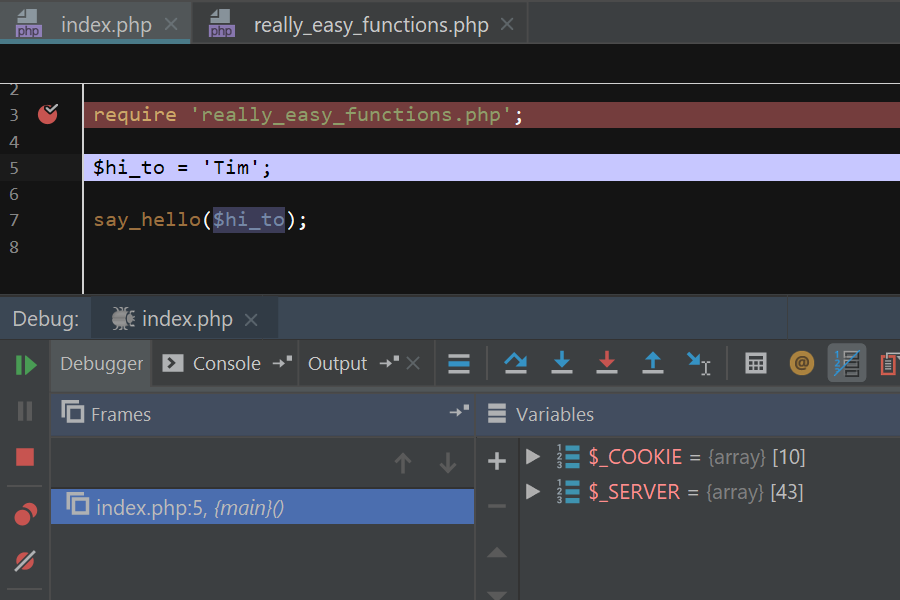
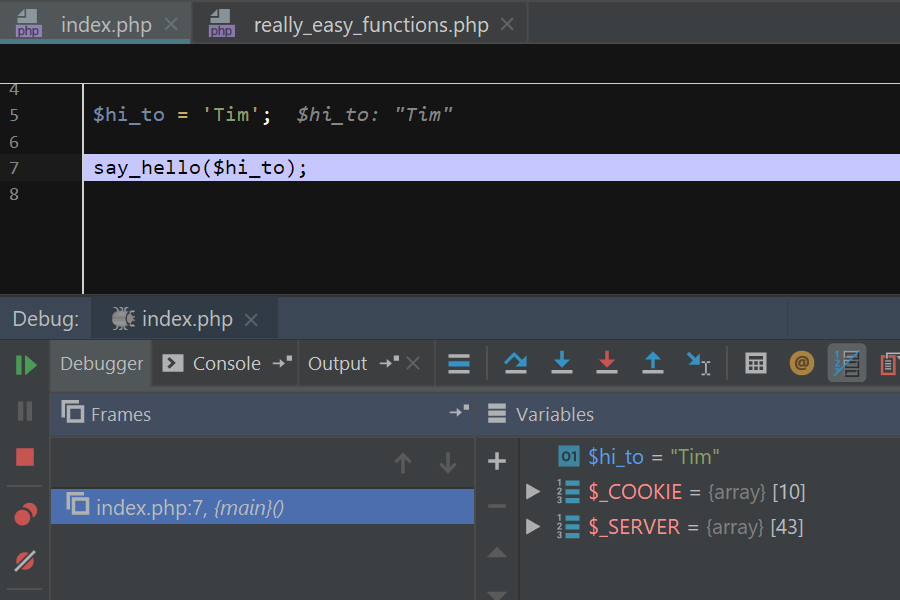
Step Over

Step Into

Force Step Into

Step Out

Run to Cursor

Evaluate Expression

Add method to skip list

Icons
Resume

Stop

View Breakpoints

Mute Breakpoints

Frames

Variables

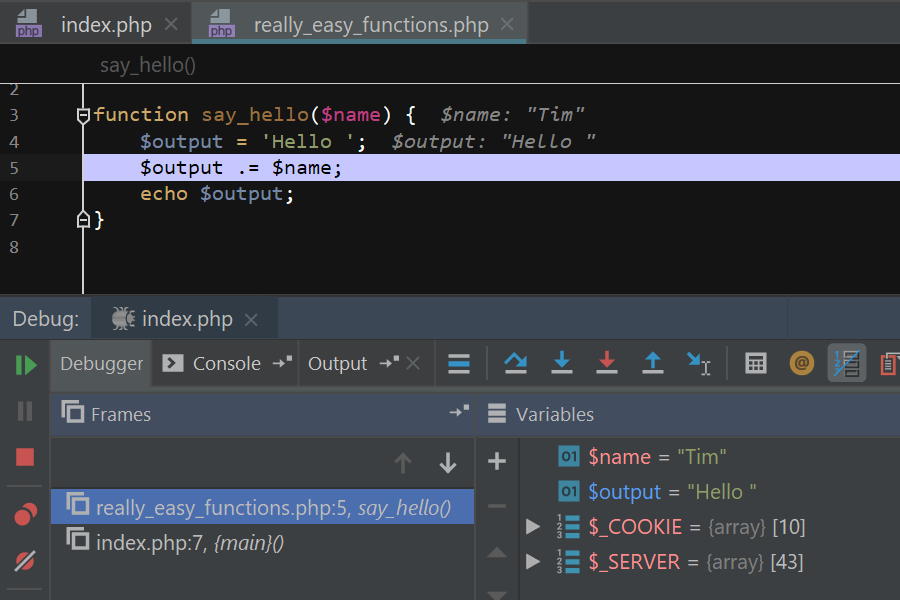
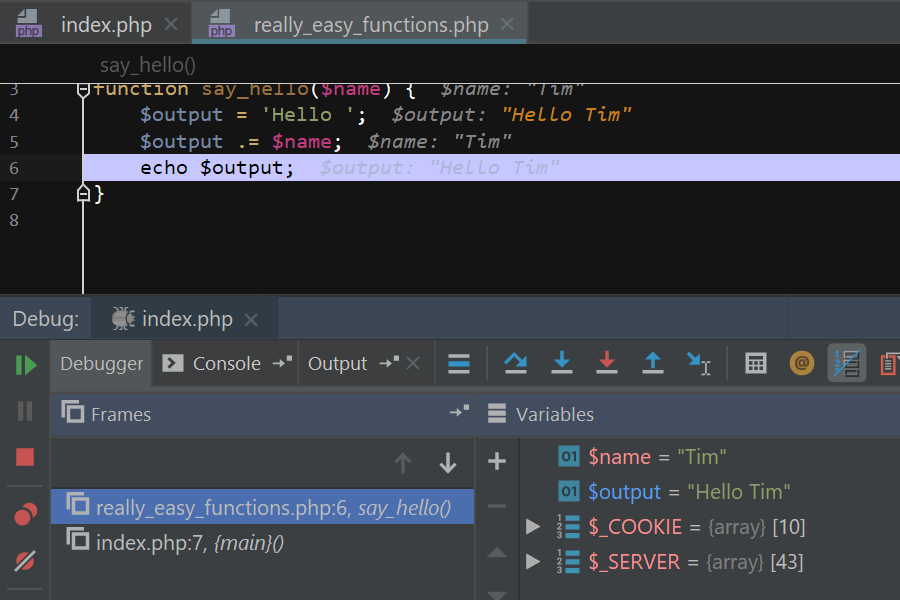
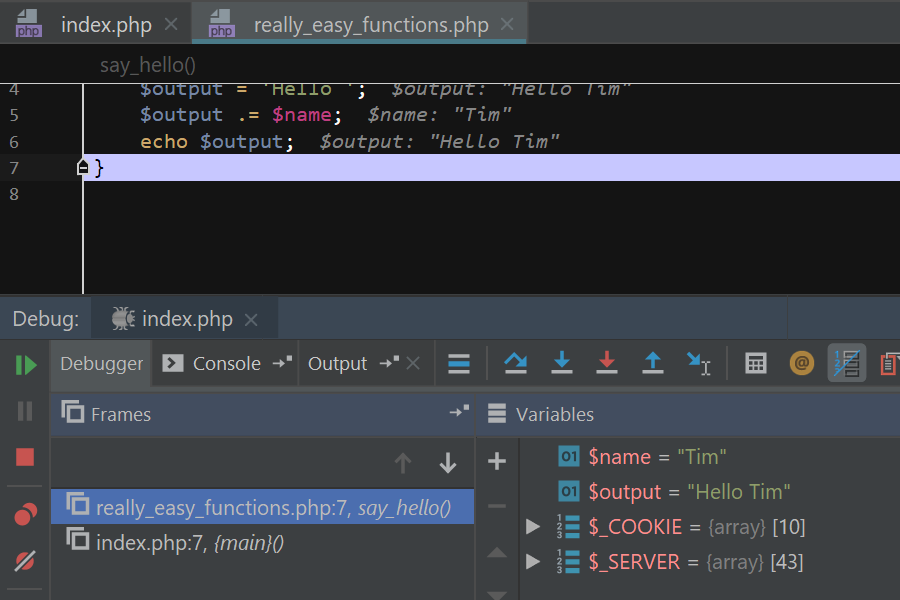
Demo
Then reload the page...
Step Back
lets you
code that you previously
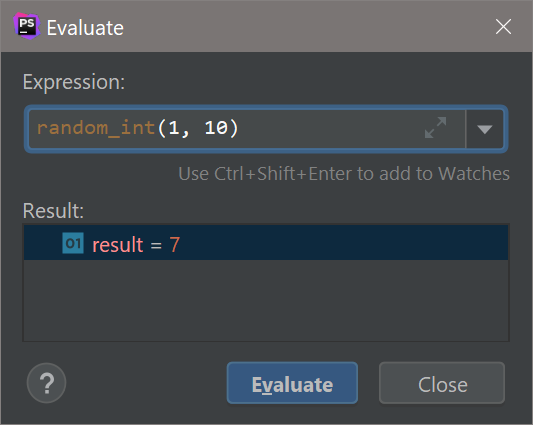
Expression Evaluator
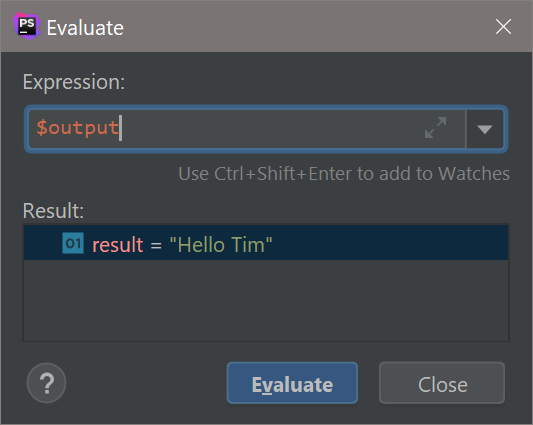
Expression Evaluator
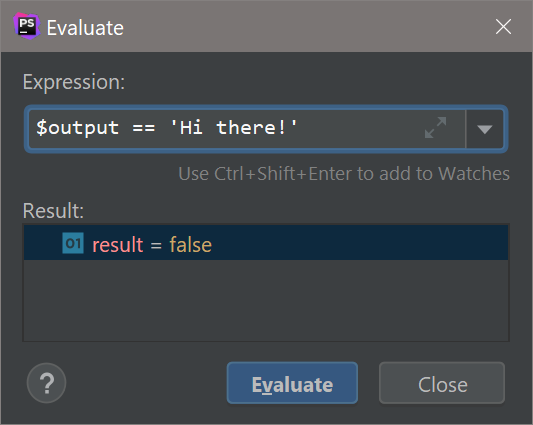
Expression Evaluator
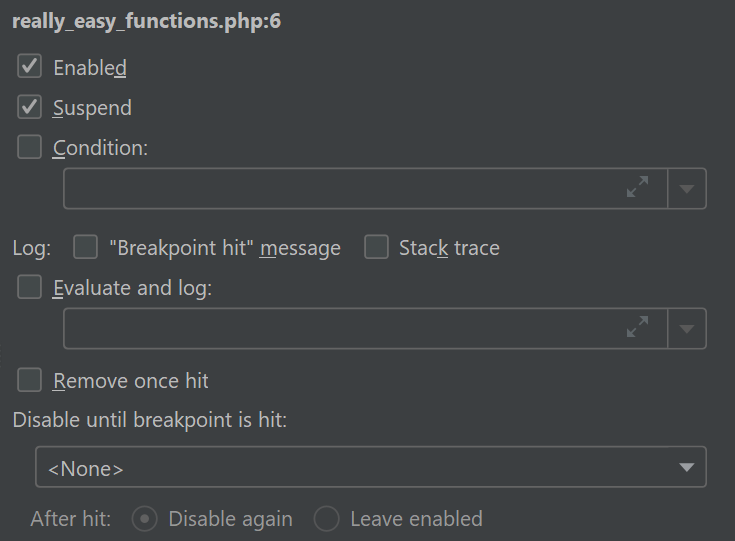
Conditional Breakpoints

Even More...
Wait, it's still not working!

Turn on profiler
xdebug.profiler_enable=1
xdebug.profiler_output_dir=C:\xampp\htdocs\

#XDEBUG_PROFILE GET or POST value
xdebug.profiler_enable_trigger=1
Then restart the webserver
Then reload the page...
Open the cachegrind.out.###### file

Execution Statistics

Call Tree

Questions
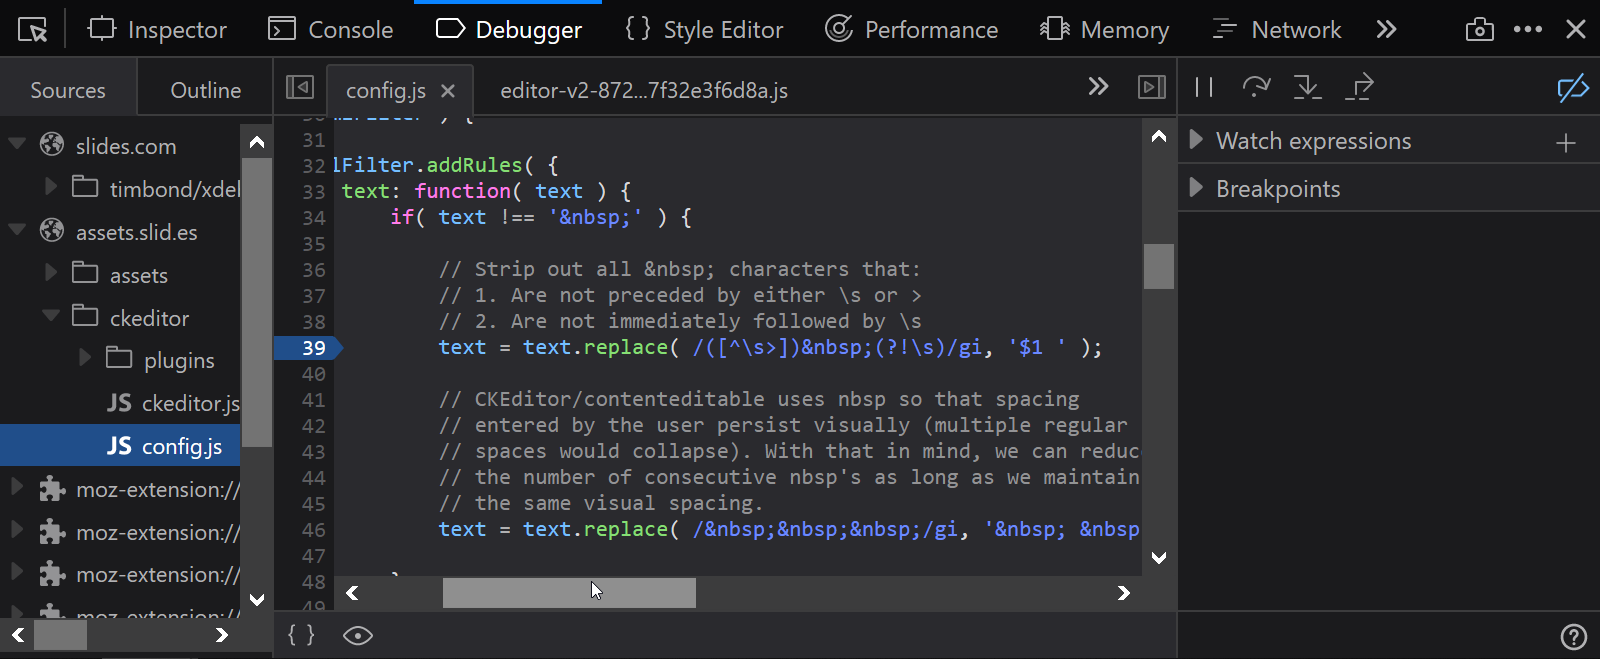
Bonus tip: Works for JavaScript too!
Bonus Tip: Xdebug with Docker on Mac
docker0 interface is actually on a VM
sudo ifconfig lo0 alias 10.254.254.254 255.255.255.0For a permanent solution:
So instead, alias the loopback adapter and send traffic there:
...this has to be run on reboots
Xdebug will forever change the way you debug your PHP code (Cascadia PHP)
By Tim Bond
Xdebug will forever change the way you debug your PHP code (Cascadia PHP)
Cascadia PHP Conference - September 21, 2019


