Genome Wide Coverage of Signal
Bioinformatics Core Team
Overview
- What is coverage in this context
- Why and how to make use of coverage
- Some standard tools and approaches
Coverage
- Not average read depth across genome!
- Signal at positions of genome
- Signal graph
- Simple way to describe your data in genomic context.
What does it look like
- wig or bedgraph for human readable.
- bigWig for computer readable.
- bigWig has internal index
- Remember BAM has separate bai files.
- So random access can be achieved at speed.
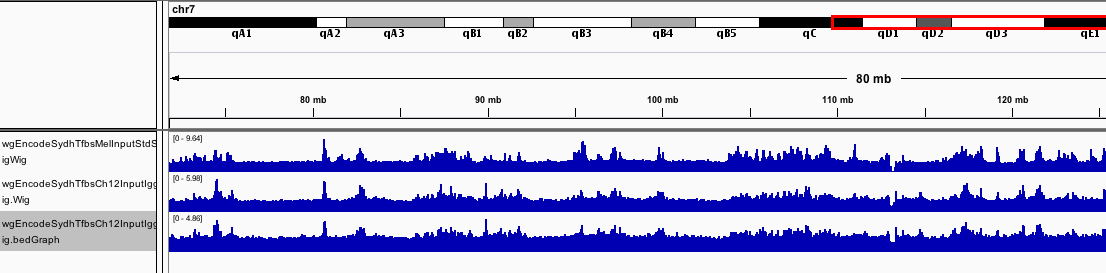
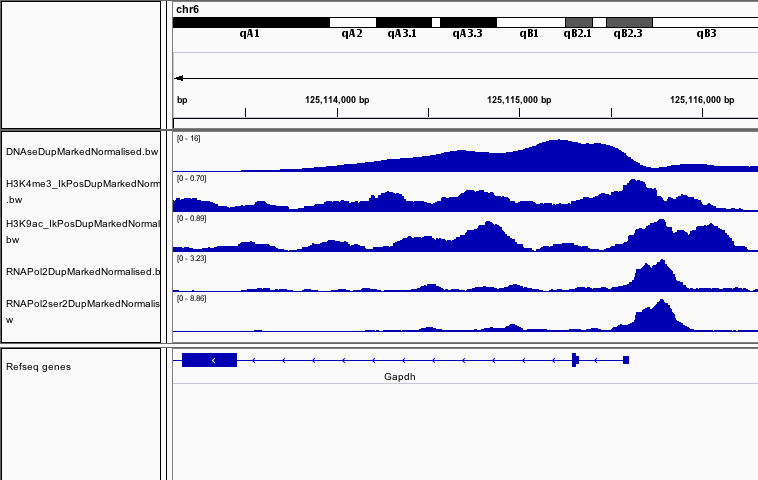
What does it look like
- In a browser wig/bedGraph/bigWig all look the same
- Resolution may vary.
Eyeballing your data
- Identify your areas of known peaks
- Look for areas of consistent bias between input and samples.
- Blacklisting targets.
- Sono-seq effect
Genomic information as signal graphs
- Often helpful to encode other information as bigWigs.
- Phastcons - Conservation across bases.
- GC content in sliding windows.
- Motif occurrence with score.
What can coverage be used for
- Lost information on strand.
- So not most peak callers
- Can identify summits of signal in binding events.
- Can be used to rapidly summarise score over regions.
- How conserved is my region on average?
- Mean motif score across a region of interest?
- Compute genome wide similarity between signals.
Shape or distribution of signal across features
- In marks like ER binding we expect punctate binding for ER signal.
- For co-factors we may see binding surrounding ER peak.
- Many histone and Polymerase 2 varieties show differering signal around regions.
Combining marks to infer state.
Changes in signal shapes may reflect classes of transcriptional states.
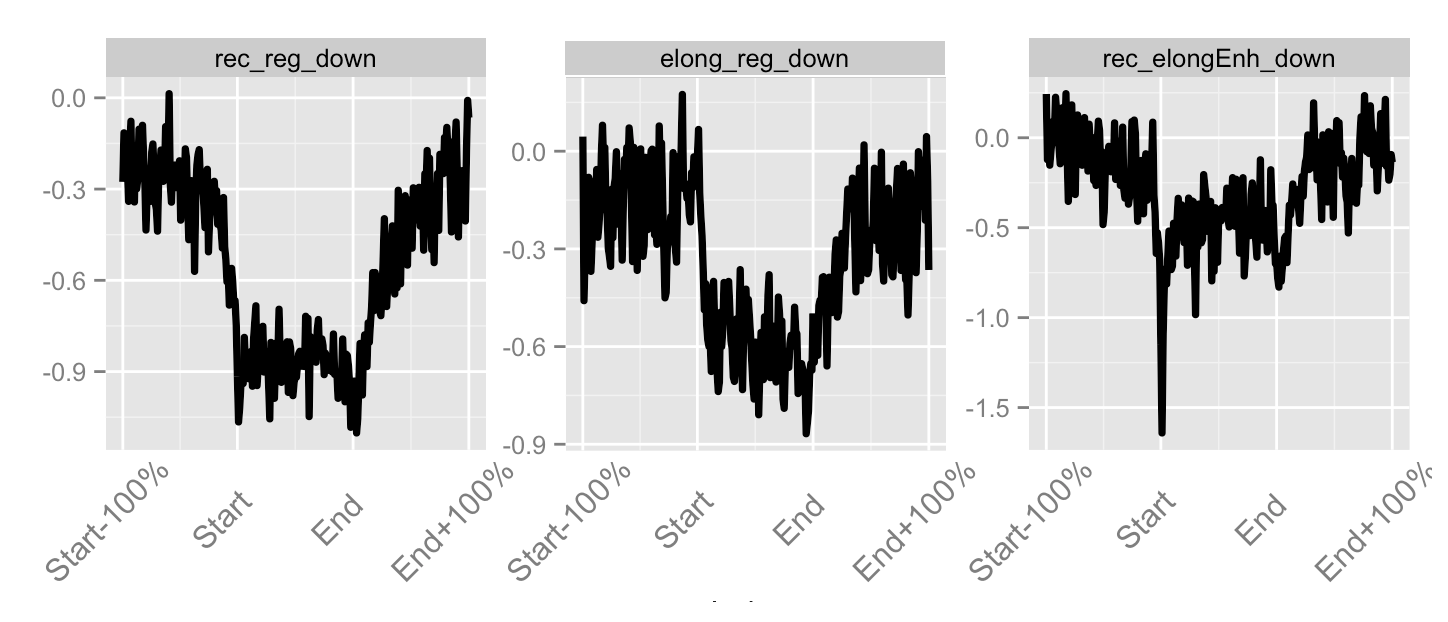
Loss over whole gene
Loss over gene body
Loss at promoter
Standard tools (outside R)
- bedtools
- genomeCoverage function.
- Creates wigs or bedGraphs from Bam files
- UCSC tools
- wigToBigwig
- bedgraphToBigwig
- Both tools convert wig/bedGraph to bigWig respectively.
- R has many tools to create internal and external representations of signal graphs.
Summary
- Coverage provides a simple view of signal across genome.
- Acts as first pass review of your ChIP-data and Input.
- May hold any genomic information in bigWig format.
- Distribution of signal provide inference on states of genomic features.
Time for another practical code!
Coverage of Signal
By tom carroll