Visualising genomics Data using tracktables
Overview
- Requirements for high-throughput visualisation.
- Integration with IGV.
- Tracktables toolset and examples.
More Sample - More time
- Most analysis contains some visualisation of data in a browser.
- Multiplexed samples
- More Groups, More Samples
- rtracklayer and sraDB provide some excellent functionality.
...but
- Want to combine sample metadata and have tight control of how data is displayed.
- Integration into a report.
Requirements
Pipeline Related
- Automated presentation of data.
- Data annotated and with metadata.
- Portable.
- Easy integration with other efforts in reproducible research.
- Flexible to where data is maintained.
Interactive Use.
- Ease in casting Bioconductor objects into use in IGV.
- Speed up iterations in reviewing results.
Integrated Genome Viewer
- Accepts some commands via ports.
- New, echo, load file , goto location
- Complex customisation requires XML.
- Sample metadata requires separate formatted text file.
- For large number of samples these requirements can be very time consuming to arrange manually.

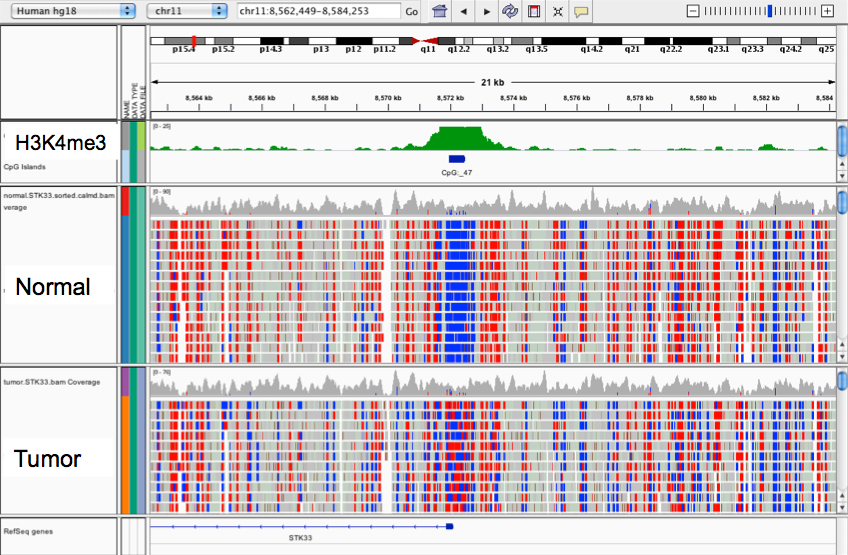
- Portable
- Local as opposed to server
- Highly customisable.
- Handles many data types.
Building an IGV XML
fileSheet

    SampleName bigwig                              interval                       bam
[1,] "EBF"      "/PATH_TO_FILE//EBF_Example.bw"     "/PATH_TO_FILE//EBF_Peaks.bed" NA
[2,] "H3K4me3"  "/PATH_TO_FILE//H3K4me3_Example.bw" NA                             NA
[3,] "H3K9ac"   "/PATH_TO_FILE//H3K9ac_Example.bw"  NA                             NA
[4,] "RNAPol2"  "/PATH_TO_FILE//RNAPol2_Example.bw" NA                             NA

 MakeIGVSessionXML(fileSheet,igvdirectory=getwd(),"Example","mm9")
[1] "/Users/Ziwei/why/Example.xml"
<Global genome.value="mm9" groupTracksBy="Linking_id" locus="All" version="3">
  <Resources>
    <Resource name="SampleMetadata" path="SampleMetadata.txt" relativePath="TRUE"/>
    <Resource label="EBF_Interval" name="EBF_Interval" path="../../../Library/Frameworks/R.framework/Versions/3.2/Resources/library/tracktables/extdata/EBF_Peaks.bed" relativePath="TRUE"/>
    <Resource label="EBF_Bigwig" name="EBF_Bigwig" path="../../../Library/Frameworks/R.framework/Versions/3.2/Resources/library/tracktables/extdata/EBF_Example.bw" relativePath="TRUE"/>
    <Resource label="H3K4me3_Bigwig" name="H3K4me3_Bigwig" path="../../../Library/Frameworks/R.framework/Versions/3.2/Resources/library/tracktables/extdata/H3K4me3_Example.bw" relativePath="TRUE"/>
    <Resource label="H3K9ac_Bigwig" name="H3K9ac_Bigwig" path="../../../Library/Frameworks/R.framework/Versions/3.2/Resources/library/tracktables/extdata/H3K9ac_Example.bw" relativePath="TRUE"/>
    <Resource label="RNAPol2_Bigwig" name="RNAPol2_Bigwig" path="../../../Library/Frameworks/R.framework/Versions/3.2/Resources/library/tracktables/extdata/RNAPol2_Example.bw" relativePath="TRUE"/>
  </Resources>
  <Panel height="350" name="DataPanel" width="1115">
    <Track id="../../../Library/Frameworks/R.framework/Versions/3.2/Resources/library/tracktables/extdata/EBF_Peaks.bed" name="EBF_Interval" altColor="169,169,169" color="169,169,169" displayMode="character" featureVisibilityWindow="-1" fontSize="10" height="40" renderer="BASIC_FEATURE" showDataRange="true" sortable="true" visible="true" windowFunction="count" autoScale="true" normalize="false"/>
    <Track id="../../../Library/Frameworks/R.framework/Versions/3.2/Resources/library/tracktables/extdata/EBF_Example.bw" name="EBF_Bigwig" autoScale="true" altColor="169,169,169" color="169,169,169" displayMode="COLLAPSED" featureVisibilityWindow="-1" fontSize="10" renderer="BAR_CHART" showDataRange="true" visible="true" sortable="true" normalize="false" windowFunction="mean">
      <DataRange baseline="0" drawBaseline="true" flipAxis="false" maximum="50" minimum="0" type="LINEAR"/>
    </Track>
    <Track id="../../../Library/Frameworks/R.framework/Versions/3.2/Resources/library/tracktables/extdata/H3K4me3_Example.bw" name="H3K4me3_Bigwig" autoScale="true" altColor="169,169,169" color="169,169,169" displayMode="COLLAPSED" featureVisibilityWindow="-1" fontSize="10" renderer="BAR_CHART" showDataRange="true" visible="true" sortable="true" normalize="false" windowFunction="mean">
      <DataRange baseline="0" drawBaseline="true" flipAxis="false" maximum="50" minimum="0" type="LINEAR"/>
    </Track>
    <Track id="../../../Library/Frameworks/R.framework/Versions/3.2/Resources/library/tracktables/extdata/H3K9ac_Example.bw" name="H3K9ac_Bigwig" autoScale="true" altColor="169,169,169" color="169,169,169" displayMode="COLLAPSED" featureVisibilityWindow="-1" fontSize="10" renderer="BAR_CHART" showDataRange="true" visible="true" sortable="true" normalize="false" windowFunction="mean">
      <DataRange baseline="0" drawBaseline="true" flipAxis="false" maximum="50" minimum="0" type="LINEAR"/>
    </Track>
    <Track id="../../../Library/Frameworks/R.framework/Versions/3.2/Resources/library/tracktables/extdata/RNAPol2_Example.bw" name="RNAPol2_Bigwig" autoScale="true" altColor="169,169,169" color="169,169,169" displayMode="COLLAPSED" featureVisibilityWindow="-1" fontSize="10" renderer="BAR_CHART" showDataRange="true" visible="true" sortable="true" normalize="false" windowFunction="mean">
      <DataRange baseline="0" drawBaseline="true" flipAxis="false" maximum="50" minimum="0" type="LINEAR"/>
    </Track>
  </Panel>
</Global>
Example IGV XML
Building the HTML table
> SampleSheet
     SampleName Antibody  Species
[1,] "EBF"      "EBF"     "ProB"
[2,] "H3K4me3"  "H3K4me3" "ProB"
[3,] "H3K9ac"   "H3K9ac"  "ProB"
[4,] "RNAPol2"  "RNAPol2" "ProB"
HTMLreport <- maketracktable(fileSheet=FileSheet,SampleSheet=SampleSheet,
filename="IGVExample.html",basedirectory=getwd(),genome="mm9")
#sampleTable
Linking_id Antibody Species
EBF EBF ProB
H3K4me3 H3K4me3 ProB
H3K9ac H3K9ac ProB
RNAPol2 RNAPol2 ProB
#sampleMapping
#Bams
_Bam
#BigWigs
EBF_Bigwig EBF
H3K4me3_Bigwig H3K4me3
H3K9ac_Bigwig H3K9ac
RNAPol2_Bigwig RNAPol2
#Intervals
EBF_Interval EBF
Simple Example
Simple Example
Integration with Rmarkdown HTML
FTP, local or Mixed modes
Local
XML
SampleSheet
Genomic Files
- All required files stored locally in default structure.
FTP, local or Mixed modes
FTP
XML
Sample Information
Genomic Files
- All file uploaded to ftp under user control.
FTP
Genomic Files
Local
XML
SampleSheet
More Genomic Files
- All files created by tracktables are local but genomic files on an FTP
- Mixed set-ups allow for user to combine local and FTP help data
Code to set up of different types
urlForFiles <- "https://github.com/ThomasCarroll/tracktables-Data/raw/master/"
# This will link to data and XMLs placed in github earlier.
# In practice a dedicated FTP would be required for larger files.
HTMLreport <- maketracktable(fileSheet=FileSheet,SampleSheet=SampleSheet,
filename="IGVEx4.html",genome="mm9",
basedirectory=urlForFiles,
full.xml.paths=T,
full.file.paths=T,
writedirectory=file.path(getwd(),"IGVDirectory")
)
HTMLreport <- maketracktable(fileSheet=FileSheet,
SampleSheet=SampleSheet,
filename="IGVEx3.html",
basedirectory=file.path(getwd(),"IGVDirectory"),
genome="mm9")From FTP
From RelativePaths
igvDisplayParams <- igvParam(bigwig.autoScale = "false",
bigwig.minimum = 1,
bigwig.maximum = 5)

HTMLreport <- maketracktable(FileSheet,SampleSheet,"IGVex2.html",getwd(),"mm9",
colourBy="Antibody",
igvParam=igvDisplayParams)
Customisation
Casting Bioconductor objects into tracktables
- Rapidly evaluate results in browser
- Supports GenomicRanges so far
- row Metadata carried into table.
- Standalone or integrated into report.
htmlpage <- makebedtable(Intervals,"EBF_PeaksTable.html",getwd())Casting Bioconductor objects into tracktables
- Want to create HTML reports from other objects.
- Diffbind
- DEseq2
- EdgeR
- any suggestions
Acknowledgements
- Rory Stark (CRUK)
- Sanjay Khadayate (MRC)
- Whole MRC CSC team
Visualing
By tom carroll