Integrative Genomics Viewer
The Rockefeller University
Bioinformatics Resource Centre
Overview
- Introduction to IGV.
- What is IGV.
- How to run IGV.
- Navigating IGV.
- The IGV user interface.
- Moving around genomes.
- Loading and visualising data.
- Genome information and annotation.
- User supplied data.
- Sample information.
- External data.
- Displaying genomics data
- Basic visualisation.
- Data dependent visualisation.
What is IGV?
- Created by the Broad institute.
- Genome browser.
- Visualises genomic data (expression, ChIP, resequencing, multiple alignment, shRNA)
- Handles most common genomic data types.
- Java Desktop application
- No dependence on server
- Loads data locally or from URL, consumes memory and CPU.
How to run IGV?
- Requires Java
- IGV available from Broad
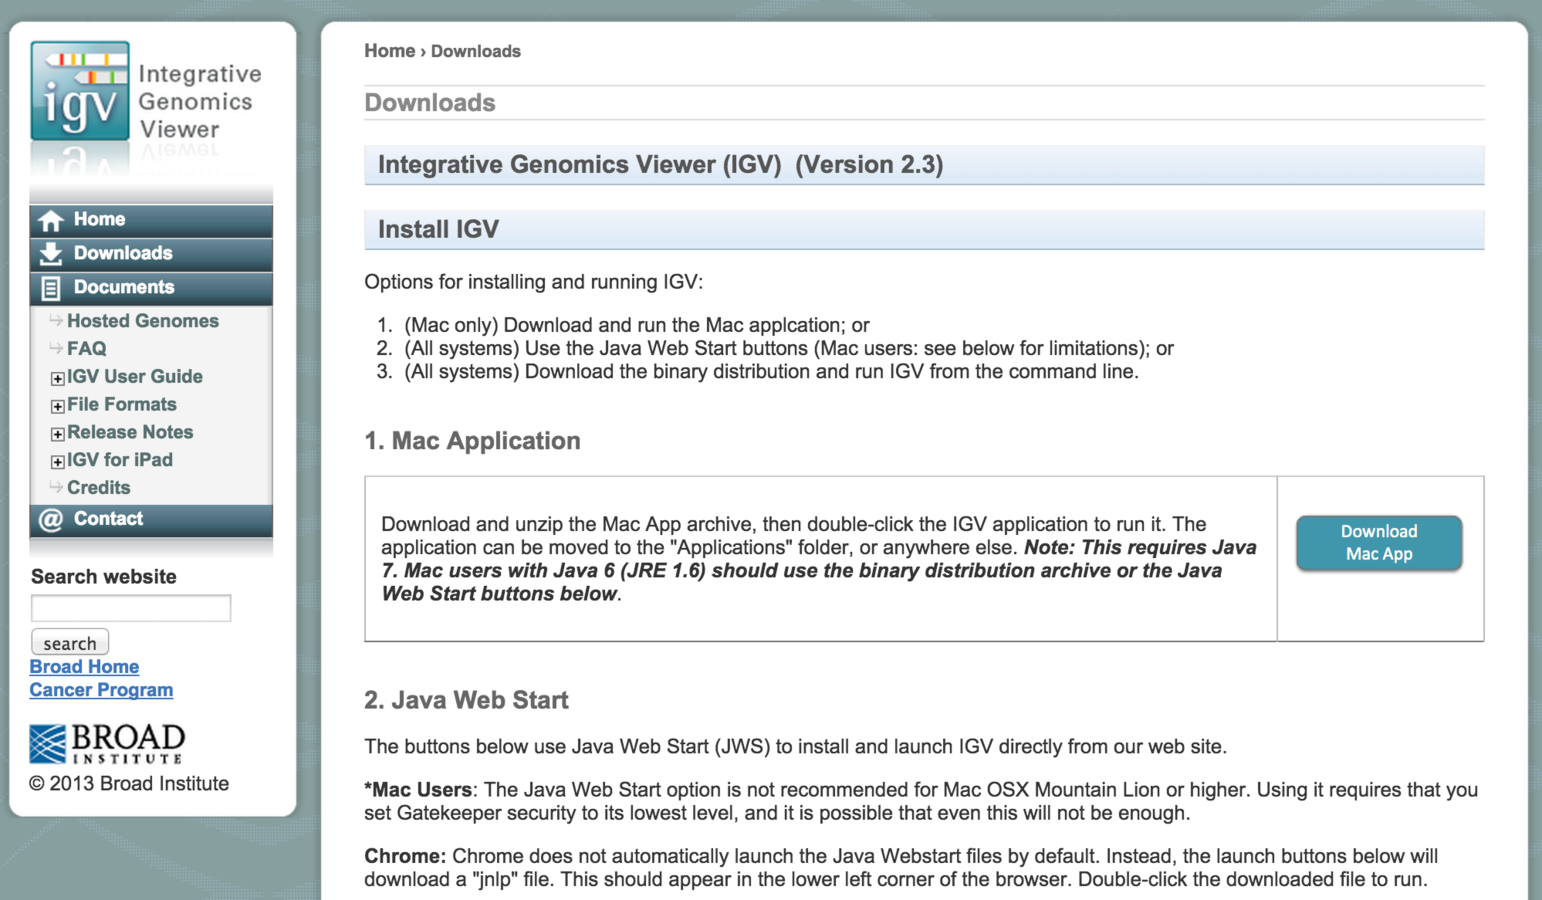
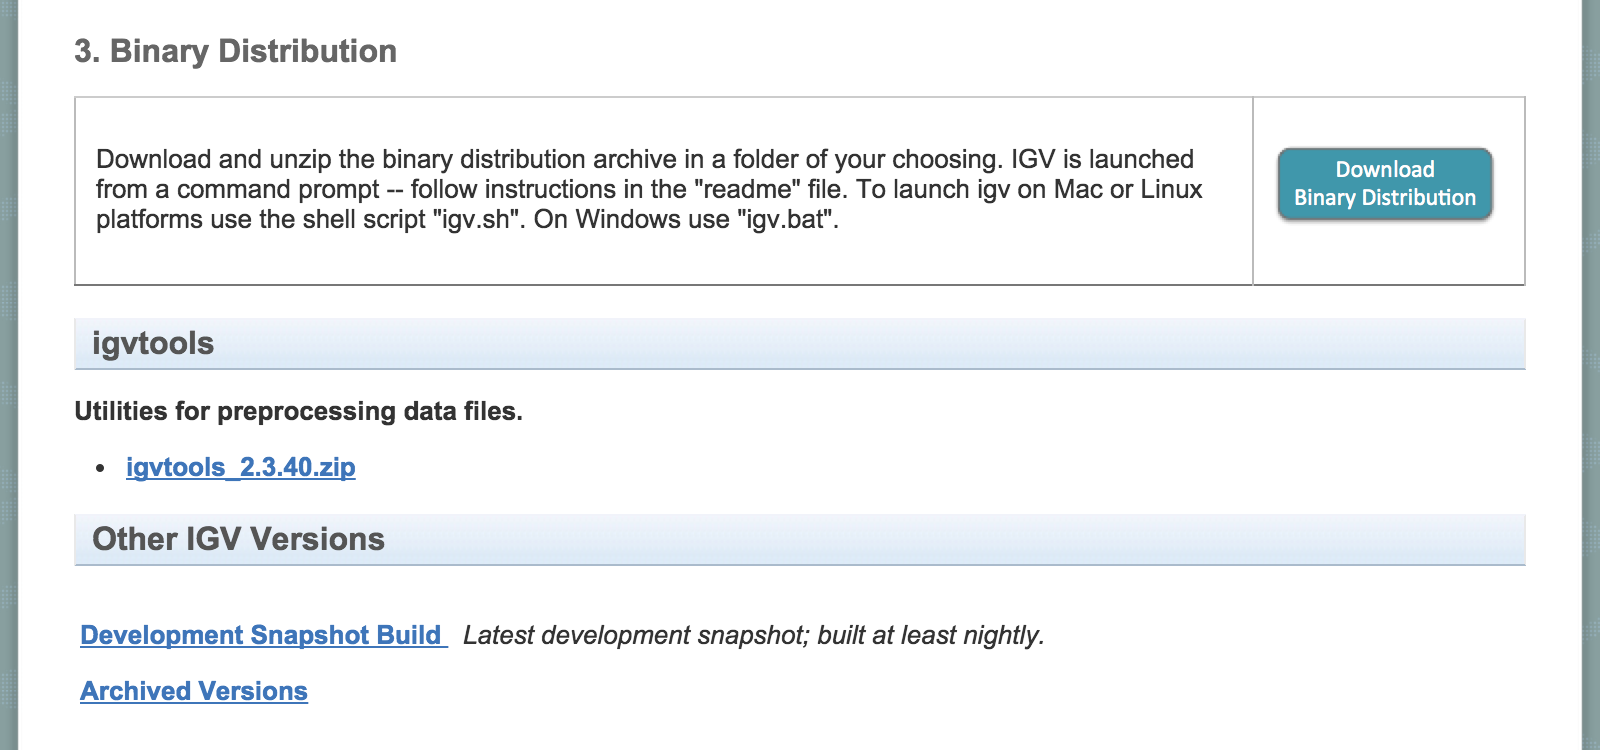
How to run IGV? (Binary version)
- Download to computer.
- Runs locally.
- Archived versions available
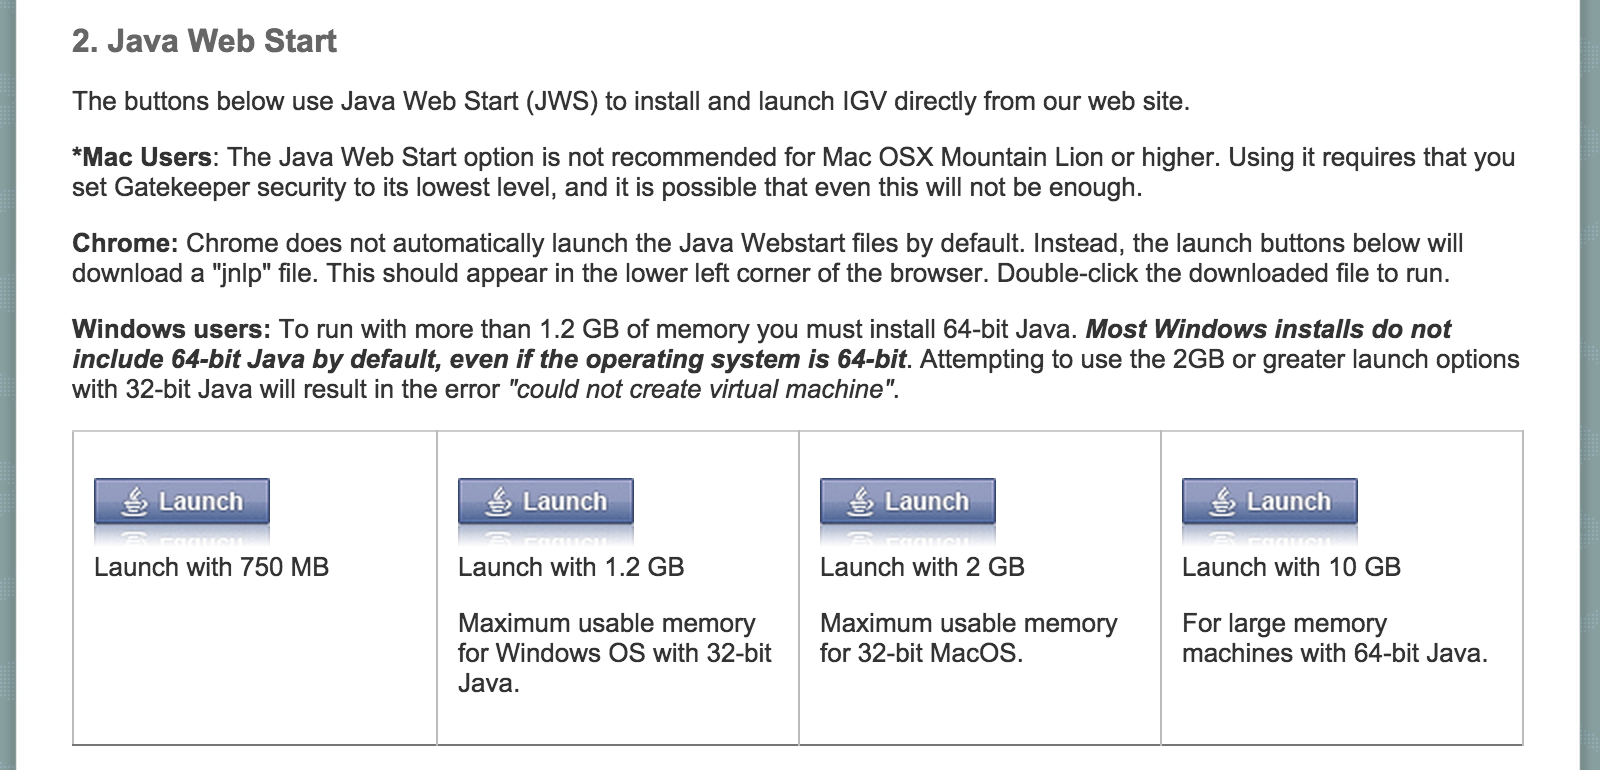
How to run IGV? (Webstart)
- Runs from webstart.
- Always runs latest version of IGV.
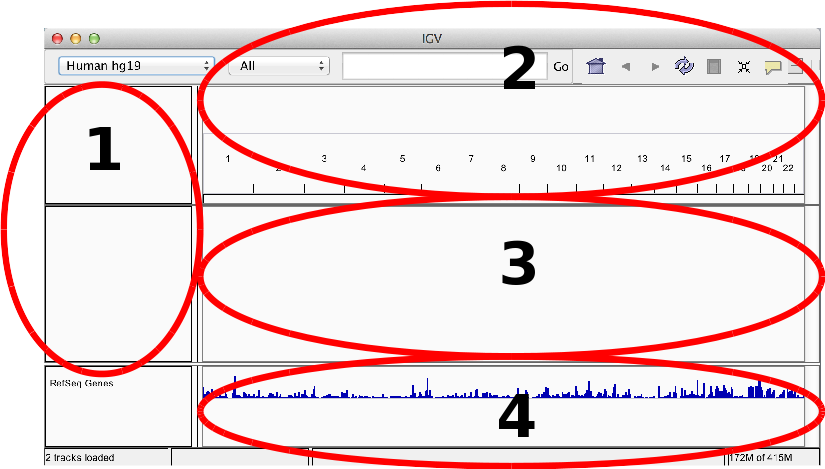
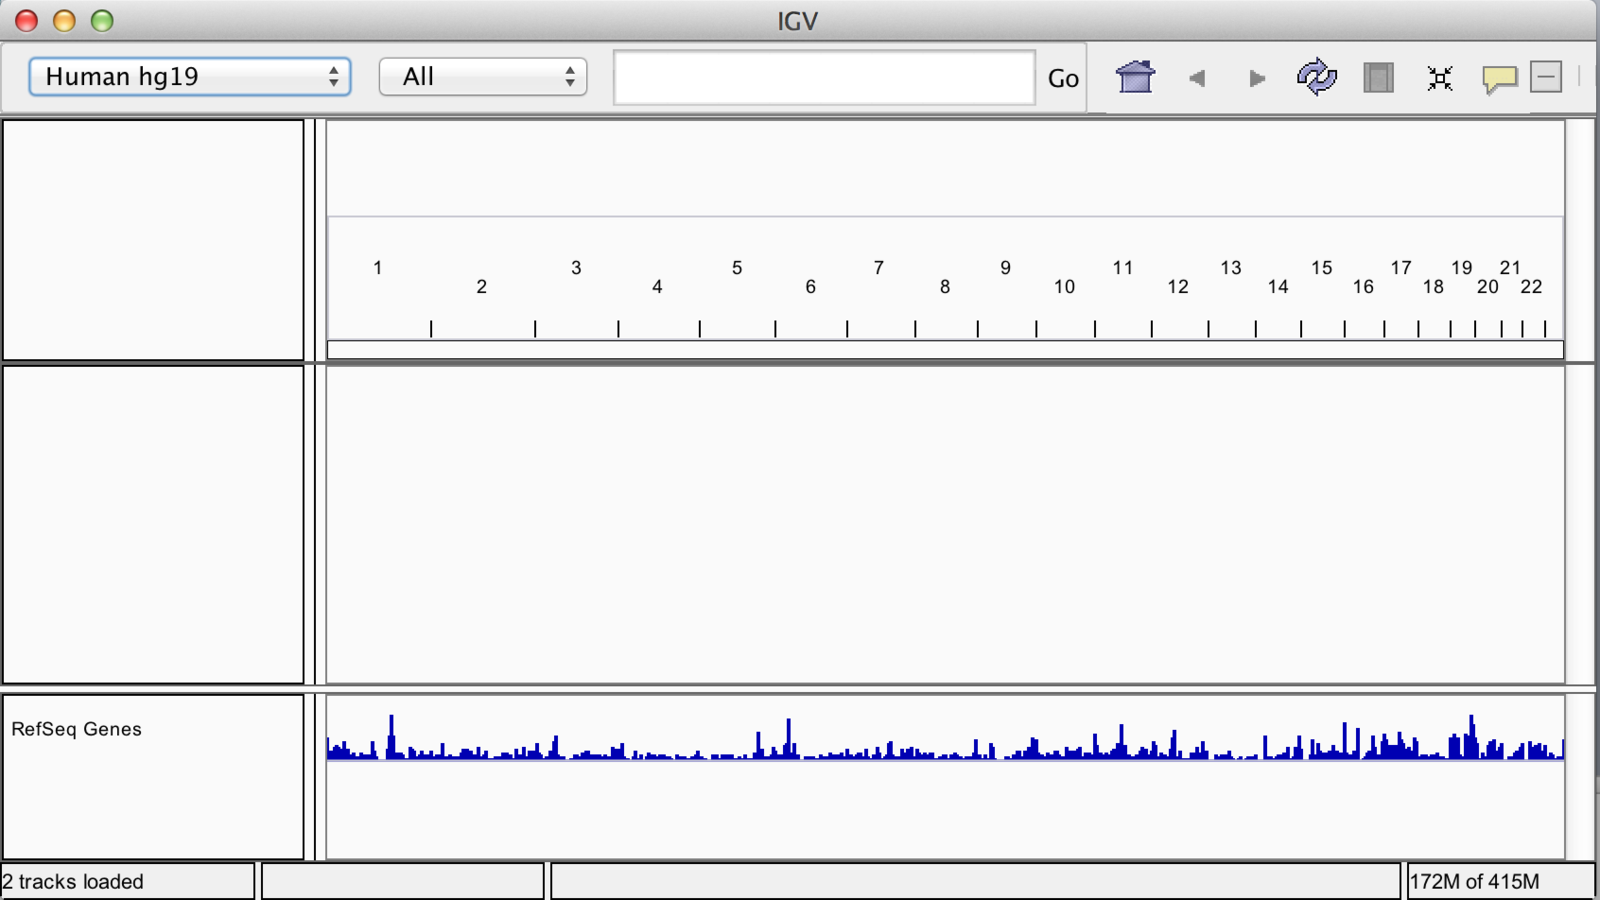
IGV GUI
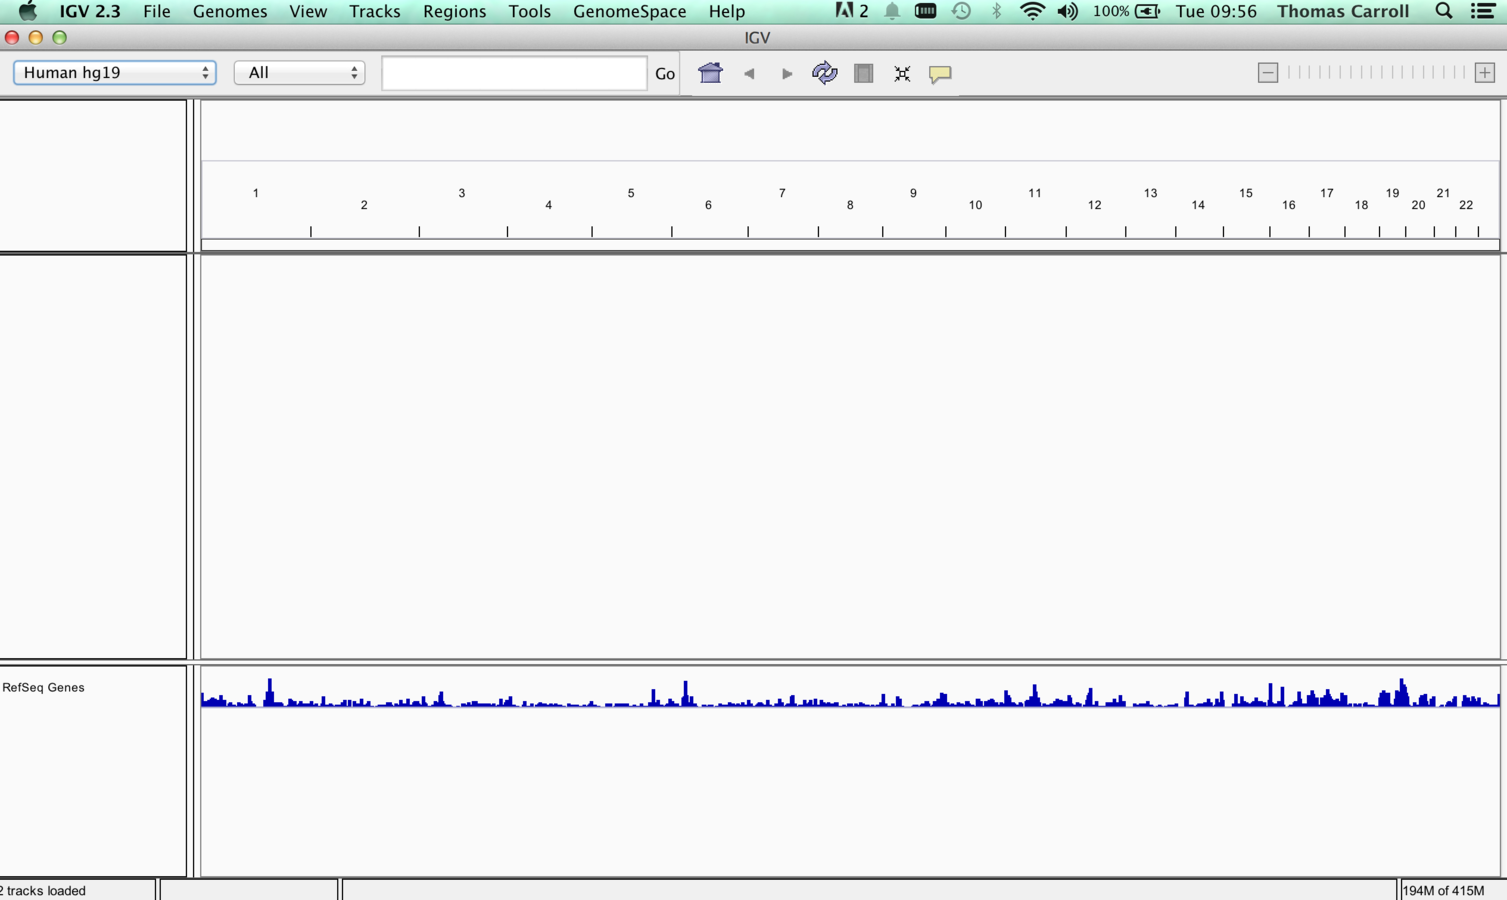
IGV GUI
- Sample information panel <1>
- Genome Navigation panel <2>
- Data panel <3>
- Attribute panel <4>
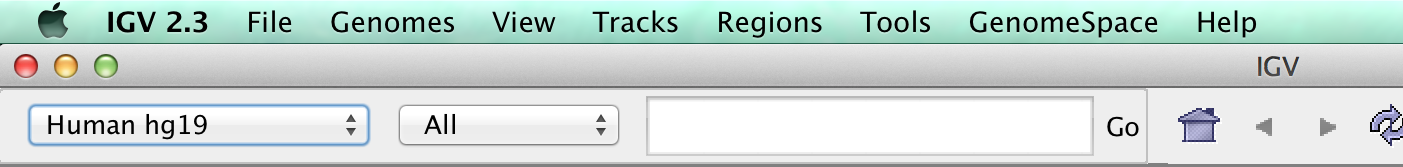
Menu Bar
- File - Load data/sample information.
- Genome - Load and manage genomes.
- View - Display preferences.
- Tracks - Group/sort/filter data tracks.
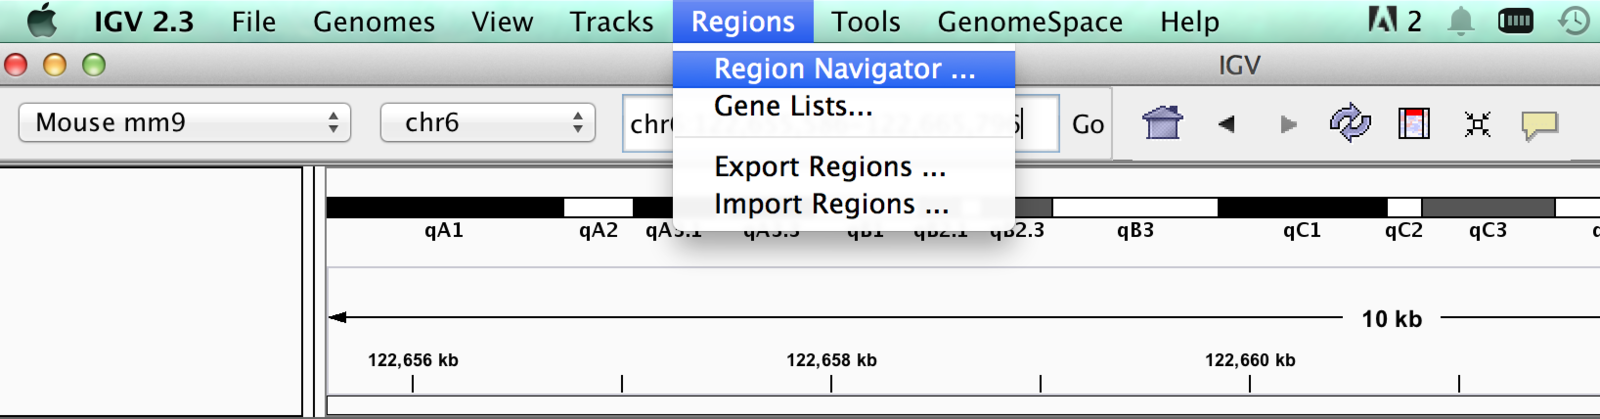
- Regions - Create region/gene lists.
- Tools - Access to Integrated tools (IGVtools/Bedtools).
- GenomeSpace - Export/import from Genomespace
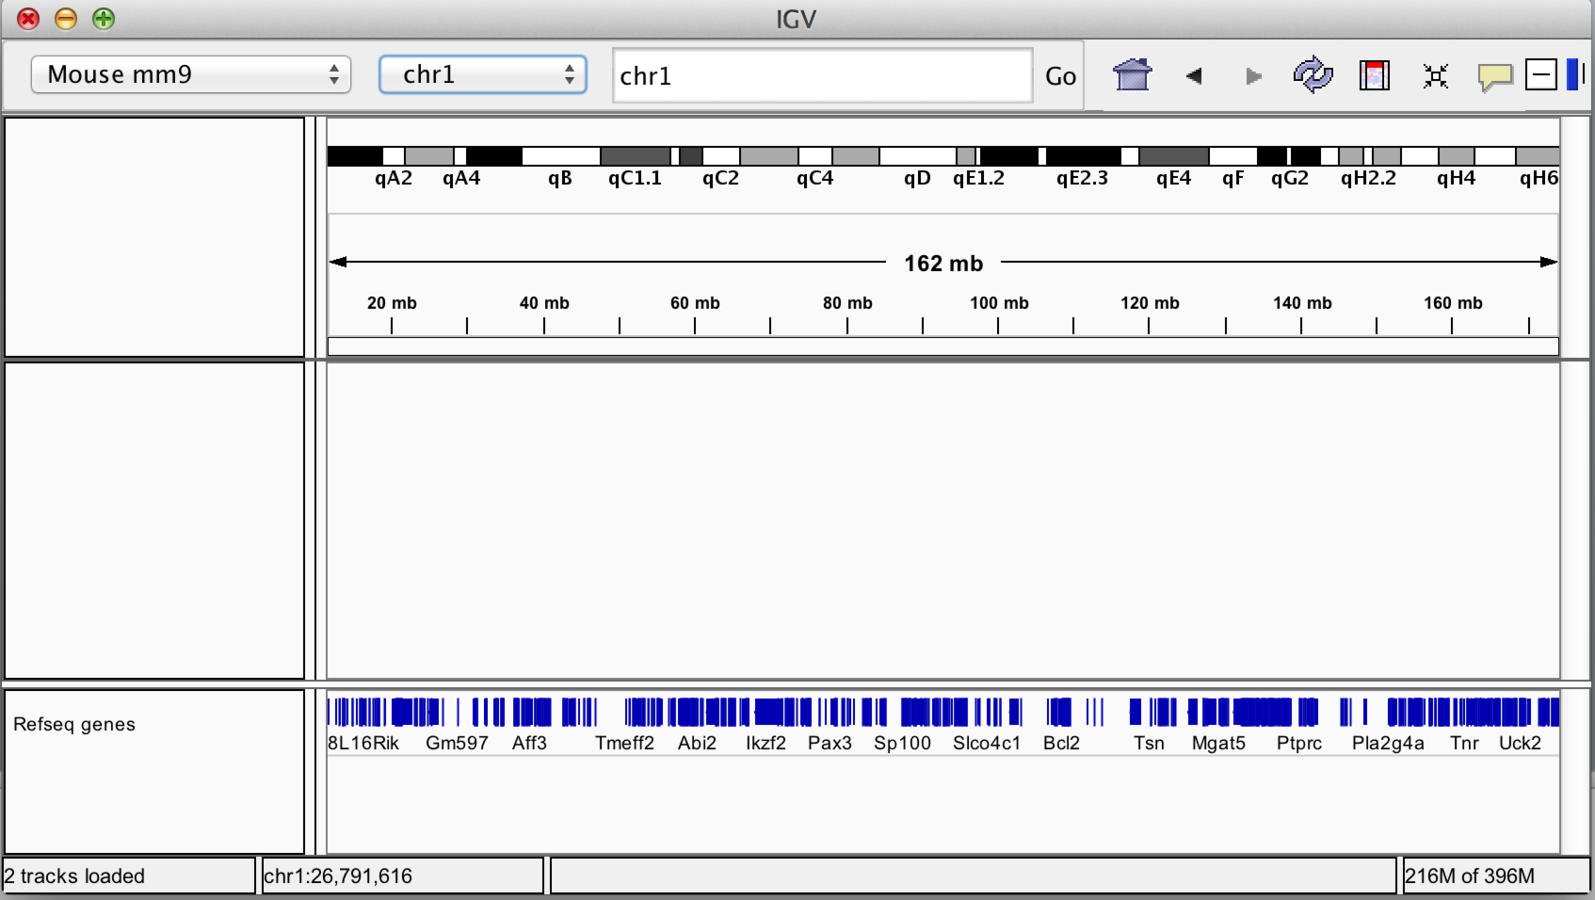
Moving around genomes
- Cytoband selection and zooming
- Scrolling
- Selection of region of interest
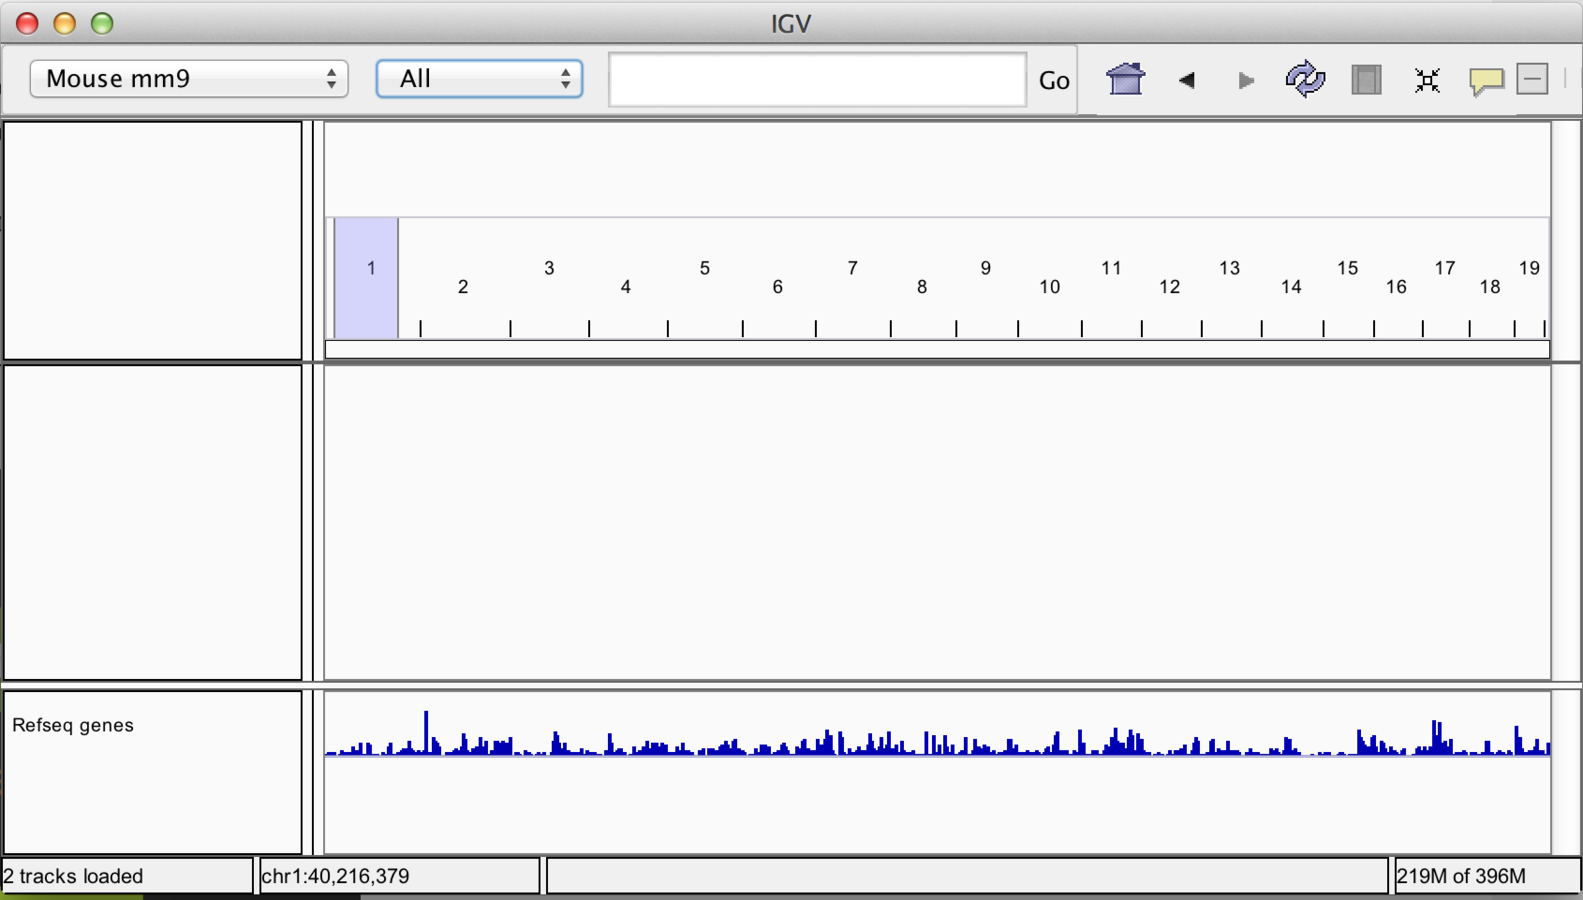
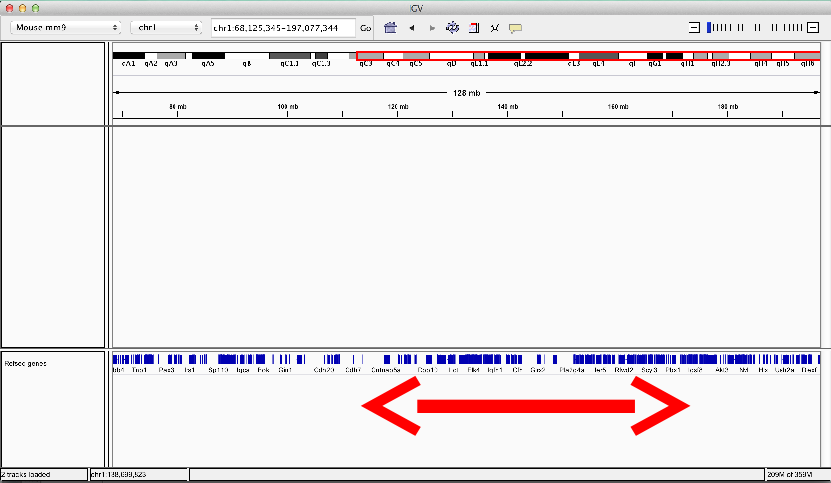
Whole genome view

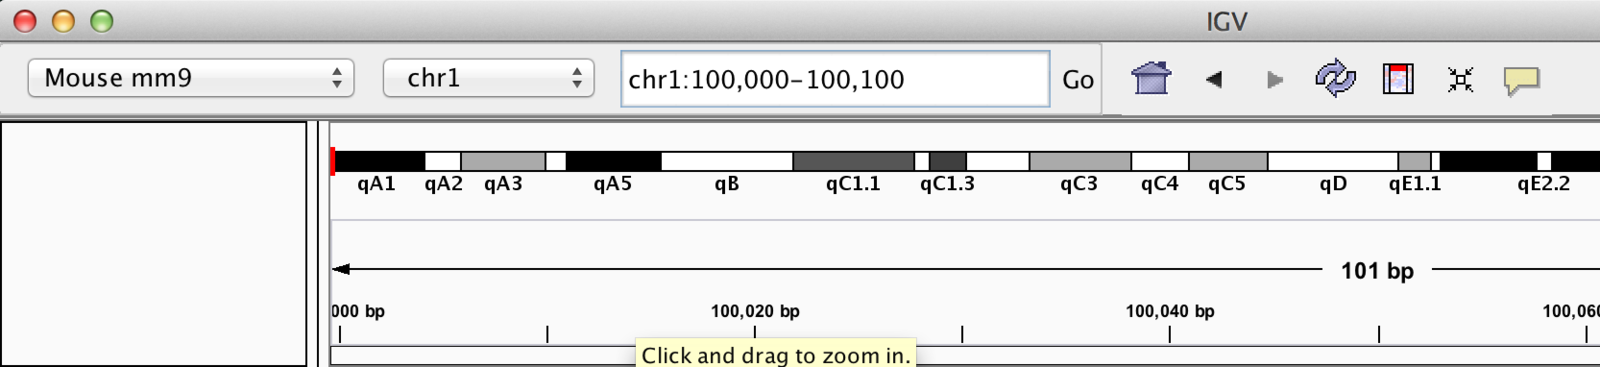
Zooming
Scrolling
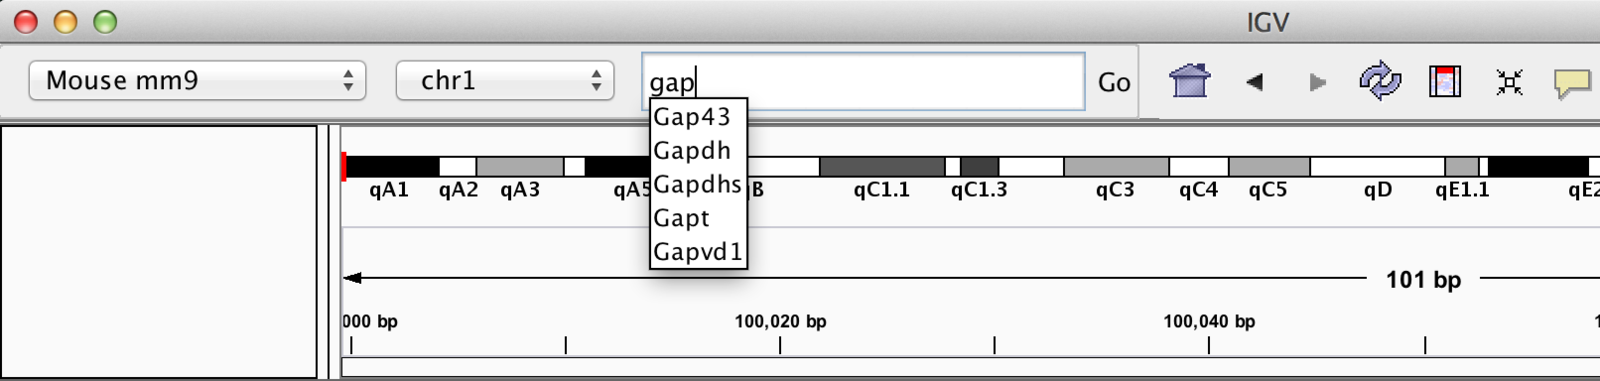
Jump to Region
“Bookmarking” regions of interest
- Regions may be added to “Regions of interest”
- These act as bookmarks for areas of particular interest
- Bookmarks can be added by -
- Bookmarking visible window
- Selecting region within window
Bookmarking - Visible window
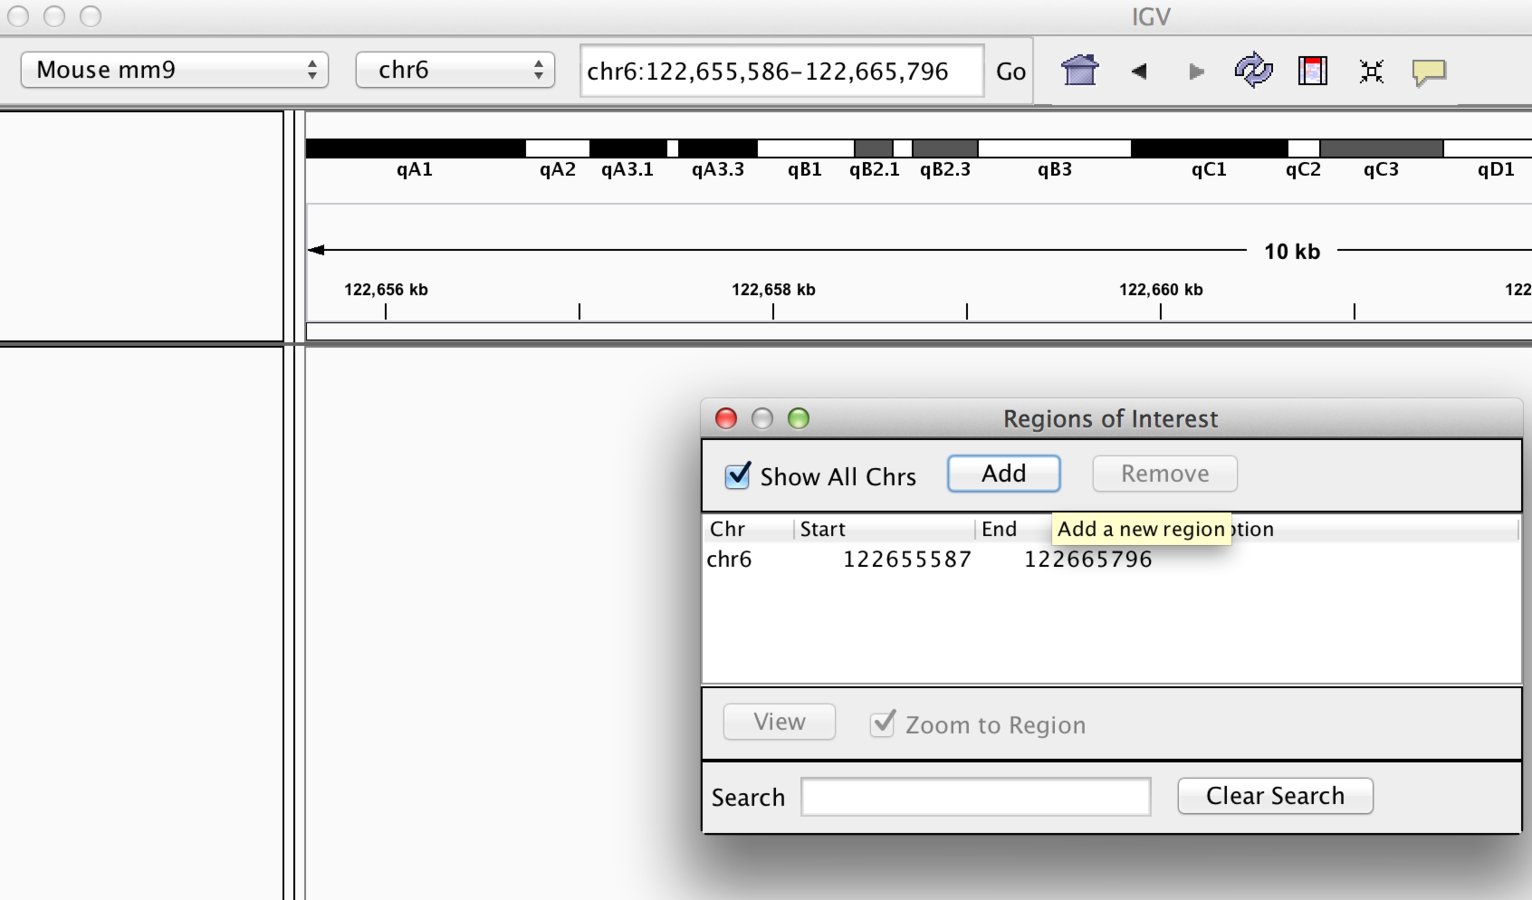
“Bookmarked” Region Of Interest
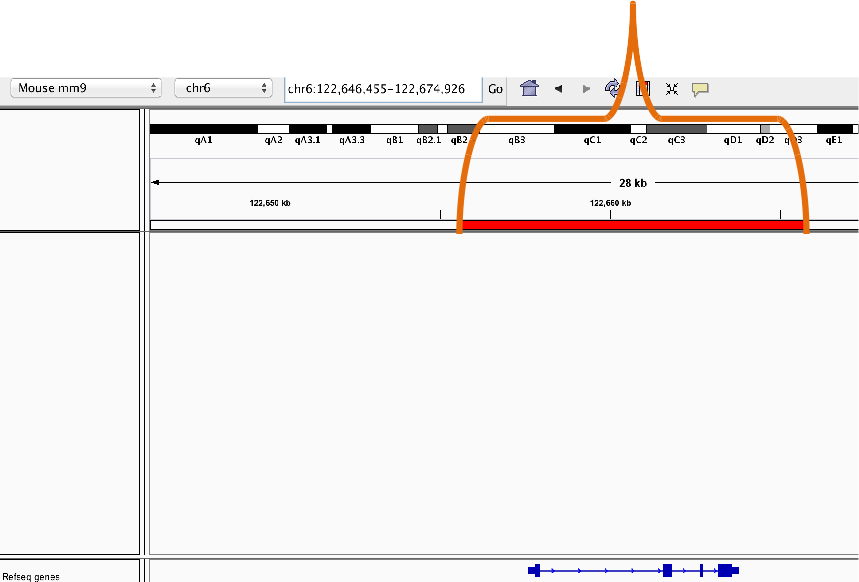
Bookmarking
- Bookmarks may be created from selecting "region of interest" button and edge of region
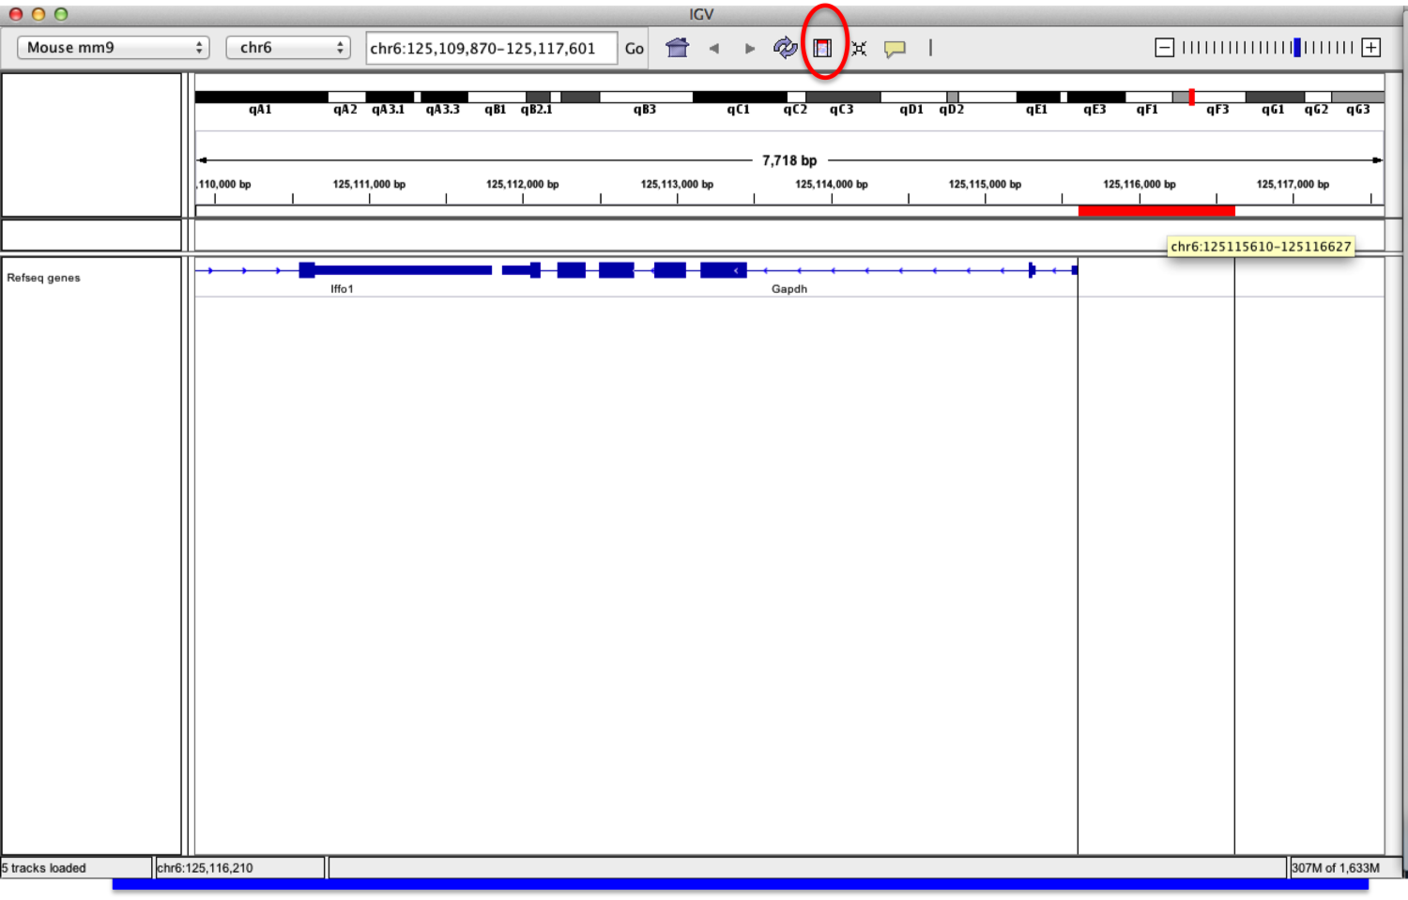
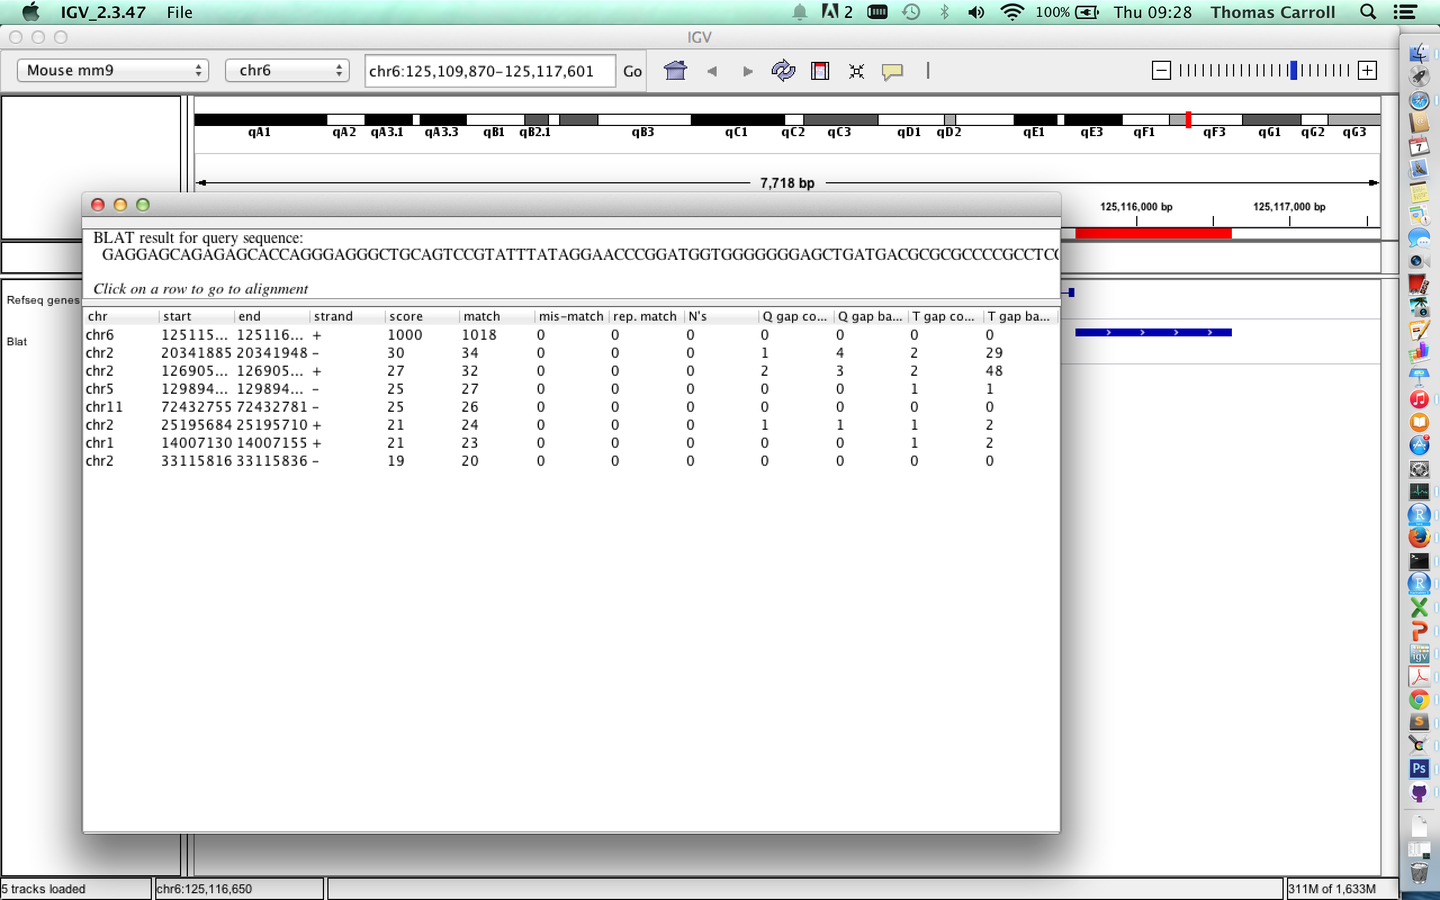
Sequences from regions of interest
- A useful feature of "regions of interest" is to retrieve of BLAT sequences.
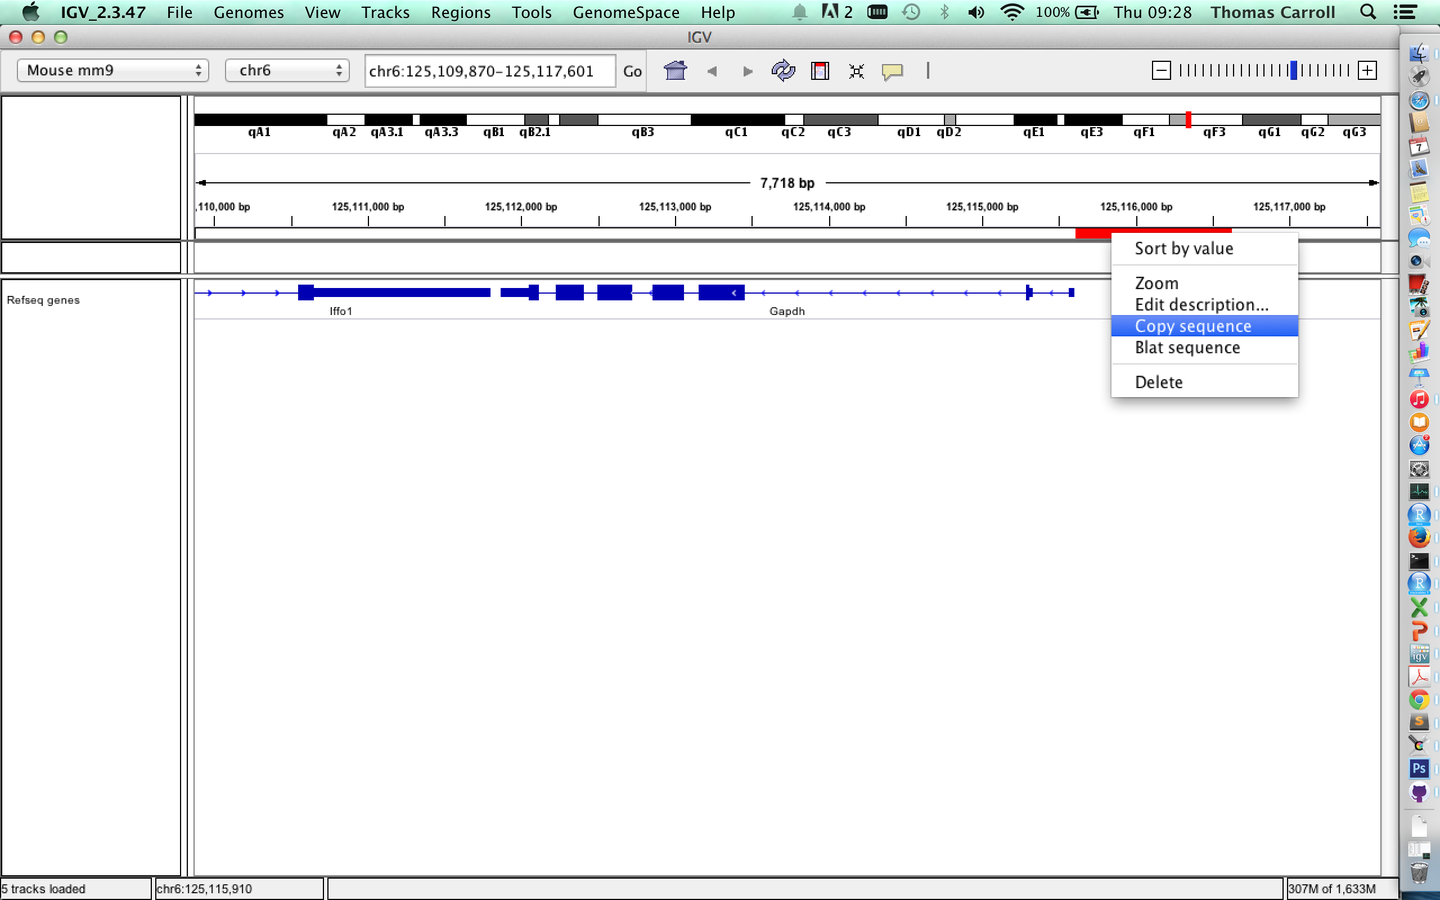
Sequences from regions of interest
BLAT
Viewing sequences
- At a predefined resolution, sequence information becomes available.
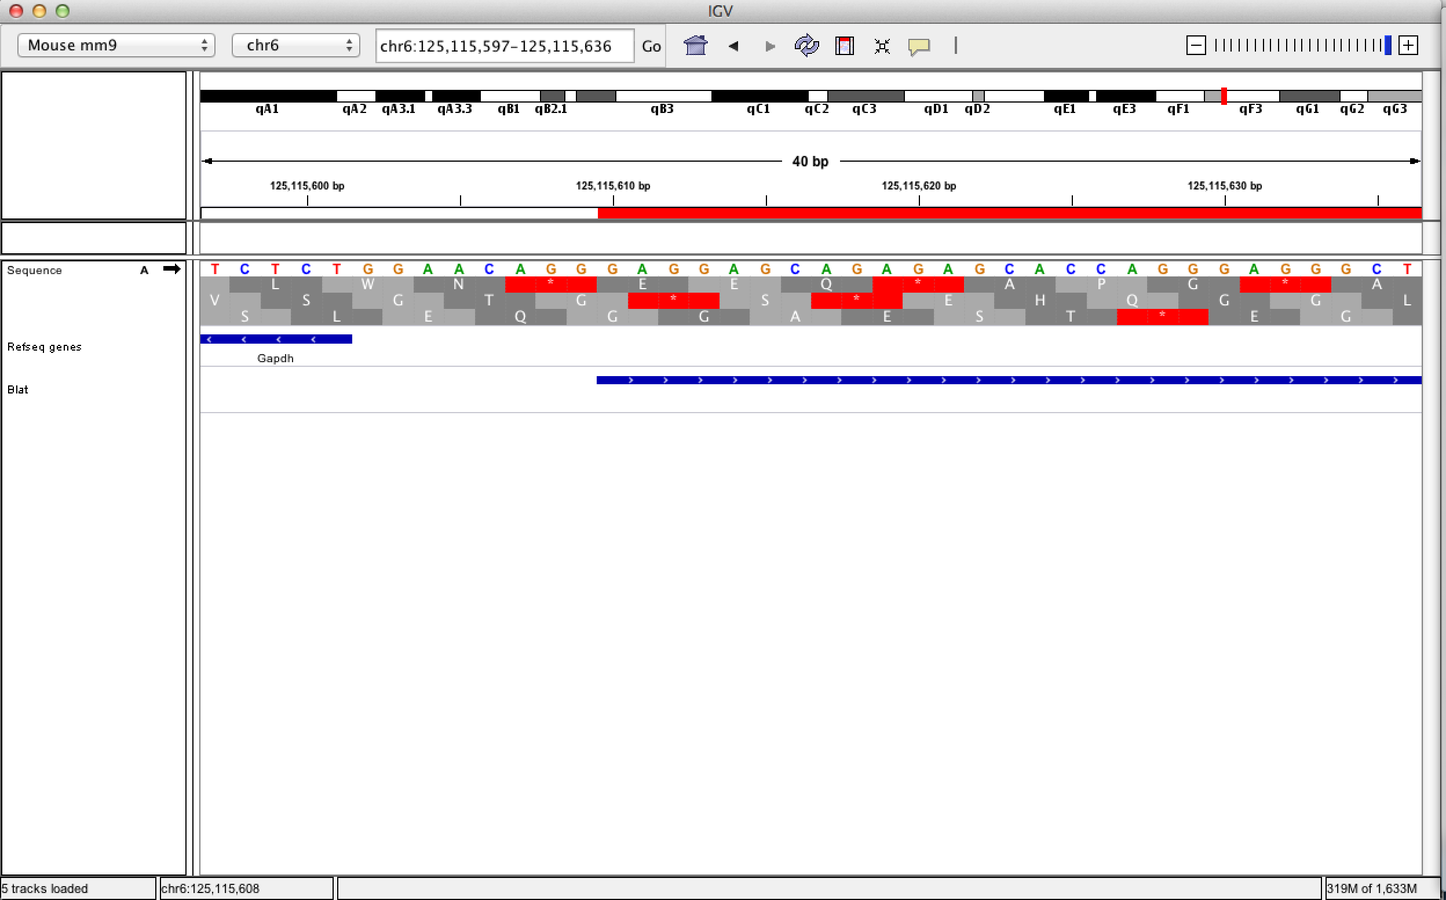
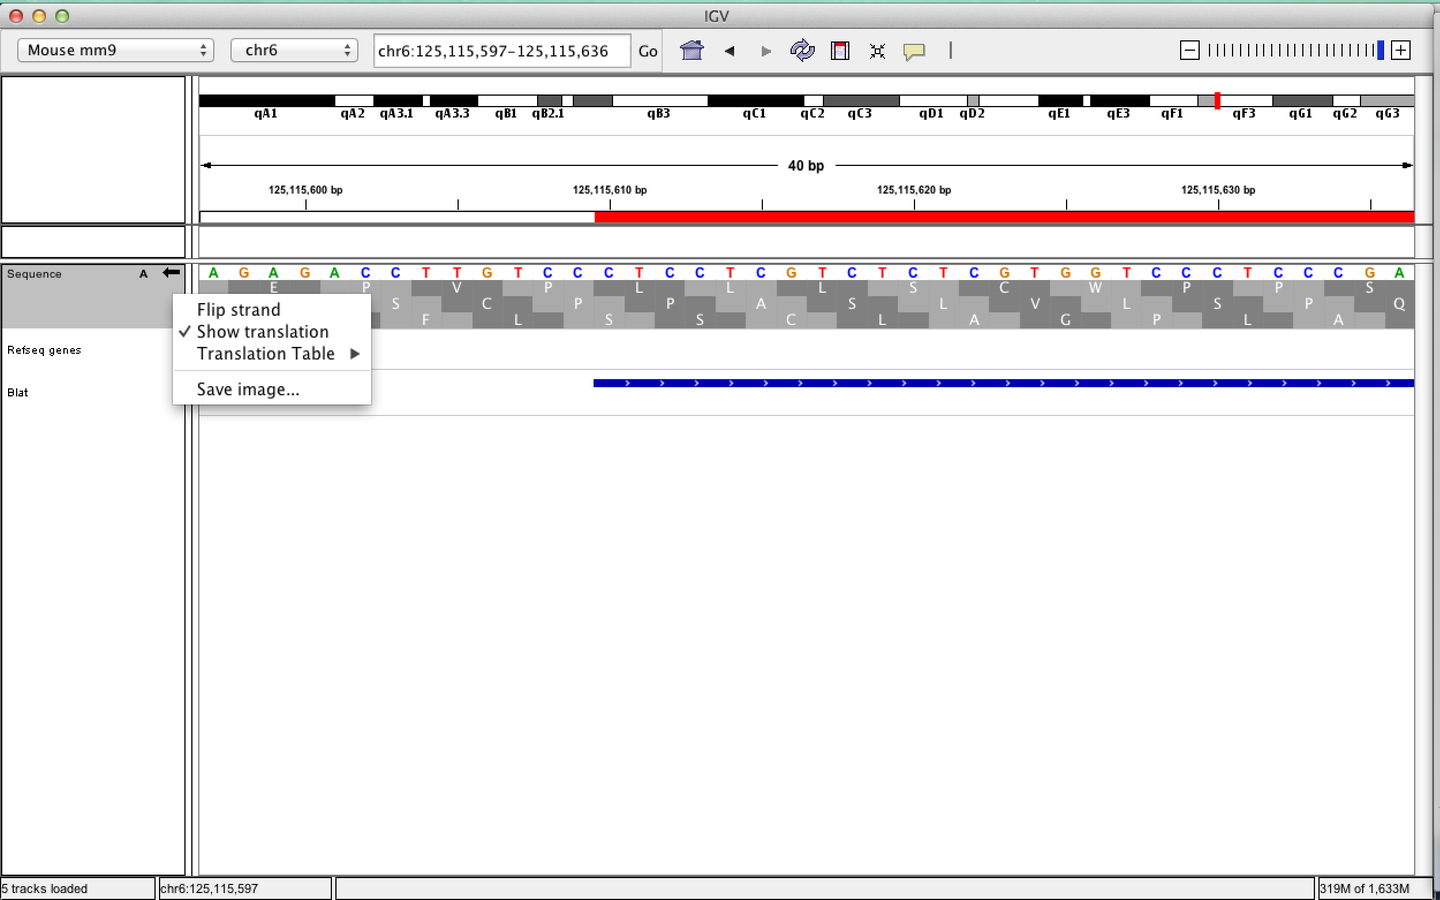
Viewing sequences
- Strand of sequence can be altered.
- Differing translation tables can be selected
Loading data in IGV
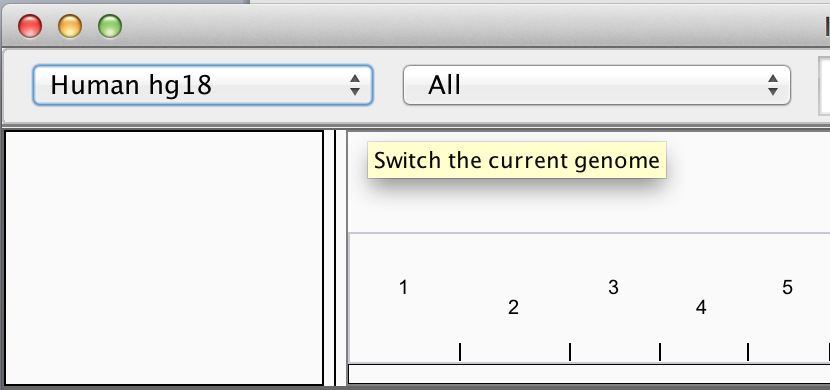
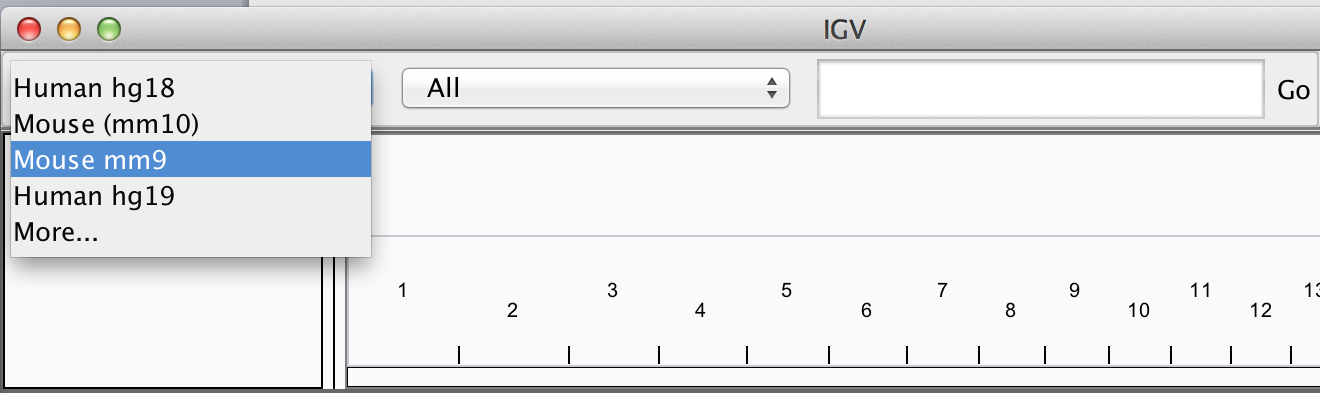
Loading Genome Information
- Most genomes can be selected from dropdown.
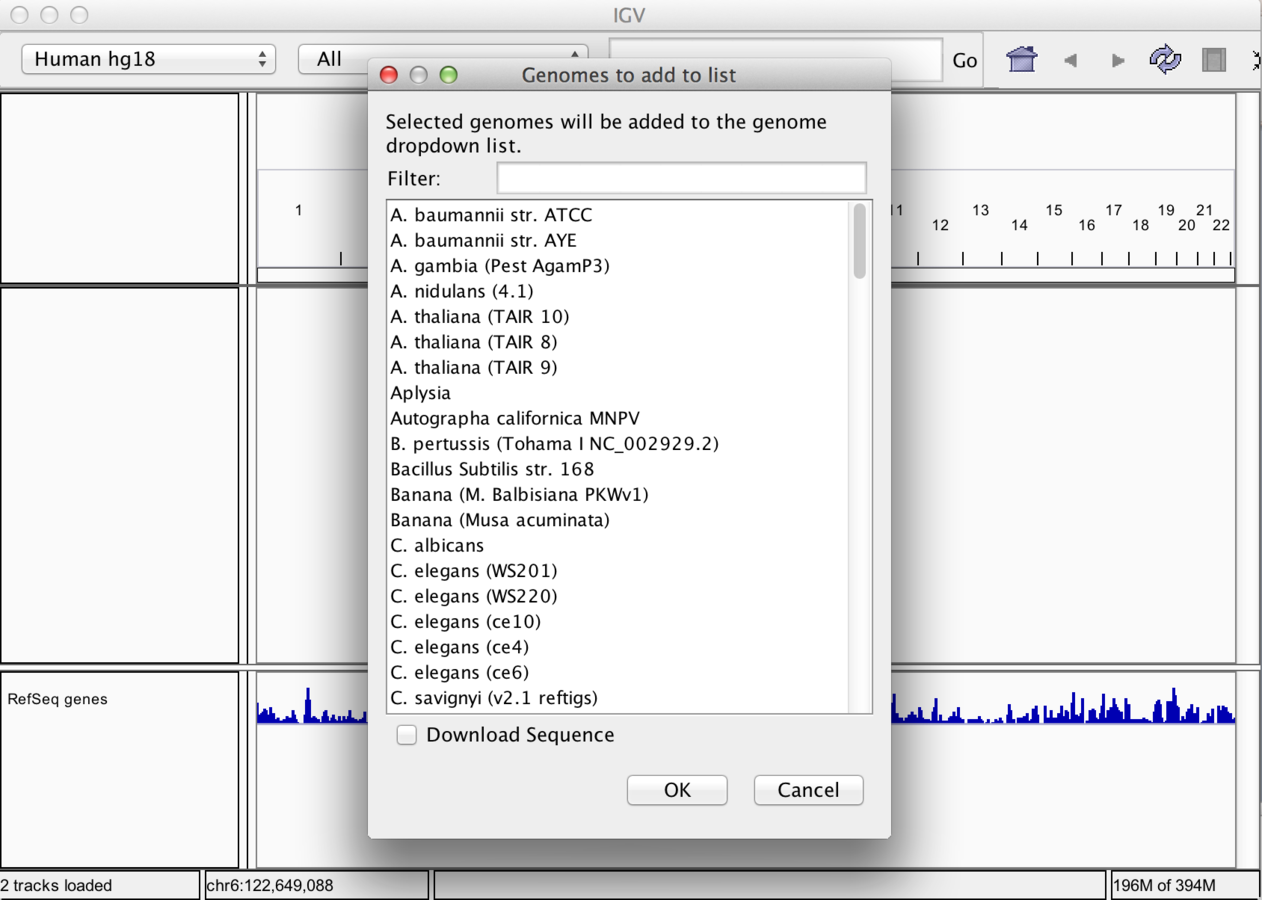
Loading Genome Information
- Genomes not included may be downloaded from repository
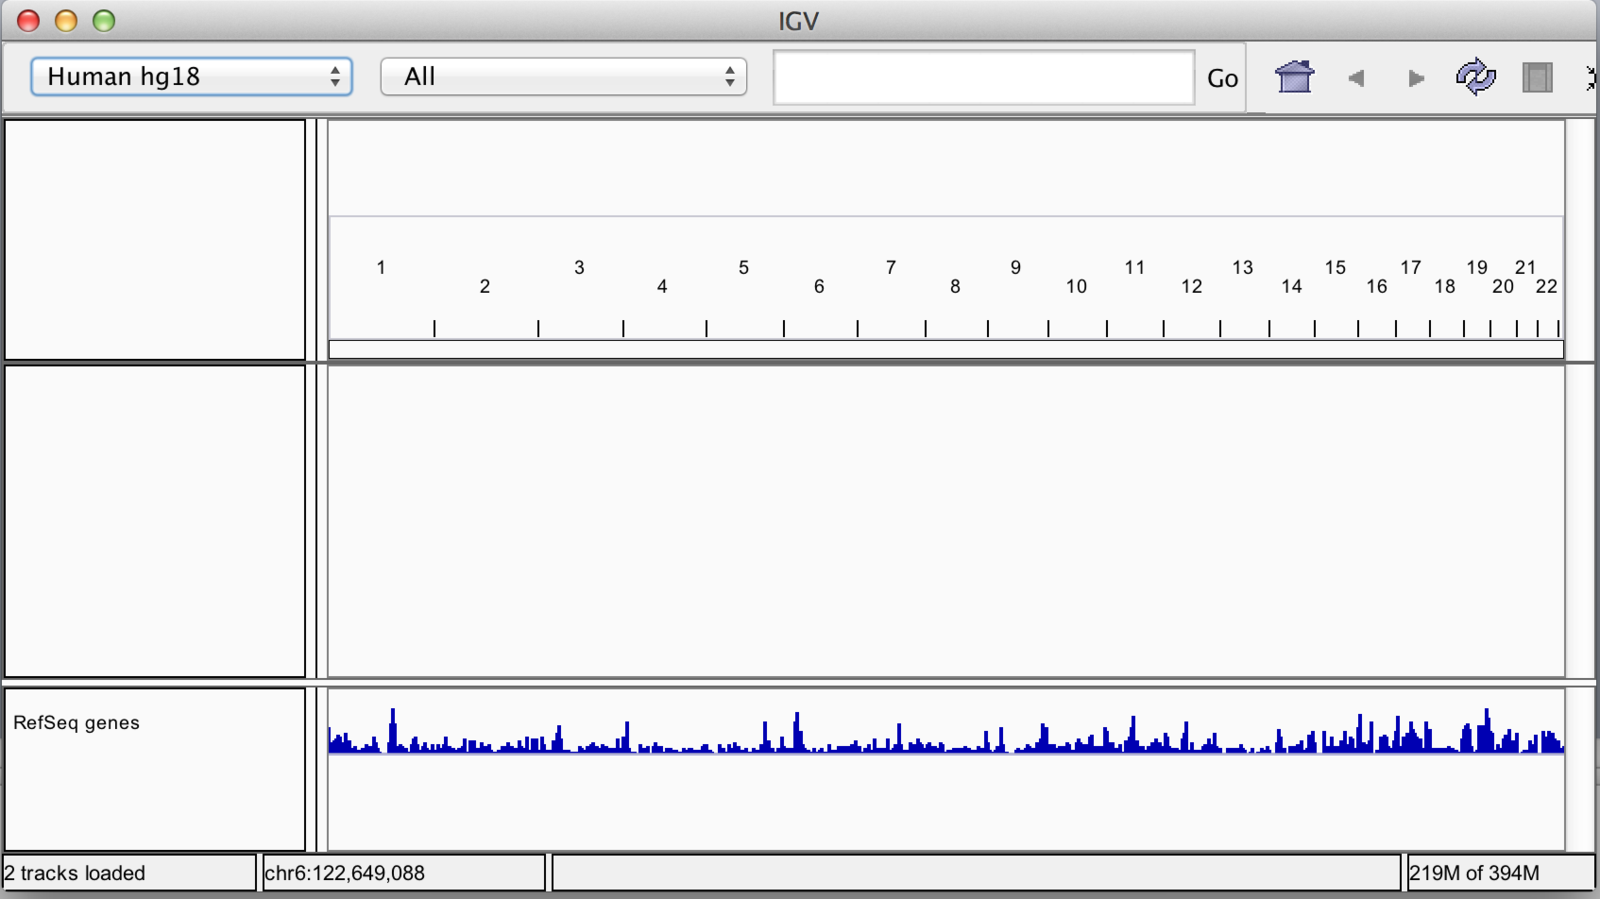
Loading Genome annotation
- For supported genomes, gene positions are automatically included in “feature” panel.
- Additional gene positions can be loaded into IGV in gff format.
Loading Sample data
- Most common formats can be loaded into IGV through file menu
- Acceptable data formats include:-
- BED (.bed)
- BAM and index (.bam with .bai/.bam.bai)
- BigWig (.bw)
- BedGraph/Wig (.bedGraph, .wig)
- And many more…
- link to IGV formats
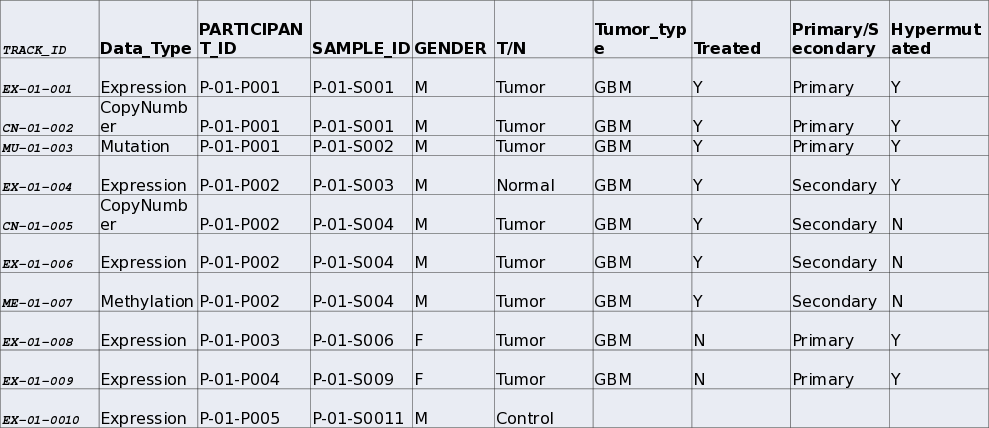
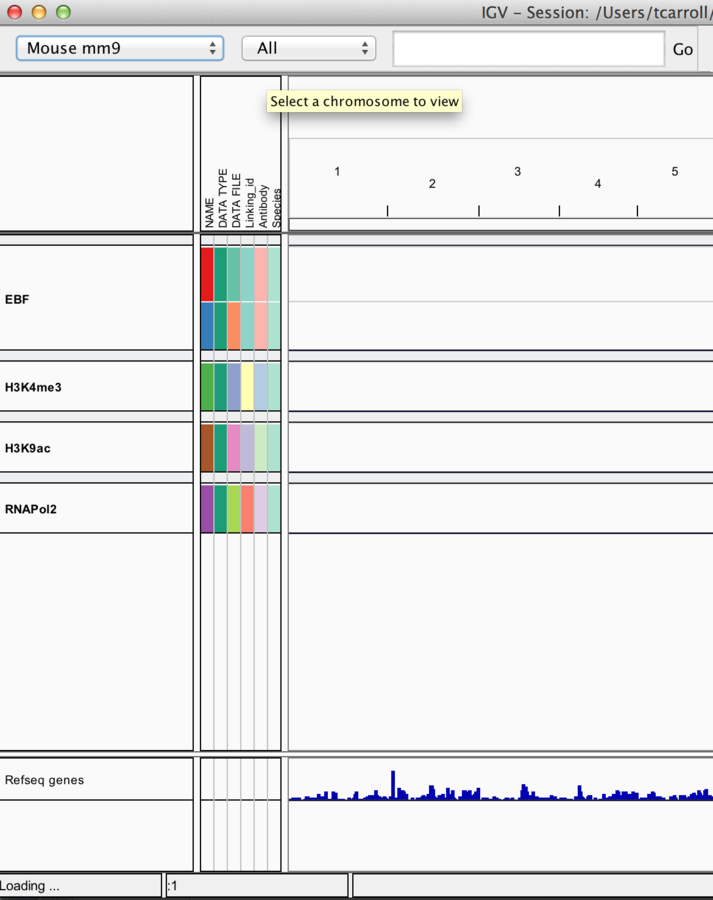
Loading Sample Metadata
- IGV allows the inclusion of information on samples.
- Sample information is then included in sample information panel.

Example Sample information file
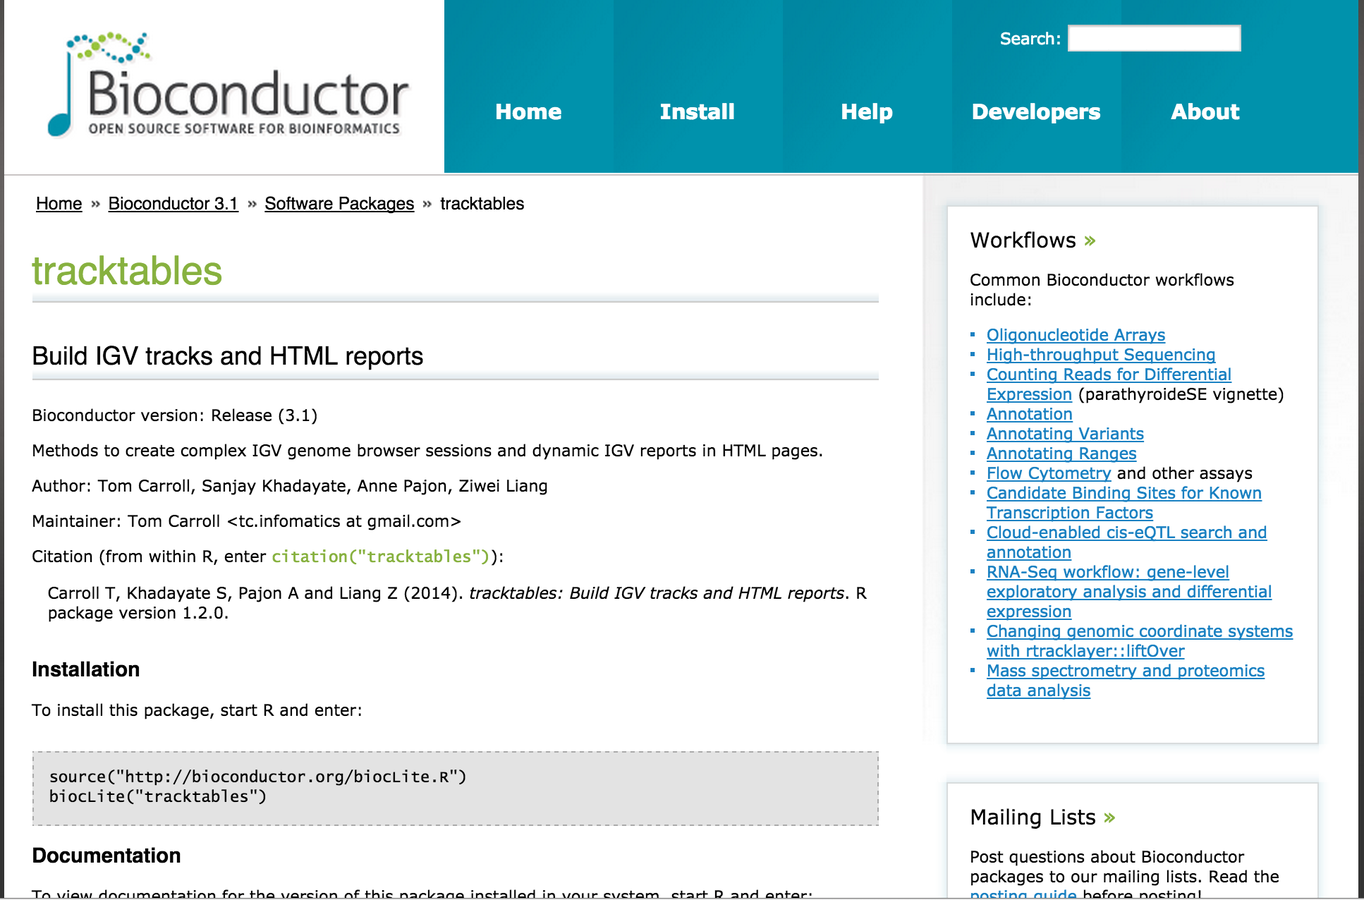
Tracktables package.
- R/Bioconductor packages
- Sanjay and Tom.
- Creates HTML reports with sample information for use with IGV.
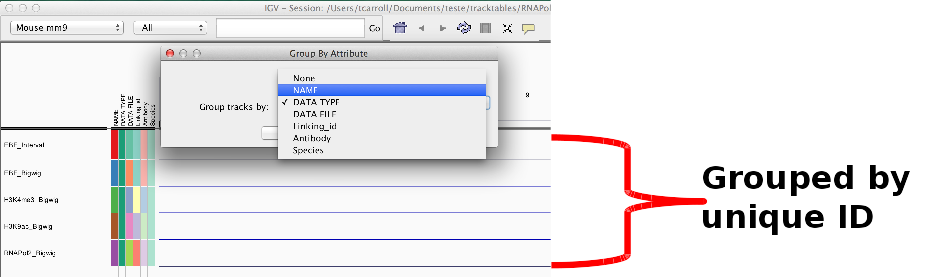
Using sample information.
- Sample information can include discrete and continuous.
- Can be used to “sort” and “filter” tracks.
- Can split tracks across panels by “group”

Loading external data and annotation
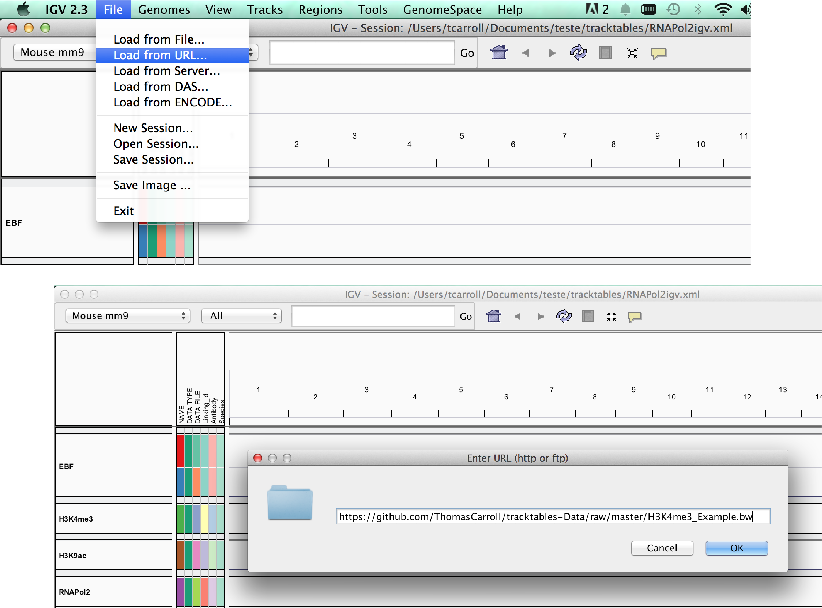
Load data from a URL.
- As with UCSC, IGV supports data hosted on external servers.
- Data accessible from a URL such as HTTP and FTP can be loaded using the “Load from URL”.
Loading external data and annotation
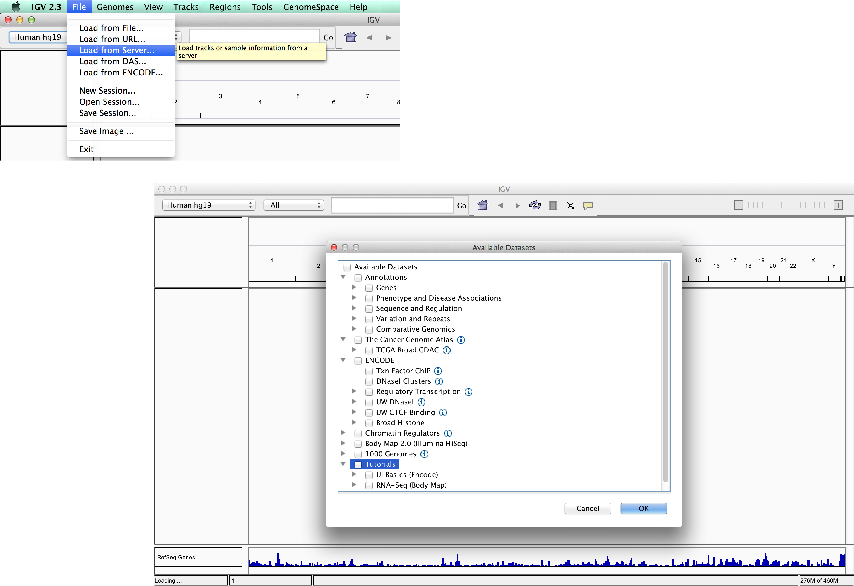
Load data from a server
(IGV/Encode servers).
- Unlike UCSC, IGV comes with few external tracks.
- External tracks (relevant to the genome) can be loaded from the IGV server or Encode-IGV server.
Grabbing encode data directly
- Encode data can be downloaded from UCSC.
- http://genome.ucsc.edu/ENCODE/
- This however does not come with sample information provided through IGV interface
Viewing data
Viewing data
- IGV associates common file formats with default display methods.
- Most of the time IGV will make a sensible choice how we wish to display data.
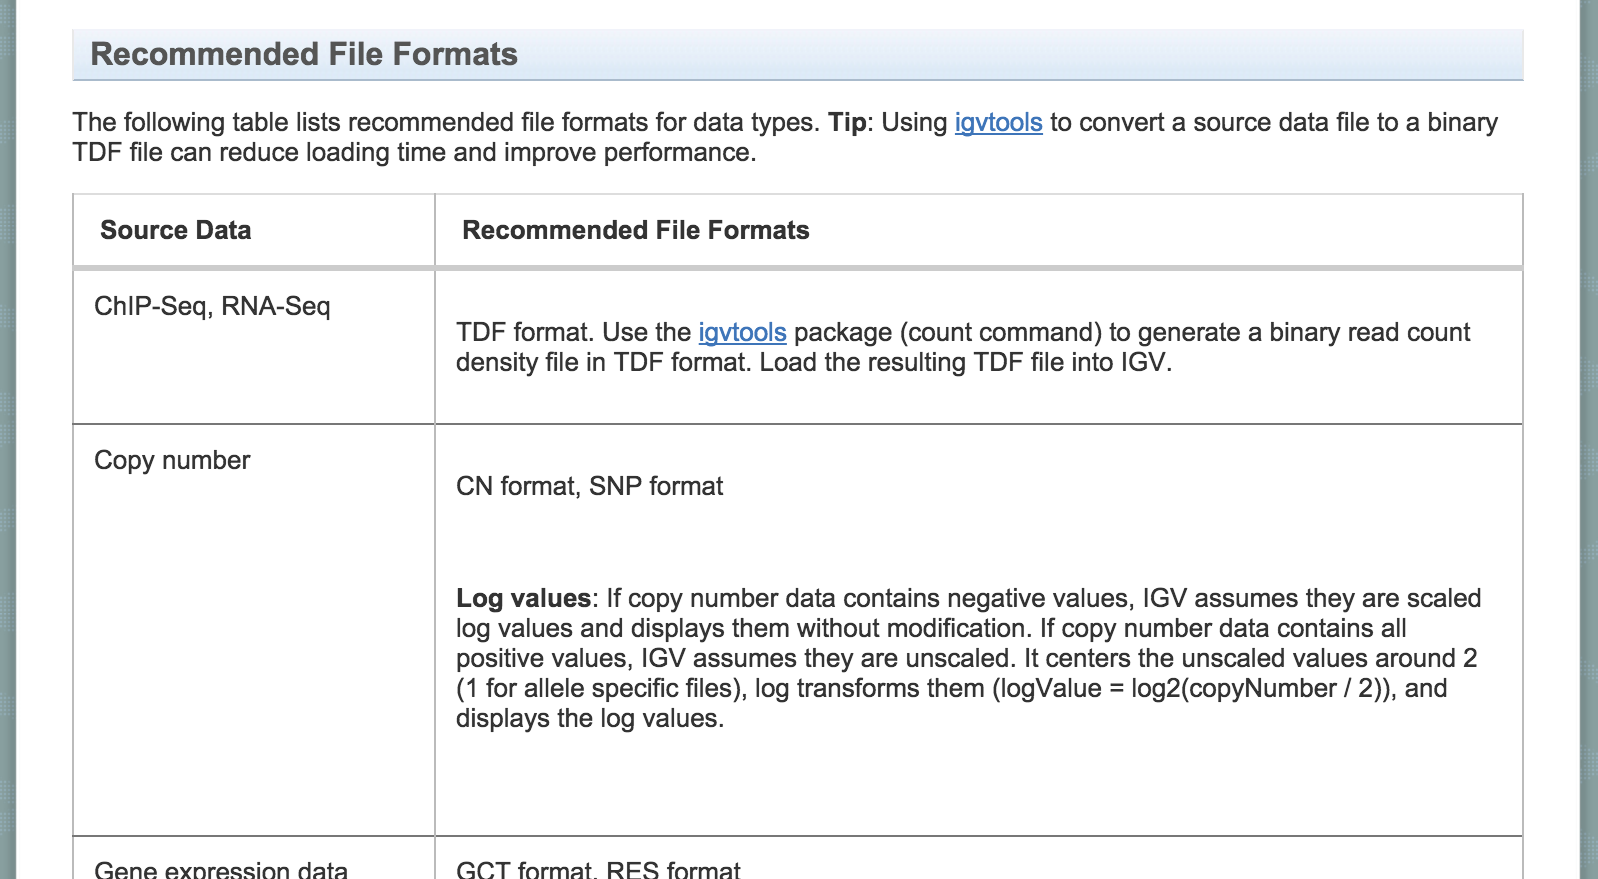
Accepted formats and default display.
Information on accepted file formats and default display can be found at -
http://www.broadinstitute.org/software/igv/RecommendedFileFormats
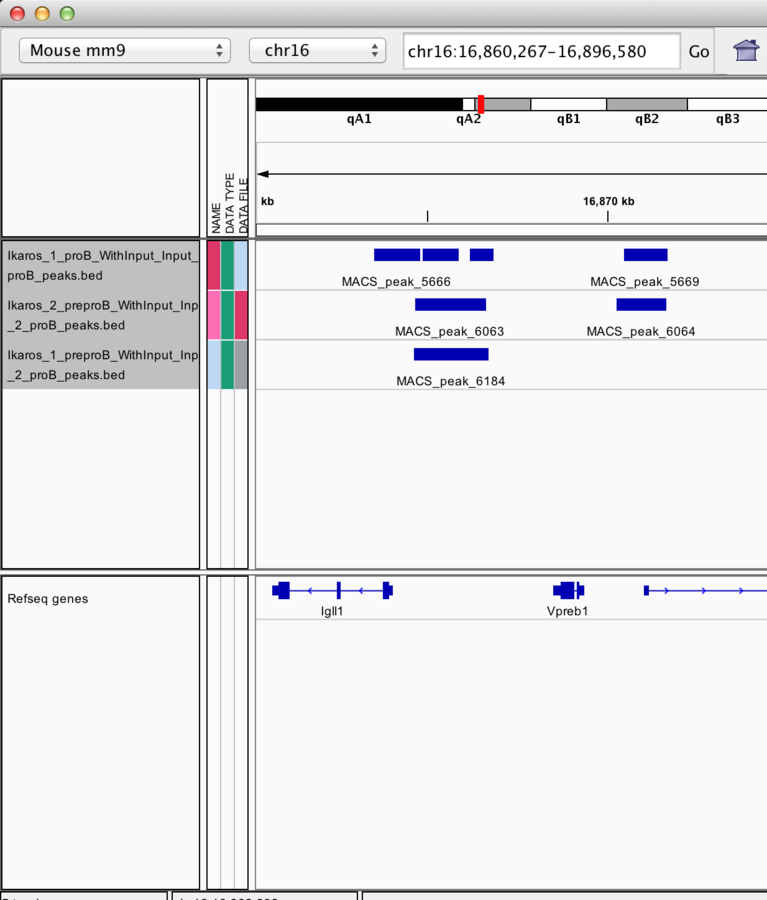
Bed/bigBed
- Basic
- Tab-delimited
- Chrom,Start,End
- Bed6
- bigBed (recommended)
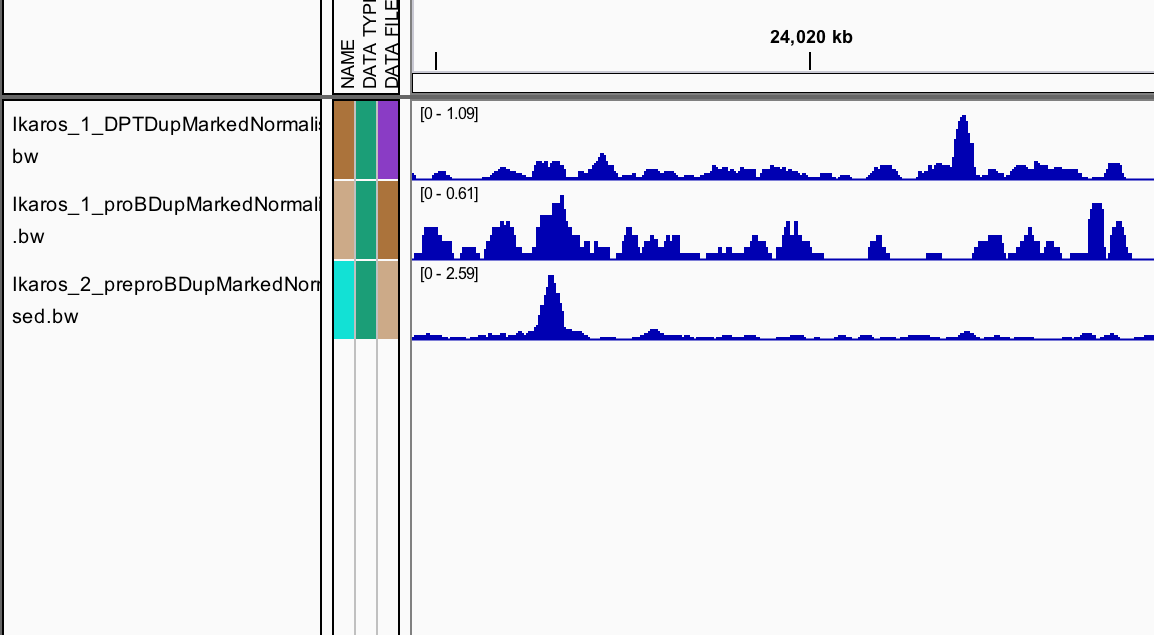
Wig, BedGraph and BigWig
- Wig/bedGraph require high memory load
- Recommended format is bigWig
BAM alignment files
- BAM files contain alignment information.
- Require an accompanying .bai index file for display
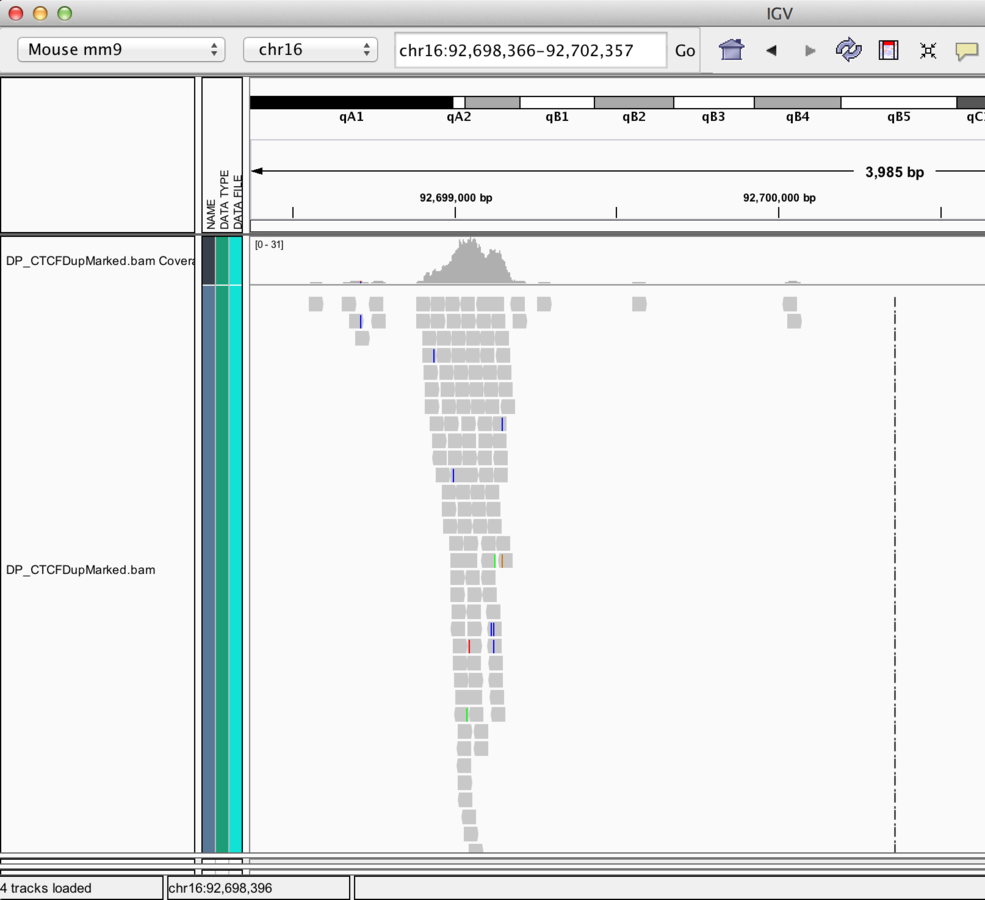
Finer control of display
- IGV allows for customization of track display.
- Menu bar -> View -> Preferences
- Select track (right click)
Display preferences
General
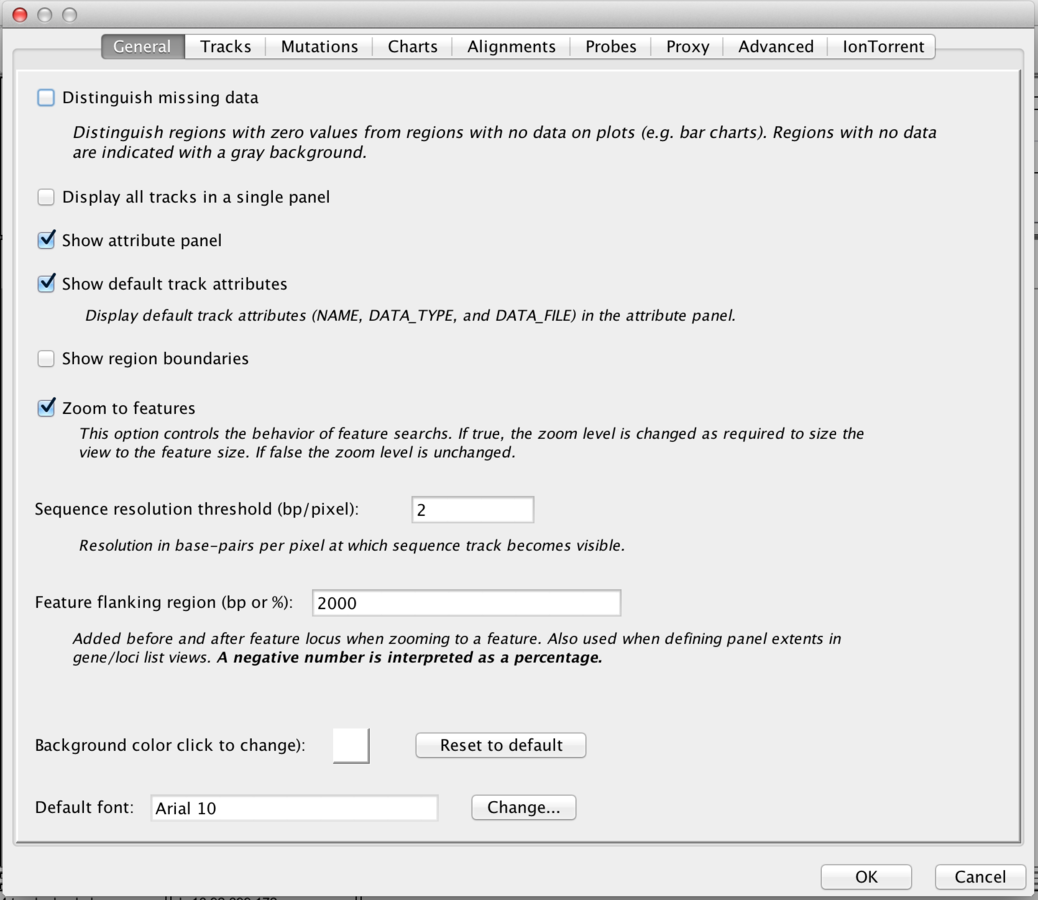
Display preferences
Tracks
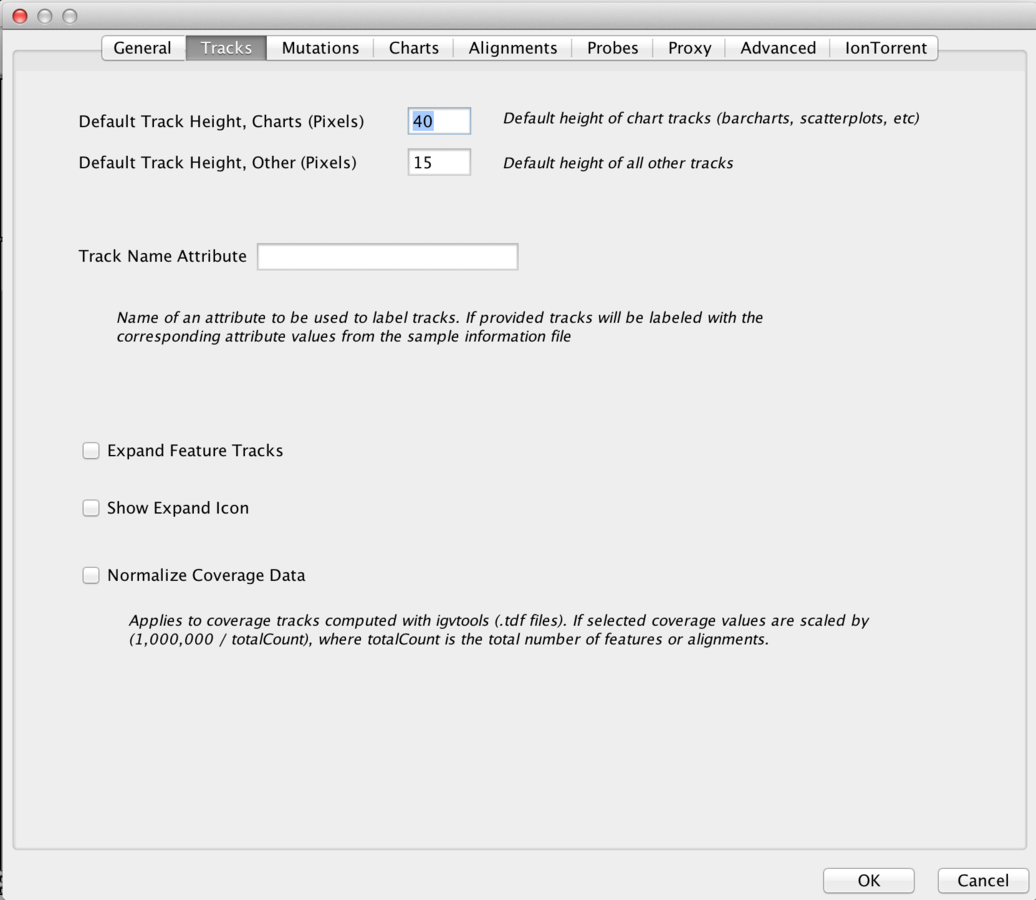
Display preferences
Alignments
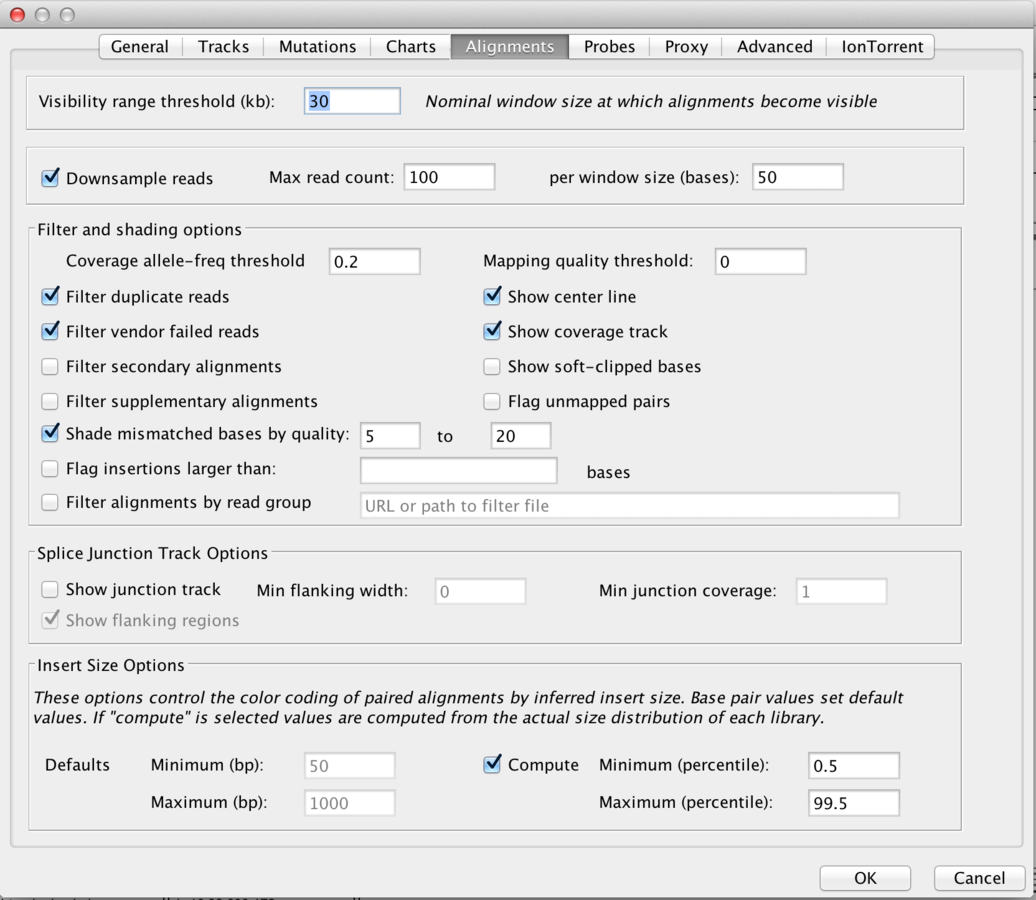
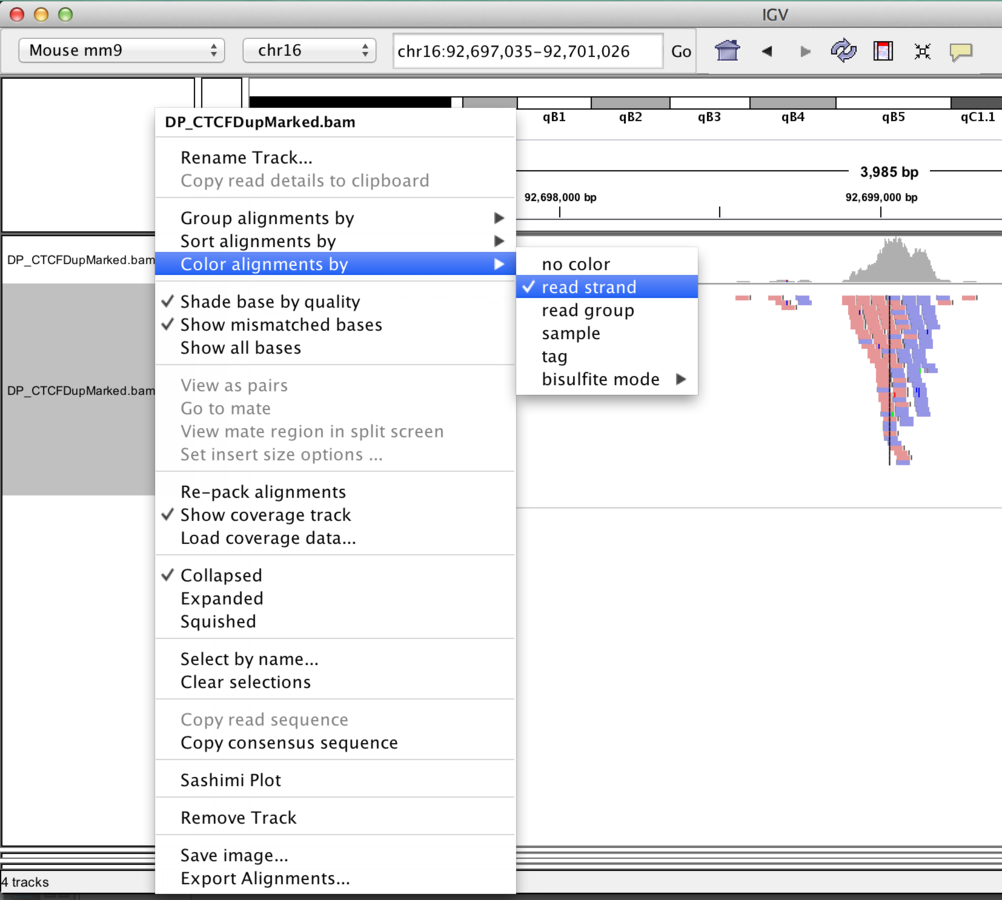
Track display options
BAM
- Read Packing, grouping, sorting, colouring options.
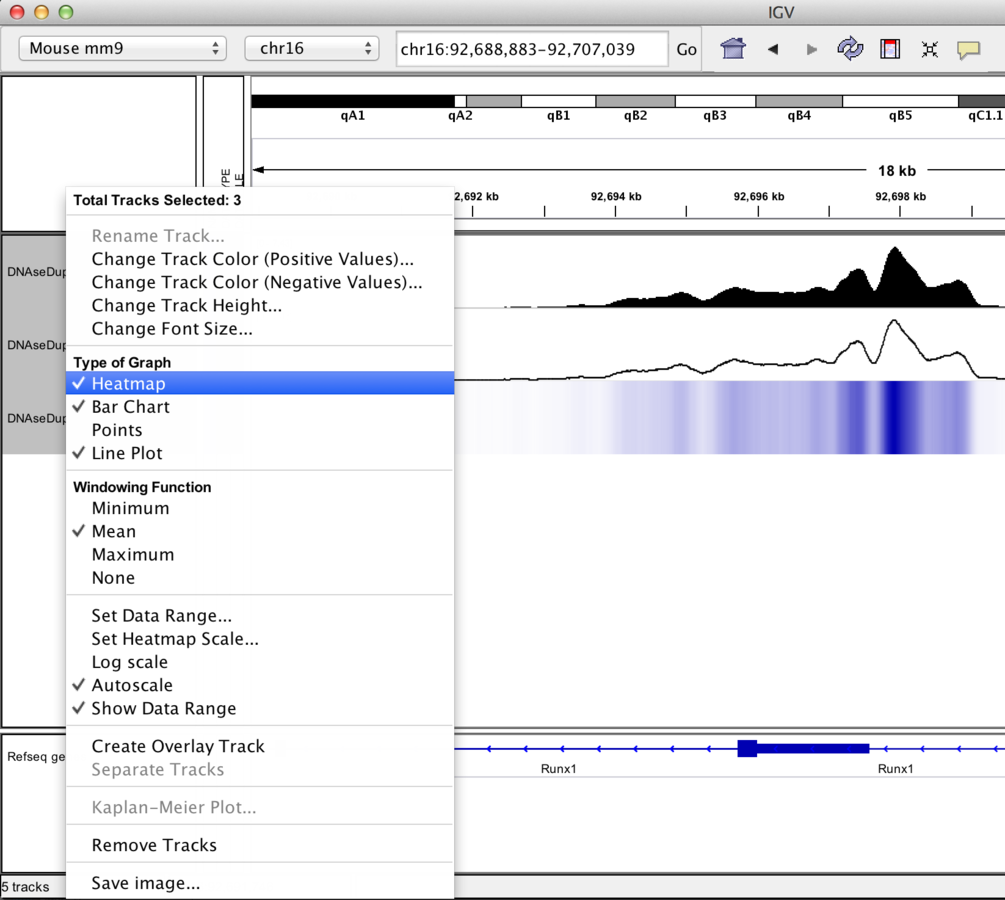
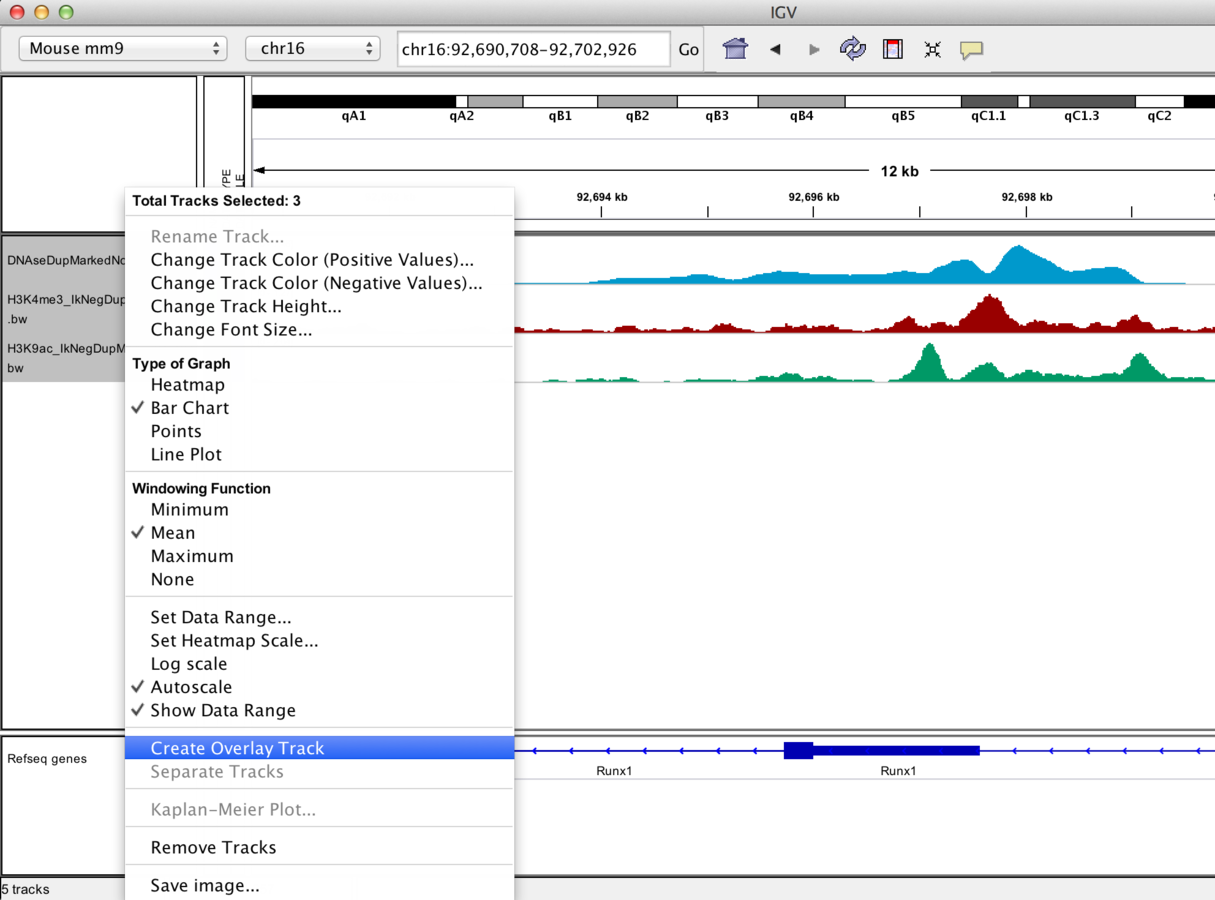
Track display options
Graph/interval files
- Track colour/appearance
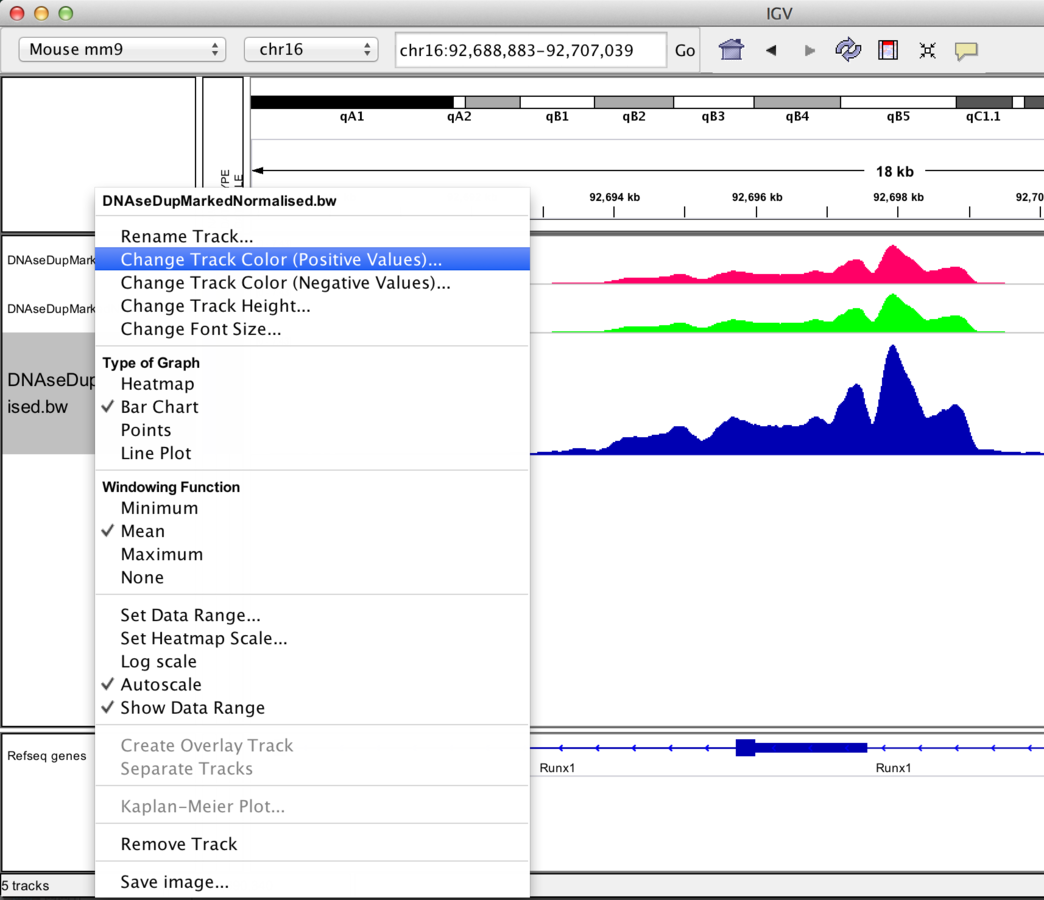
Track display options
Graph/interval files
- Graph type
Track display options
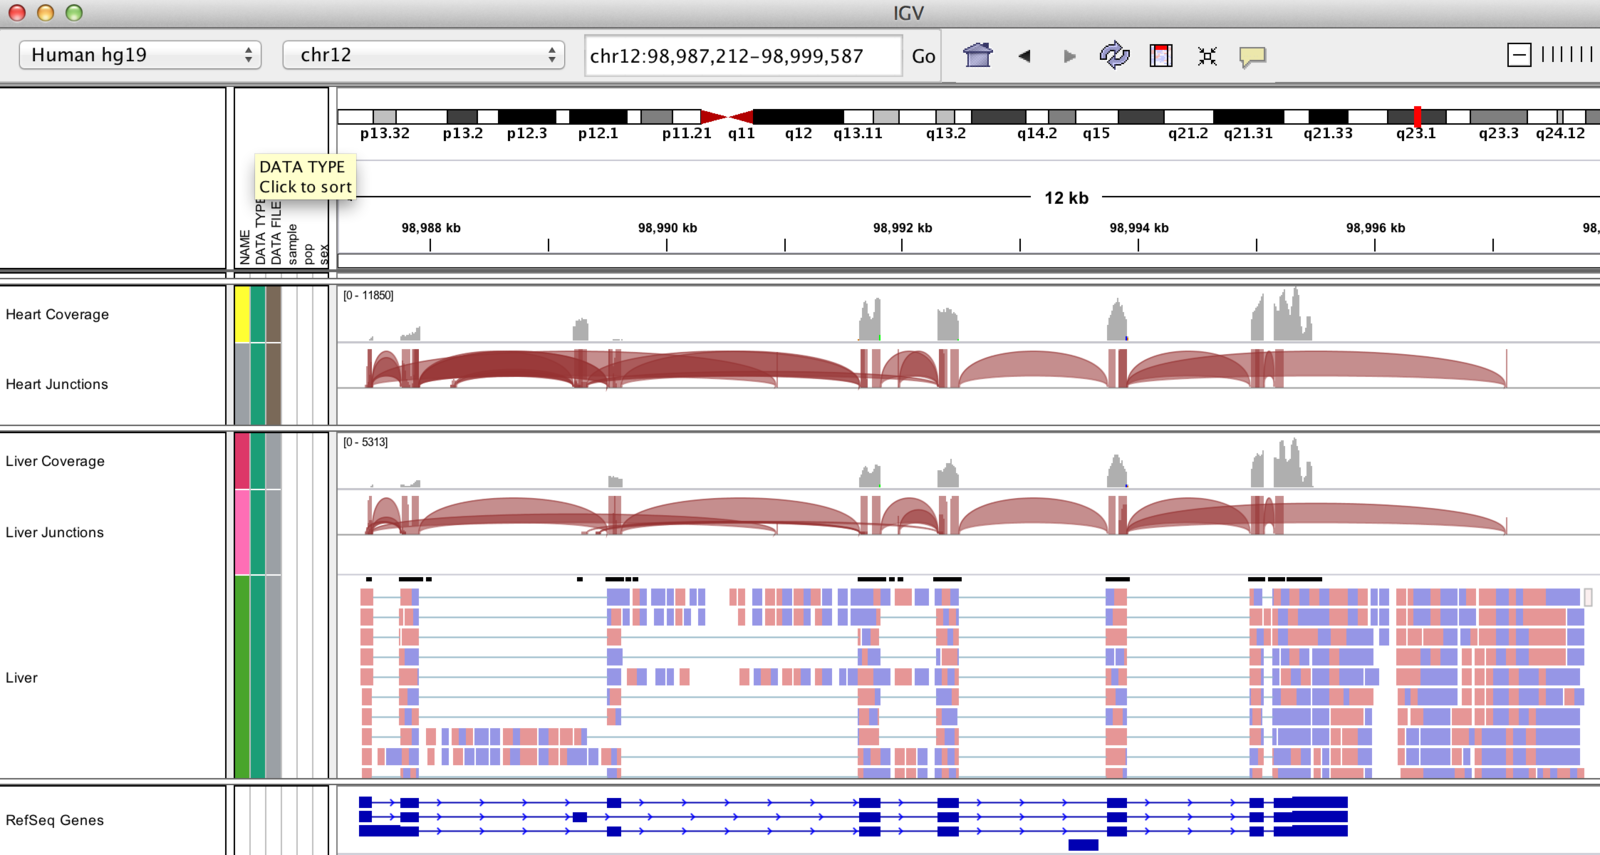
- Data Scaling.
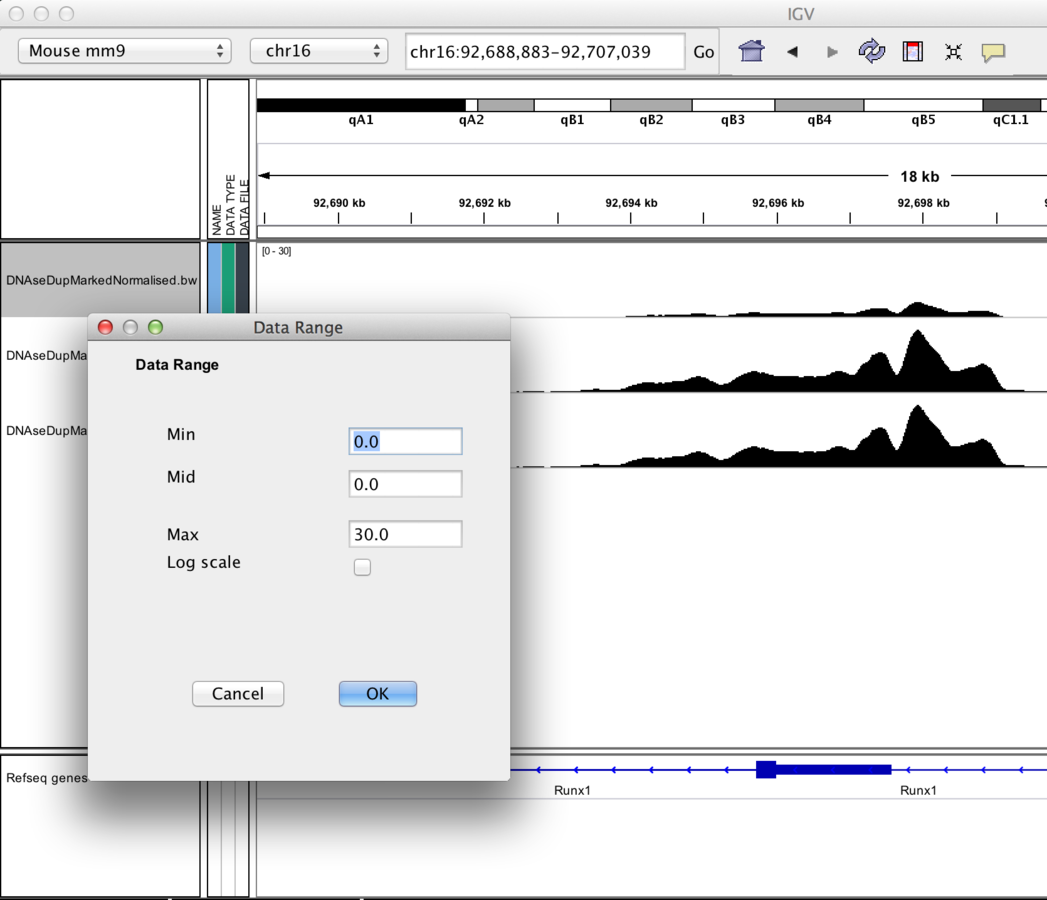
-
Autoscaling adjusts to track's visible signal maximum
Some cool features
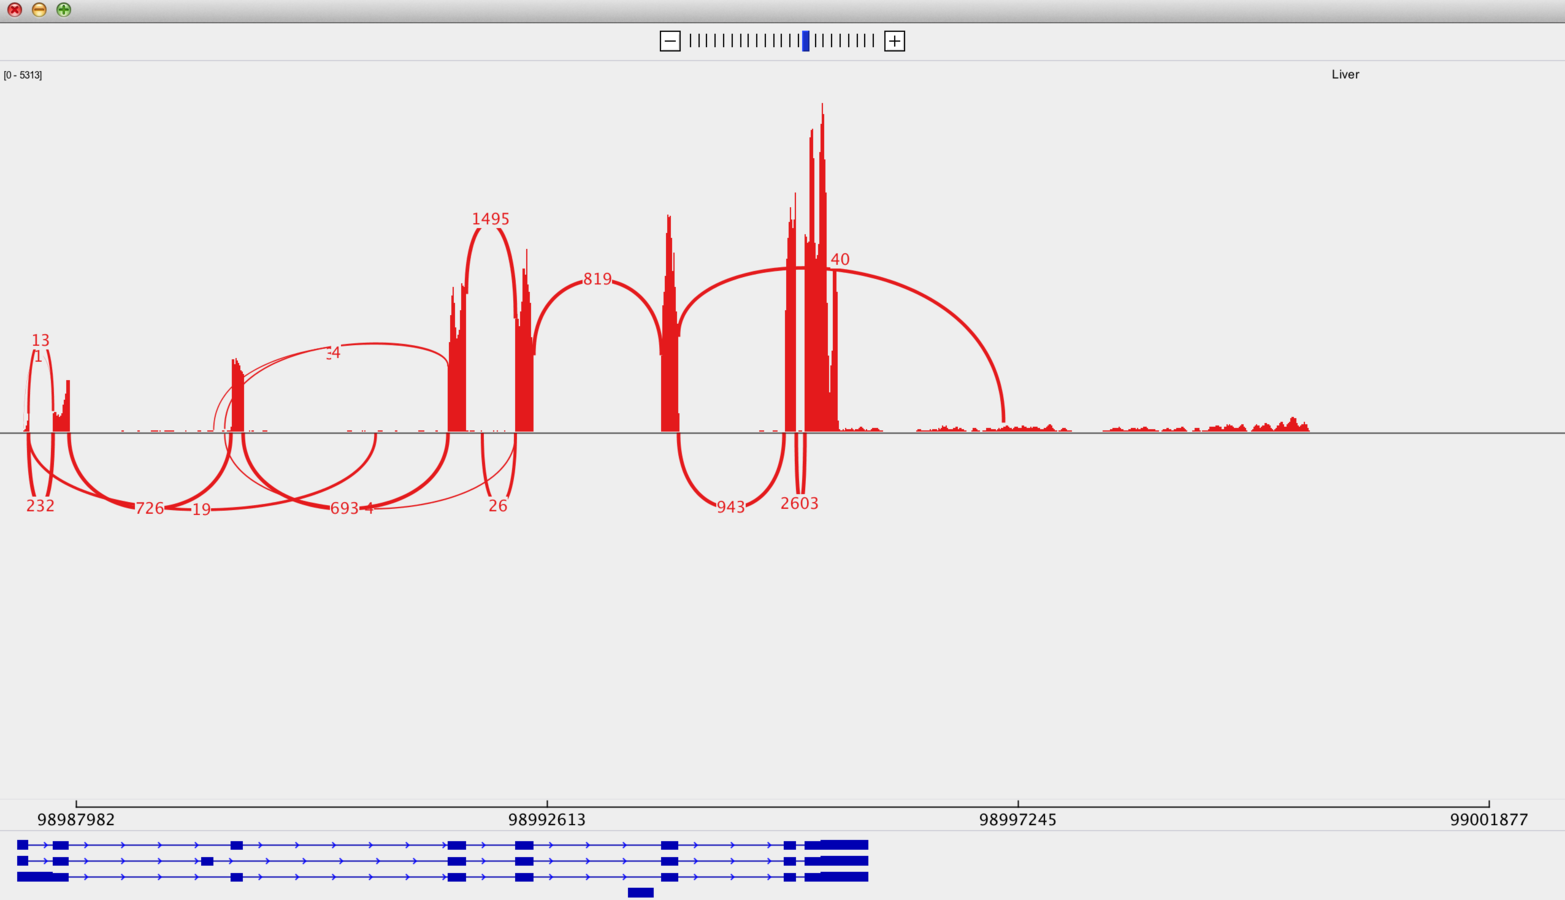
IGV can display splicing information!
...and do Sashimi plots
(http://www.broadinstitute.org/igv/Sashimi)
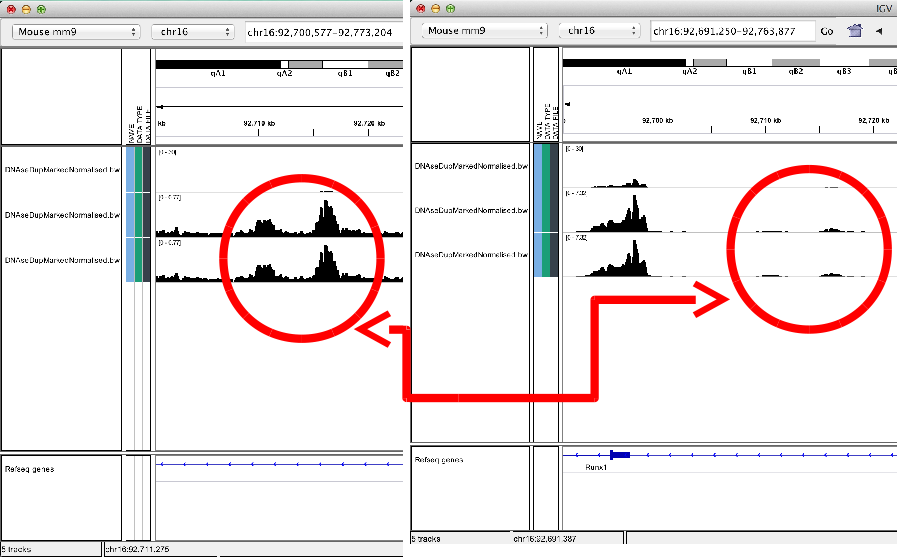
IGV can overlay tracks.
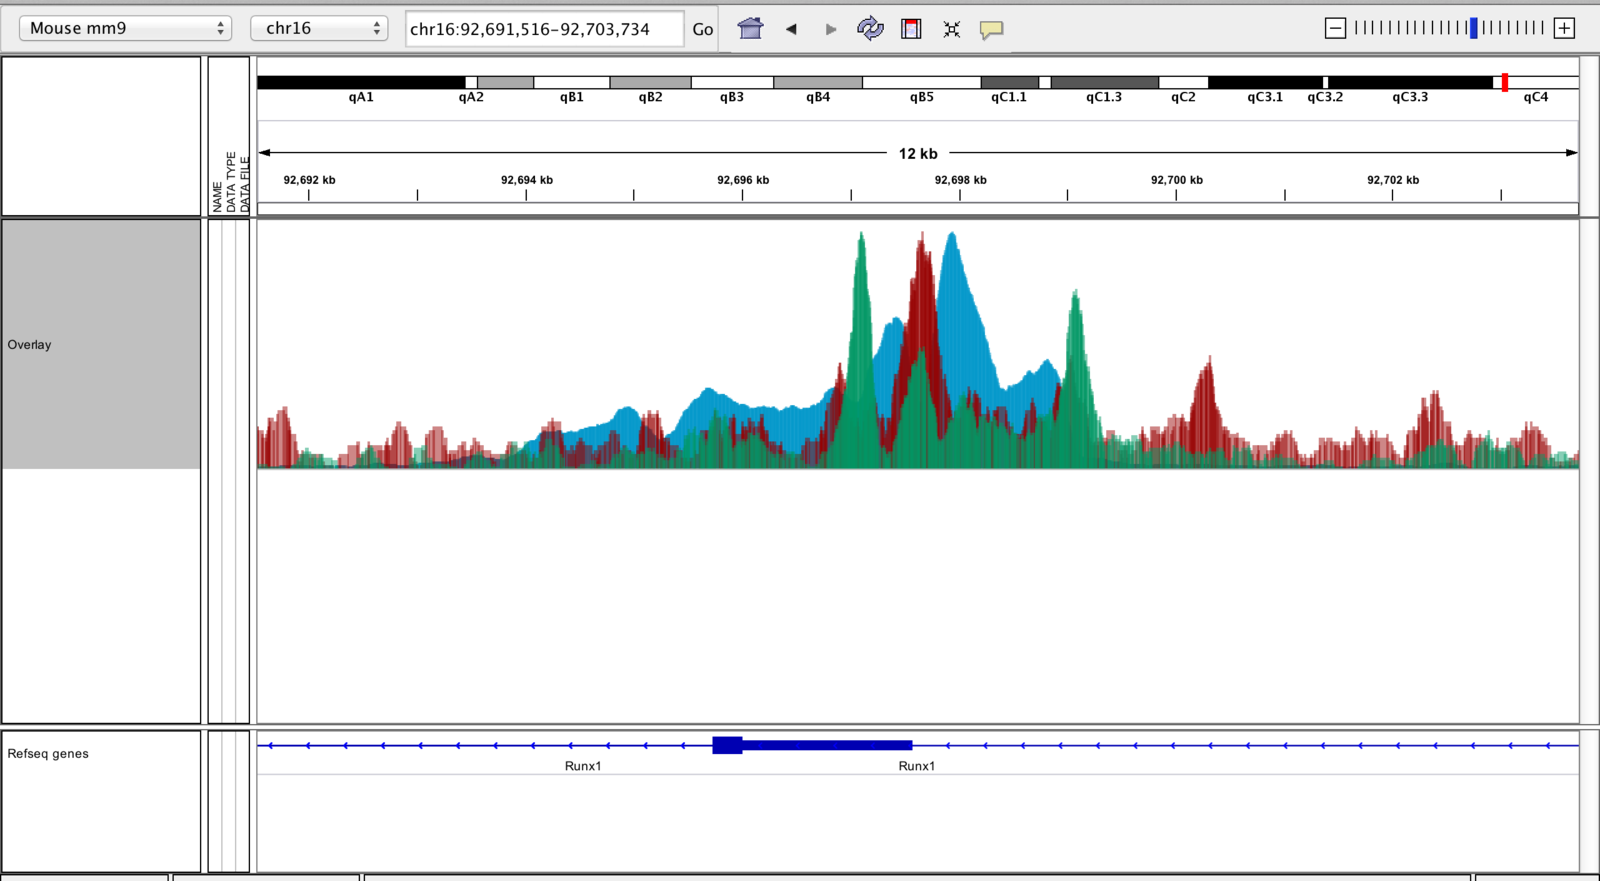
Track overlay example
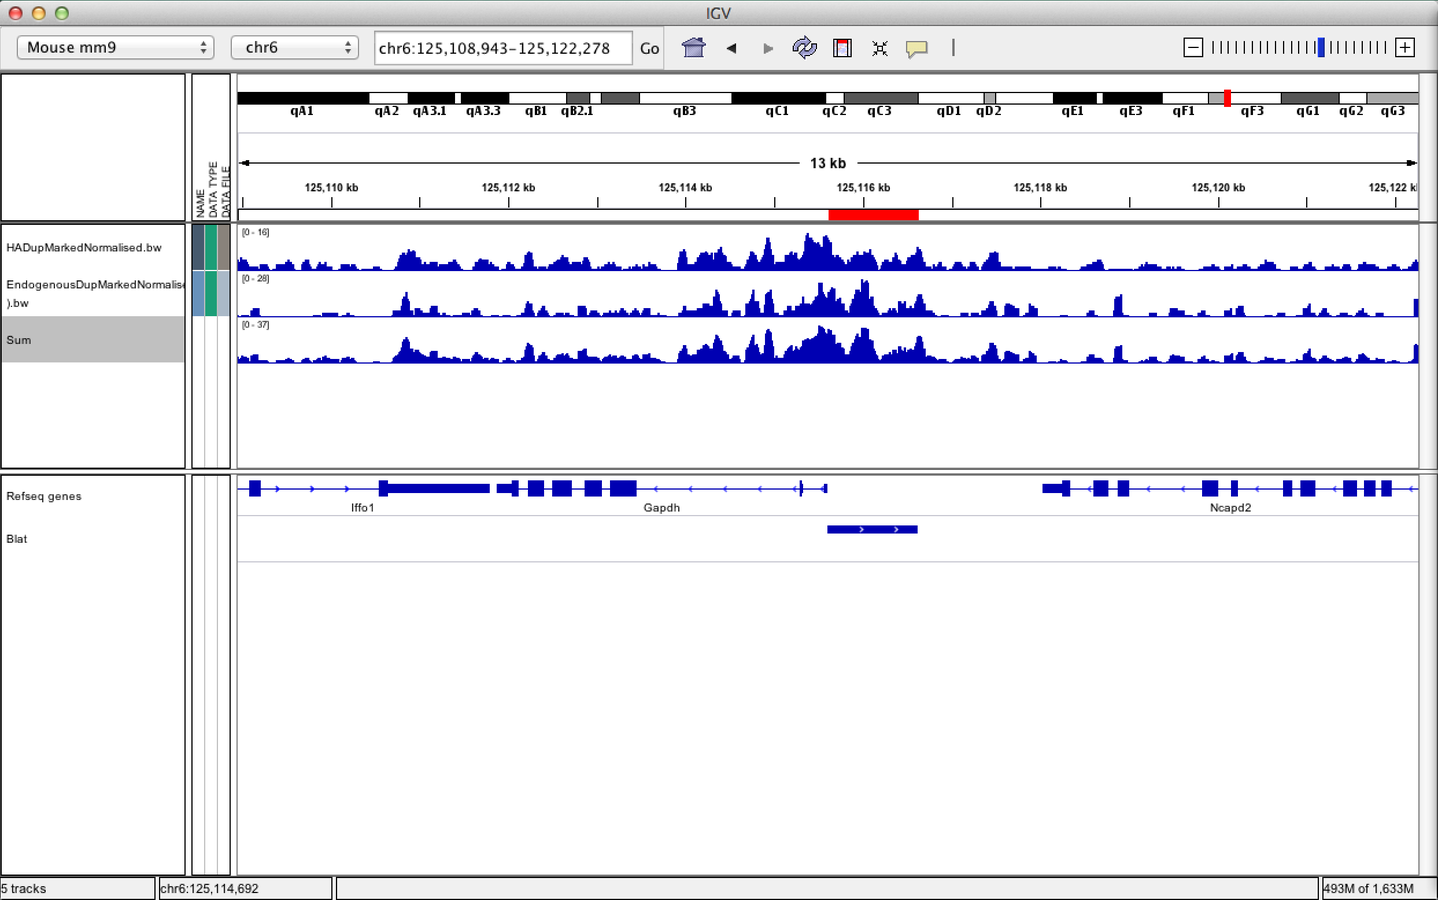
IGV can be used to combine tracks
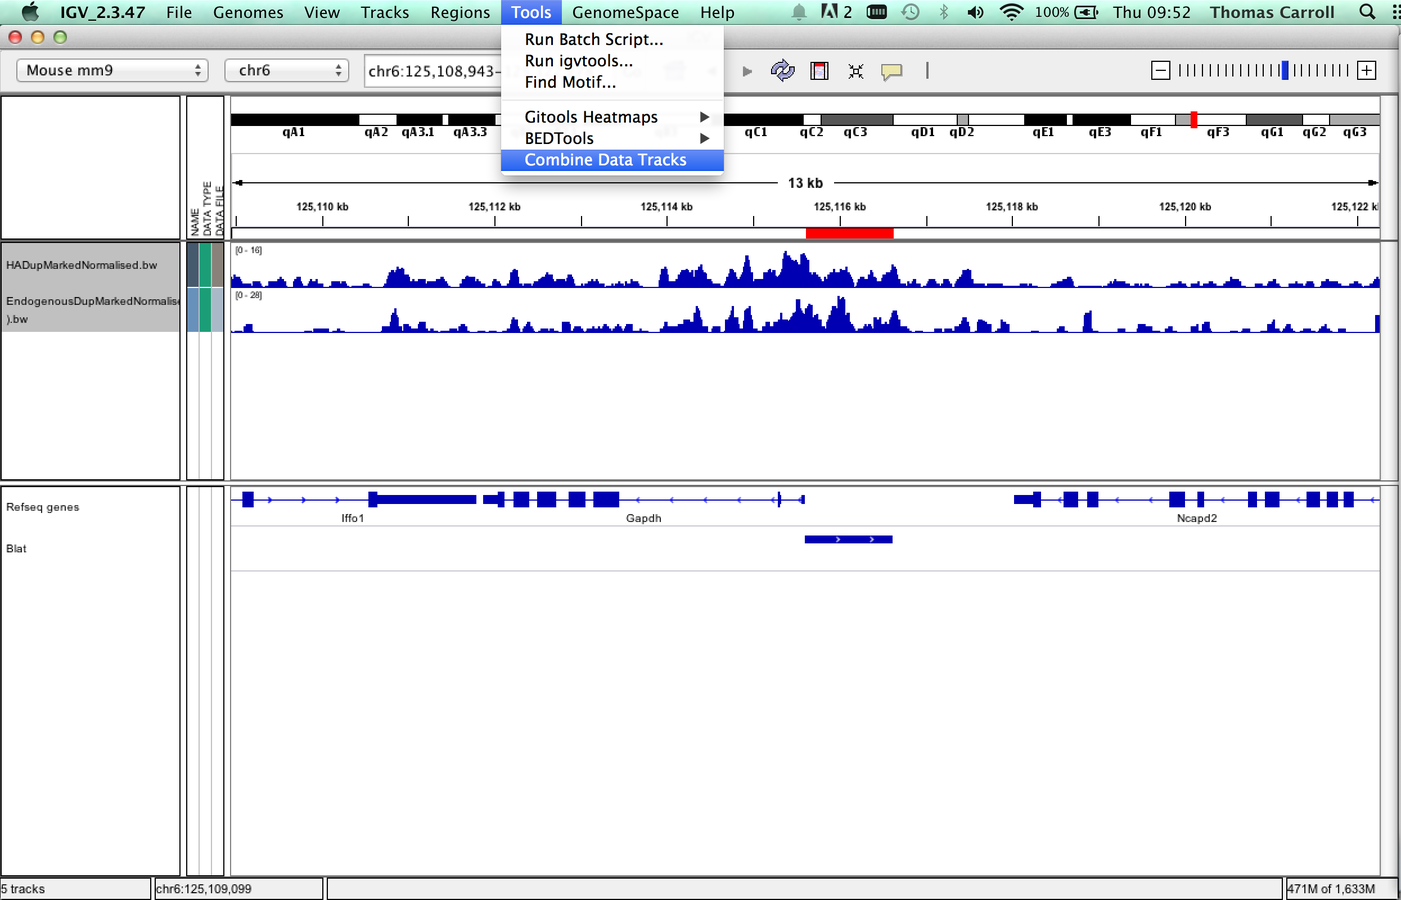
IGV can be used to combine tracks
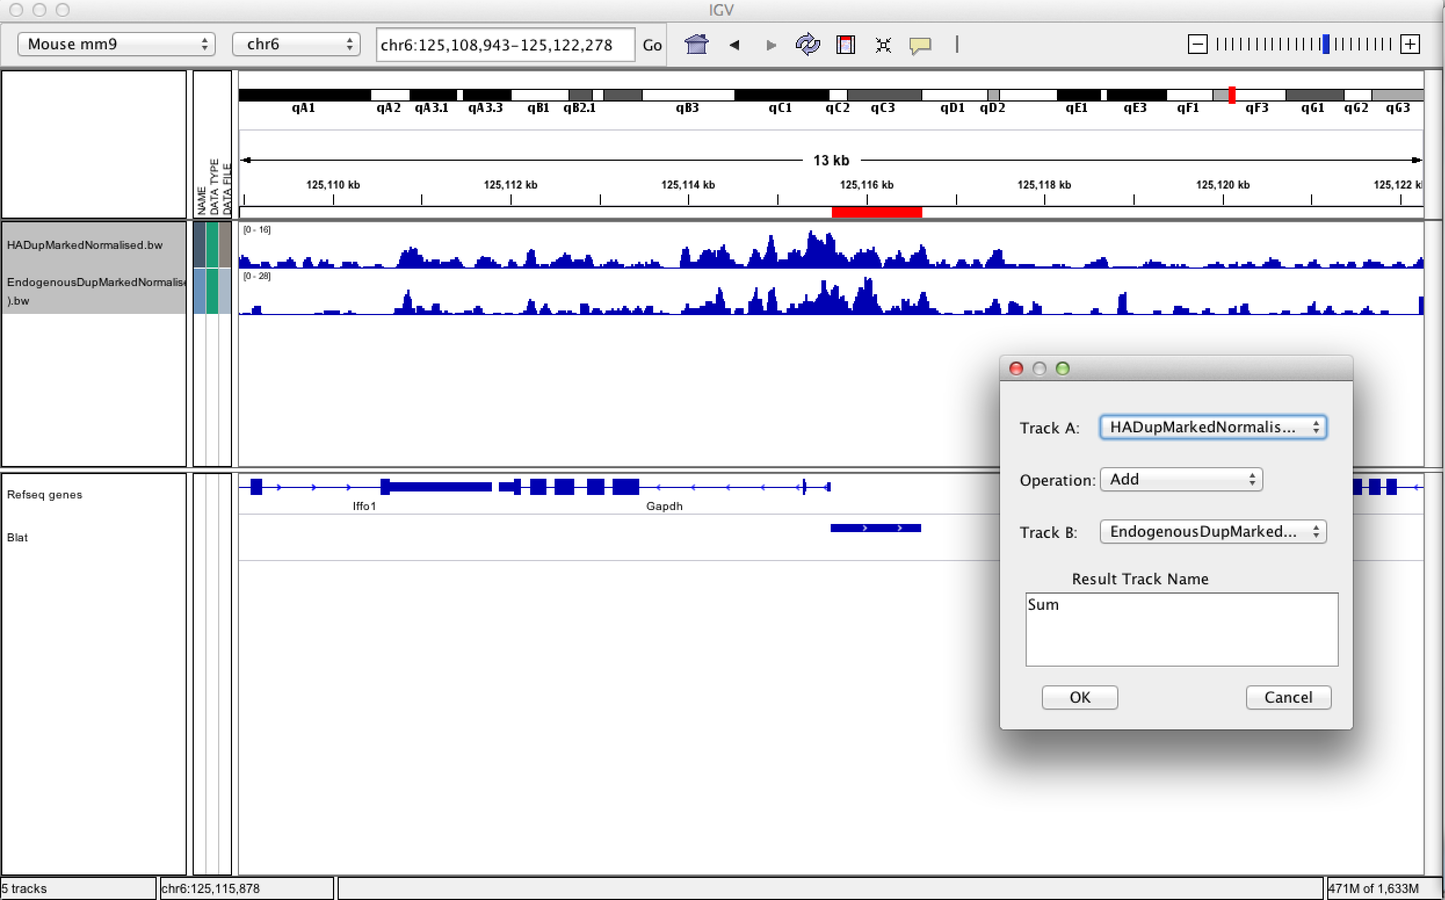
IGV can be used to combine tracks
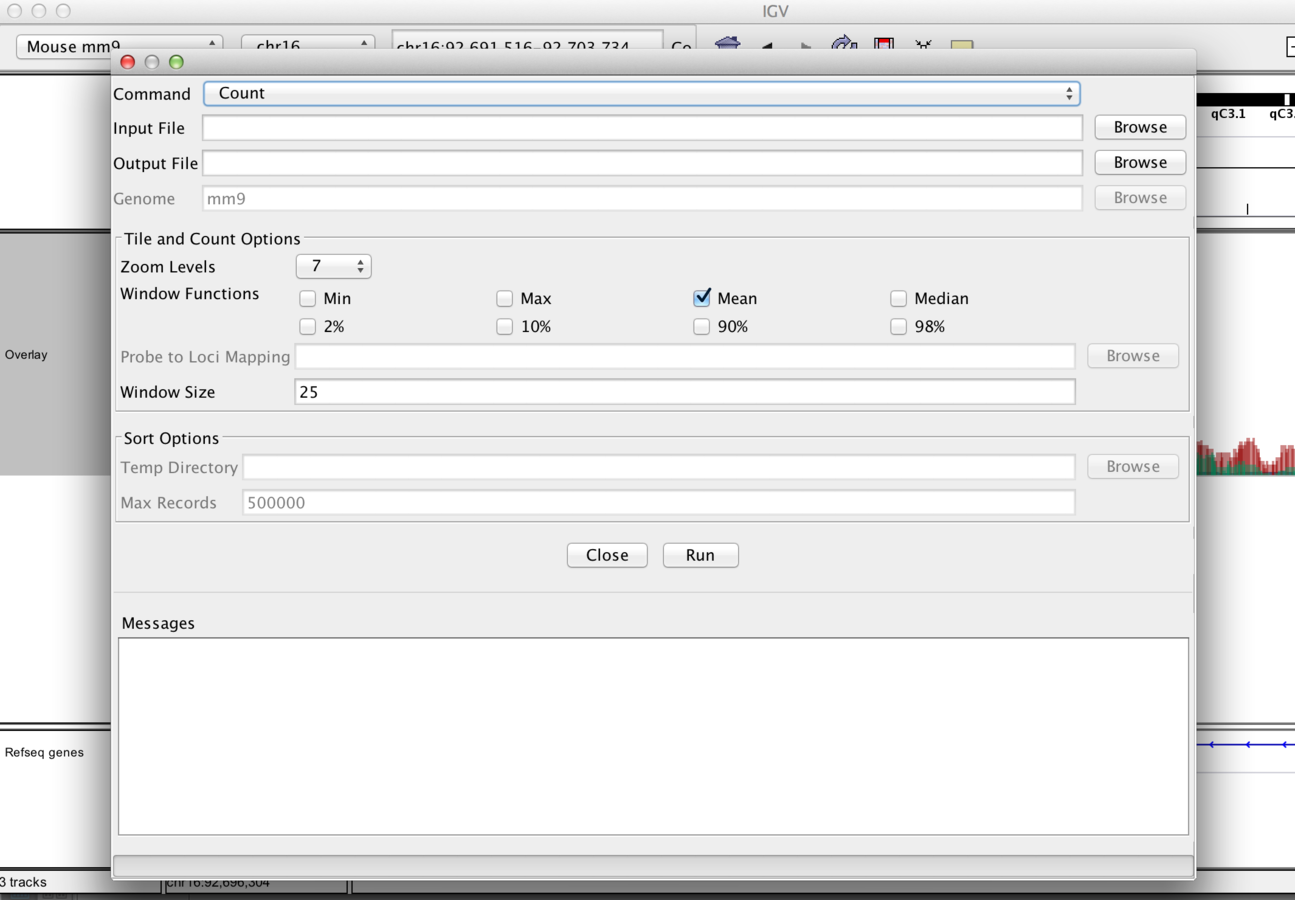
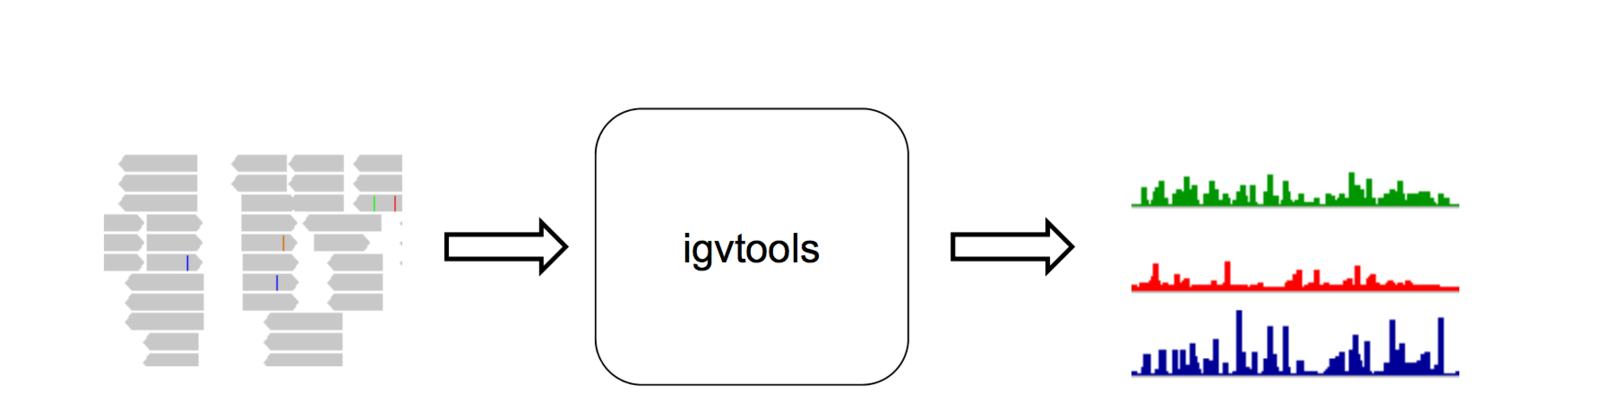
IGVtools
- IGVTools can be used to post-process genomics data.
- Includes indexing, sorting and genome graph creation.
Where to get help?
- http://www.broadinstitute.org/igv/UserGuide
- https://groups.google.com/forum/#!forum/igv-help
IGV
By tom carroll