Tools for a Reproducible Workflow for ChIP-seq QC and Visualisation.
Thomas Carroll
Head of Bioinformatics
MRC Clinical Sciences Centre
Overview
- Higher output more complex hypotheses.
- New challenges for:
- Quality control
- Visualisation
- Dynamics of epigenetic states.
- Reproducibility and reporting.
Then
- Limited sequence depth.
- Shorter reads.
- Developing protocols.
- Single sample studies.
- Non standardised toolset.
- ChIP-seq != RNA-seq
Now
- Greater depths per lane.
- Established protocols
- Multiplexing technologies - Sample replication.
- Advanced toolsets
- Borrowing of analysis techniques between data-types
High-throughput Sequencing technologies
Bigger studies require large scale quality control
- ChIP-seq has many sources of noise
- Inefficient or non-specific antibodies.
- Artefact signals.
- Signal complexity.
- Requirement for methods to assess quality within sample groups and across large experiments.
How to assess what is useful.
- Encode and others have established metrics of ChIP-seq quality.
- SPP/phantomQualityTools.
- HTSeqtools.
- Use and interpretation of these metrics varies with ChIP type.
- Such metrics may be overfitted to these big studies and dependent on the standardised processing protocols applied.
Epigenetic's data QC study
- > 500 datasets of ChIP-seq for transcription factor and epigenetic marks.
- Evaluate quality control metrics under different conditions.
- Identify importance/redundancy of QC metrics.
- Establish effect of processing on QC metrics
Carroll et al Impact of artifact removal on ChIP quality metrics in ChIP-seq and ChIP-exo data. Front Genet April 2014.
Blacklisted Regions
- Identified by Peter Park.
- DAC list created by Anshul Kundaje for Encode.
- Species specific regions of consistent ultra high signal
- Contains repeat regions and genomic expansion.

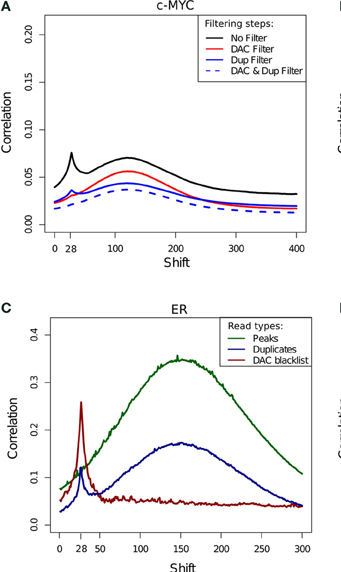
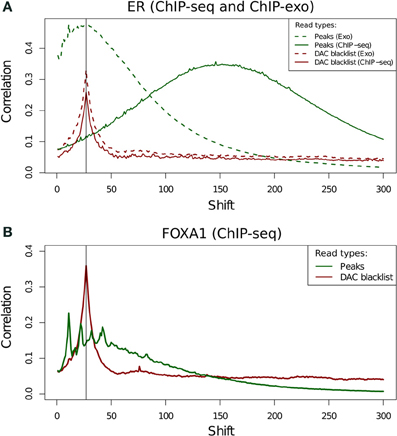
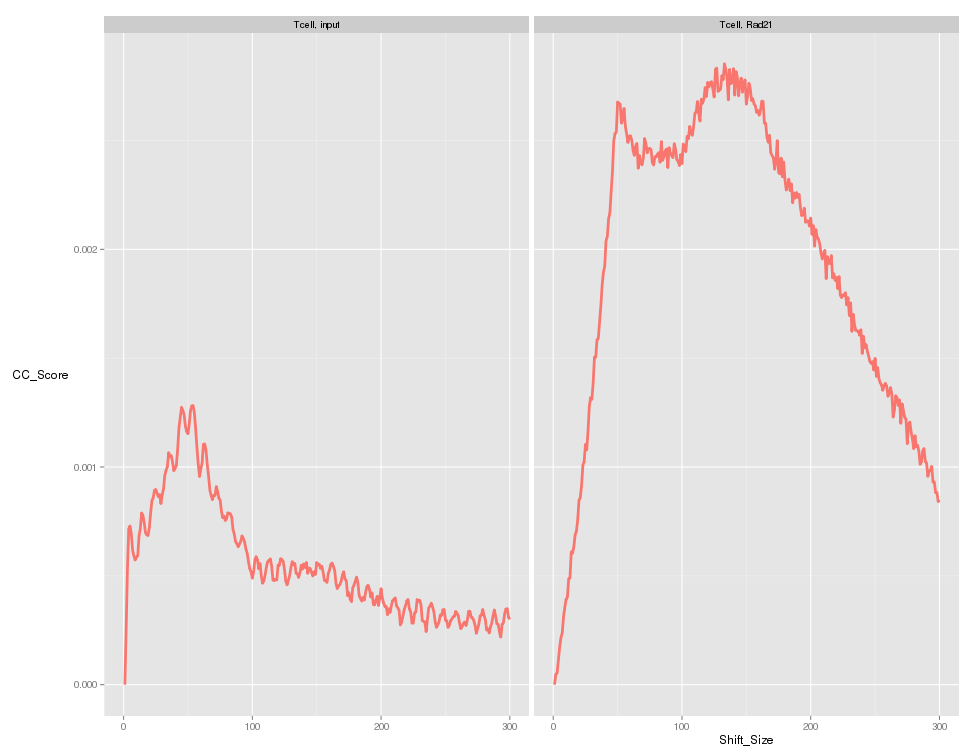
Blacklisted Regions and the "Phantom Peak"
- Fragment length peak indicates ChIP signal strength.
- "Phantom peak" often identified in cross-correlation analysis at read length.
- Signal from blacklisted regions contribute solely to this peak
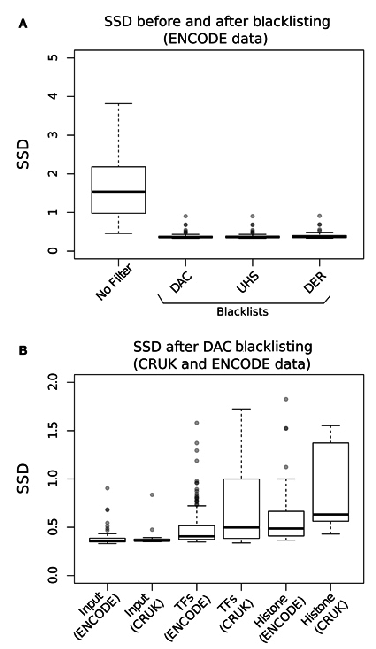
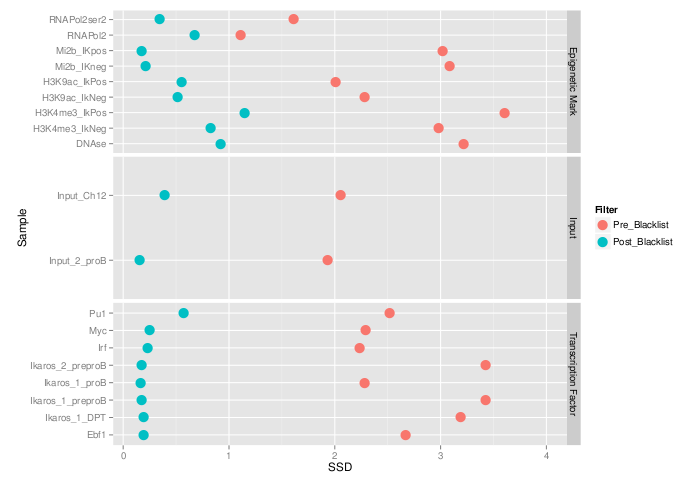
Measures of inequality of coverage (SSD)
- Standardised Standard Deviation (SSD) of ChIP-signal.
- Measure of overall "peakiness".
- More suited for longer marks
- SSD strongly influenced by blacklisted regions.
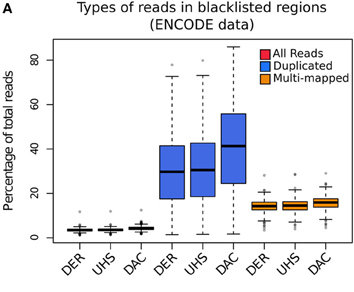
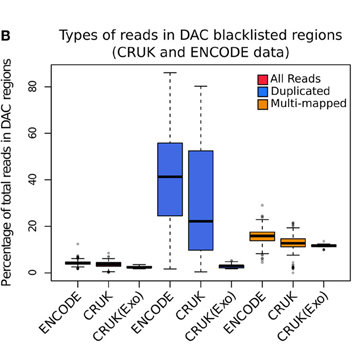
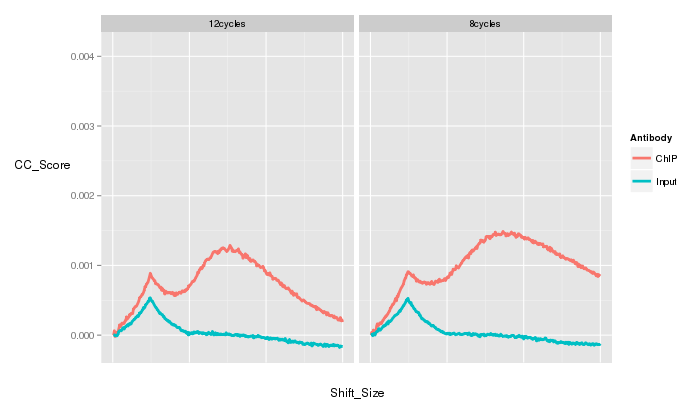
Library complexity and duplication levels
- Library complexity often assessed by duplication rate.
- Artefact duplicates often overestimated.
- Duplicates may arise from high efficiency and/or high depth.
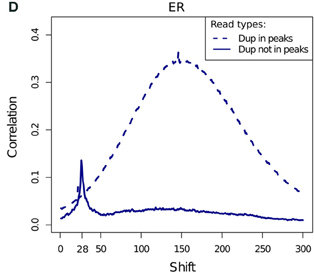
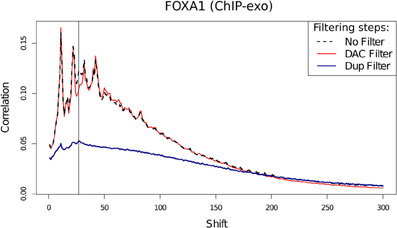
ChIP-exo
- ChIP-exo offers higher resolution and greater efficiency.
- Reduced "Blacklisted" signal.
- Higher duplication in peaks.
- Cross-correlation profiles require intrepretation.
ChIPQC package
High-throughput QC of epigenetics data.
- Implemented QC learned from study.
- Designed for work on large experiments with multiple groups.
- Implemented in R and Bioconductor for ease on installation, implementation and integration with reporting
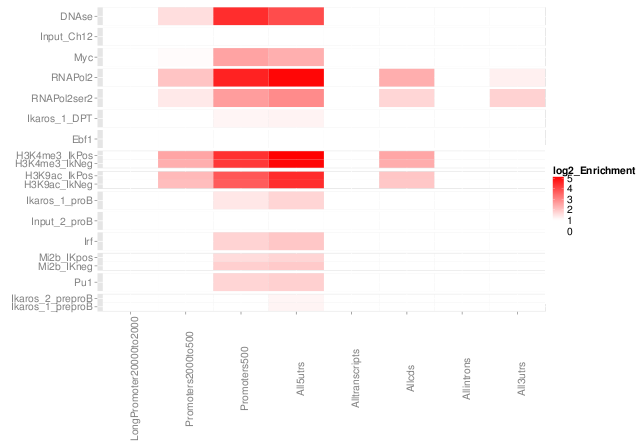
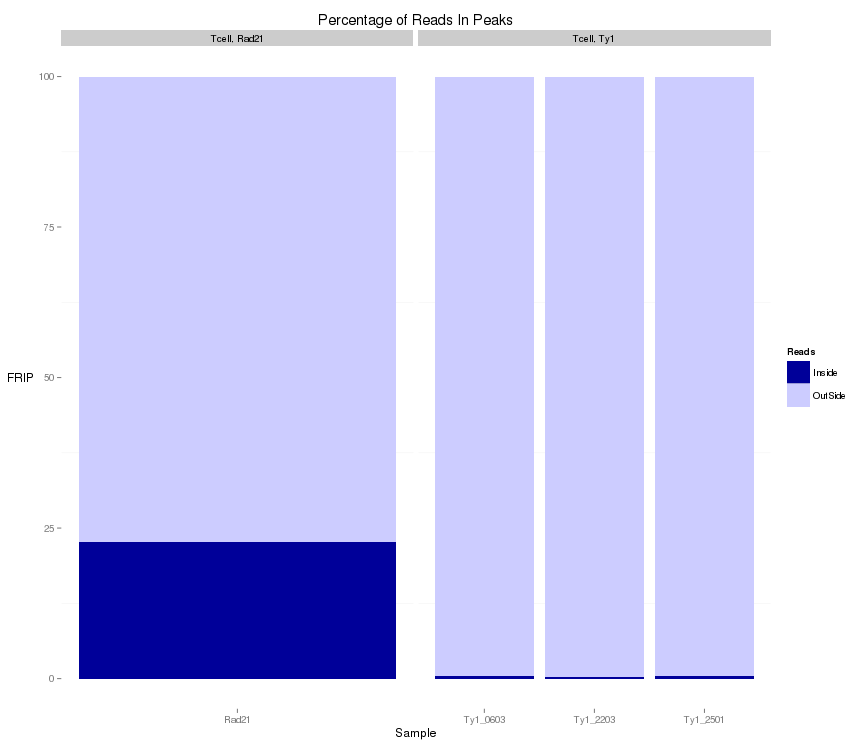
Examples ChIP-QC
- Evaluate +/- read clustering around peaks.
- Contribution of artifact signal.
- Distribution of ChIP signal across genome.
QC from low depth
(MiSeq)
- Speed of Miseq's run allows for rapid evaluation of ChIP prior to large scale sequencing.
- Direct comparison of Hiseq vs Miseq demonstrates its ability to evaluate ChIP quality
~ 1 Million reads
Useful links
Good papers to read.
- Timothy Bailey - Practical Guidelines for the Comprehensive Analysis of ChIP-seq Data
- Encode - Large-Scale Quality Analysis of Published ChIP-seq Data
- Shirley Liu - Systematic evaluation of factors influencing ChIP-seq fidelity
- Carroll and Liang - Impact of artifact removal on ChIP quality metrics in ChIP-seq and ChIP-exo data
ChIP-QC courses
- https://www.bioconductor.org/help/course-materials/2014/BioC2014/Bioc2014_ChIPQC_Practical.pdf
-
https://www.bioconductor.org/help/course-materials/2014/BioC2014/ChIPQC_Presentation.pdf
Visualisation of data
- Essential step is to look at your data.
- Evaluate results in their genomic context
- Identify patterns and artefact regions.
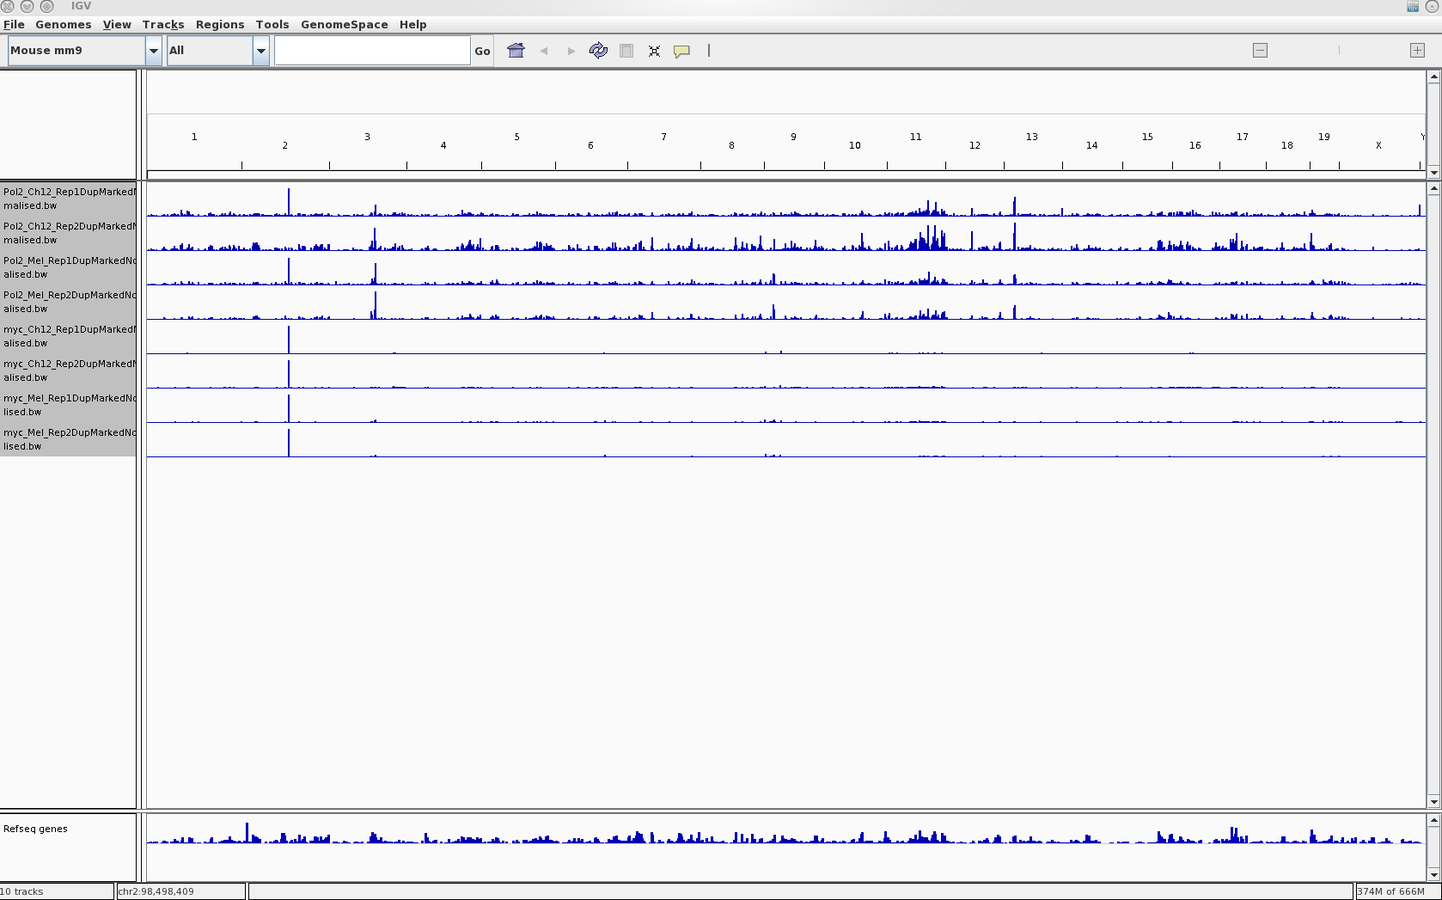
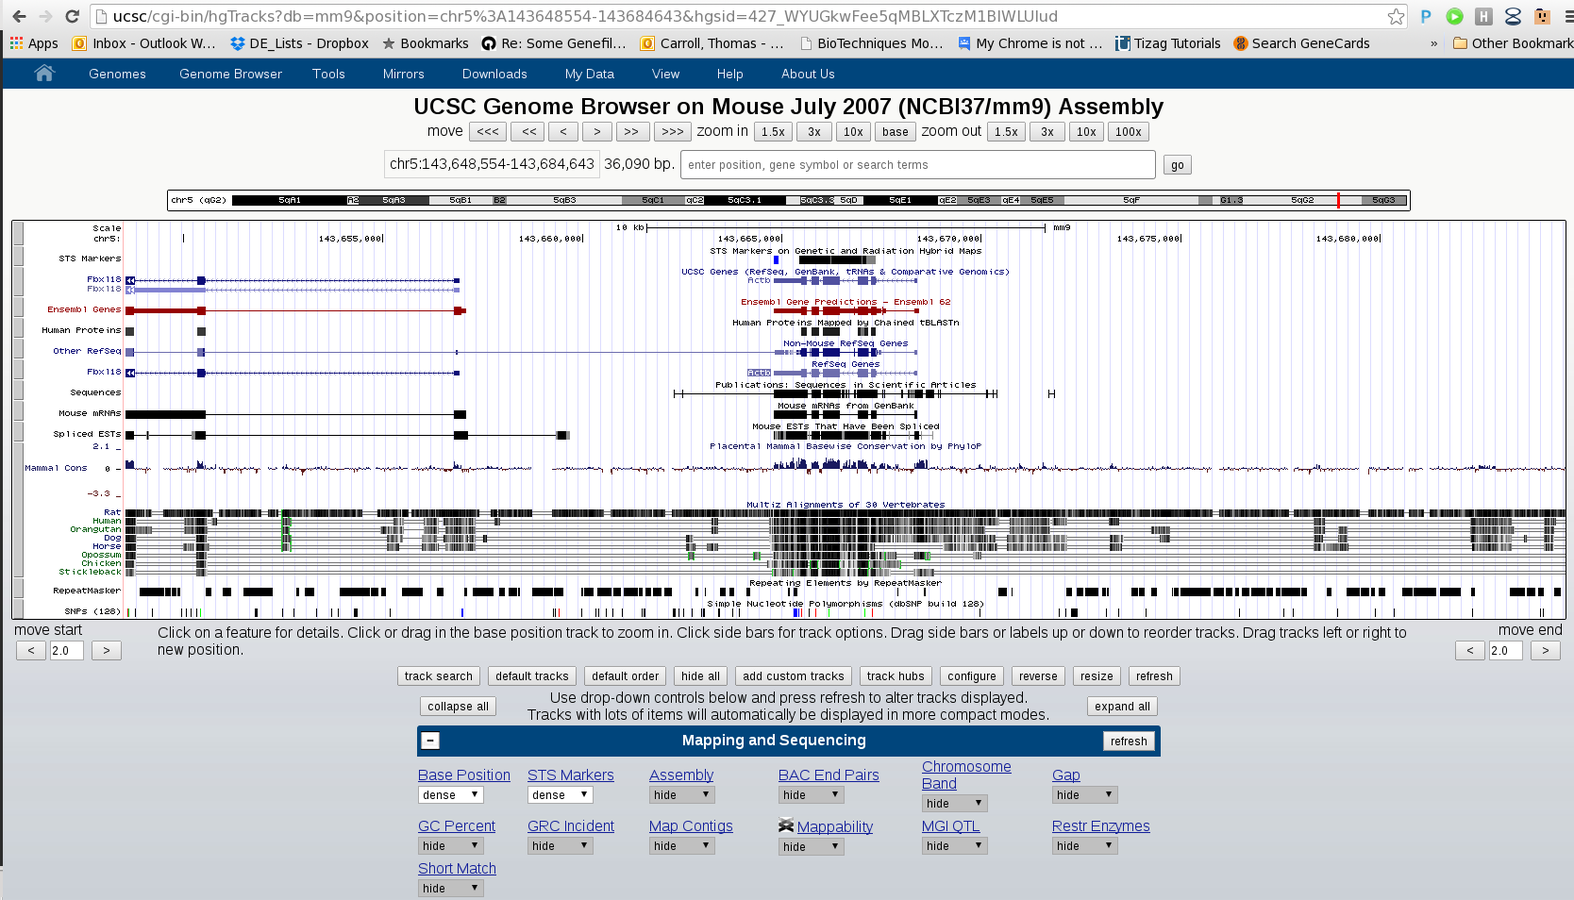
Genome Browsing
- Genome Browsers present a linear representation of genomics data.
- Allow for integration of multiple data-types as well as inclusion of both the user's and public datasets.
- Popular browsers include UCSC (server) and IGV (local).
Integration with genome browsers
- Trackhubs and Sample information files may be created and manually curated.
- For bigger studies, the organisation of tracks in a genome browser is not a trivial task.
- Evaluation of results requires exporting, conversion and potentially uploading to FTPs.
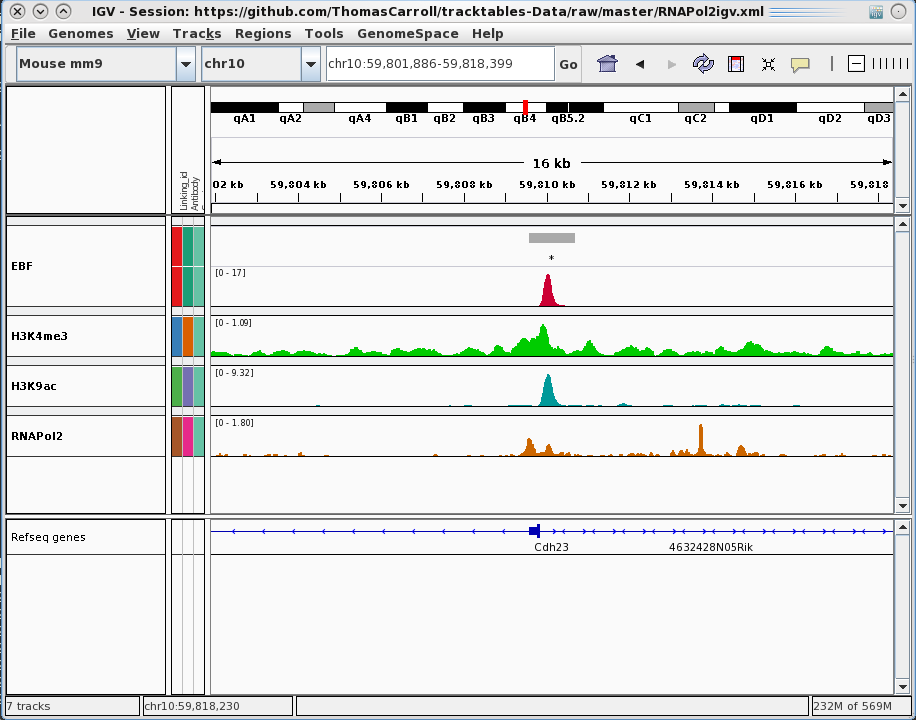
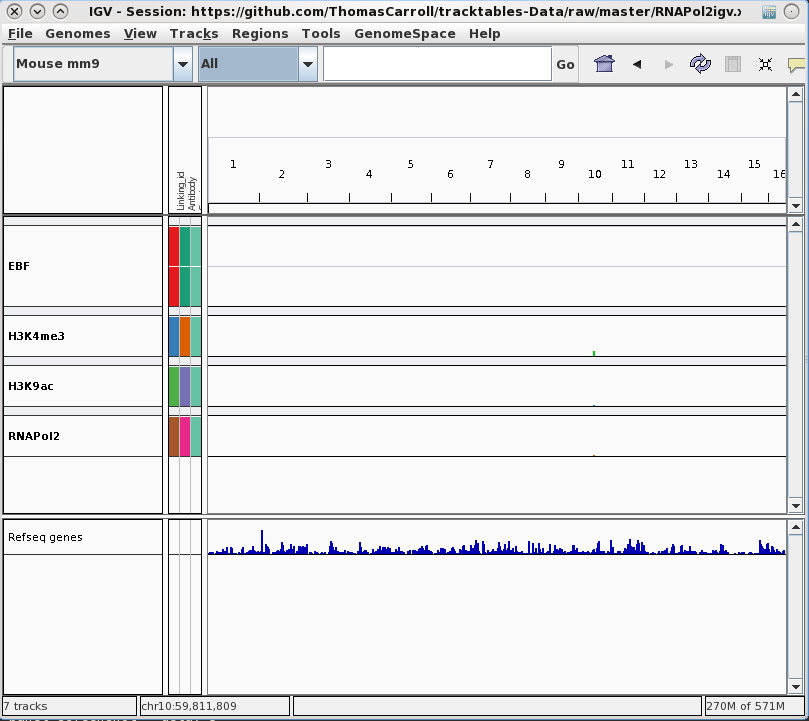
tracktables package.
Generation and integration of R objects and dynamic HTML reports with the IGV genome browser.
- Allow for rapid presentation of high-throughput sequencing results in the IGV genome browser.
- Produce experiment focused IGV-linked HTML reports.
- Cast R objects into HTML tables with links to genomic locations.
- Integration with pre-existing reporting tools reinforcing reproducible research.
Building Experiment Reports
Rapid prototyping by visualisation
- Cast R/Bioconductor objects into HTML tables.
- Allows user to evaluate results in genomic context.
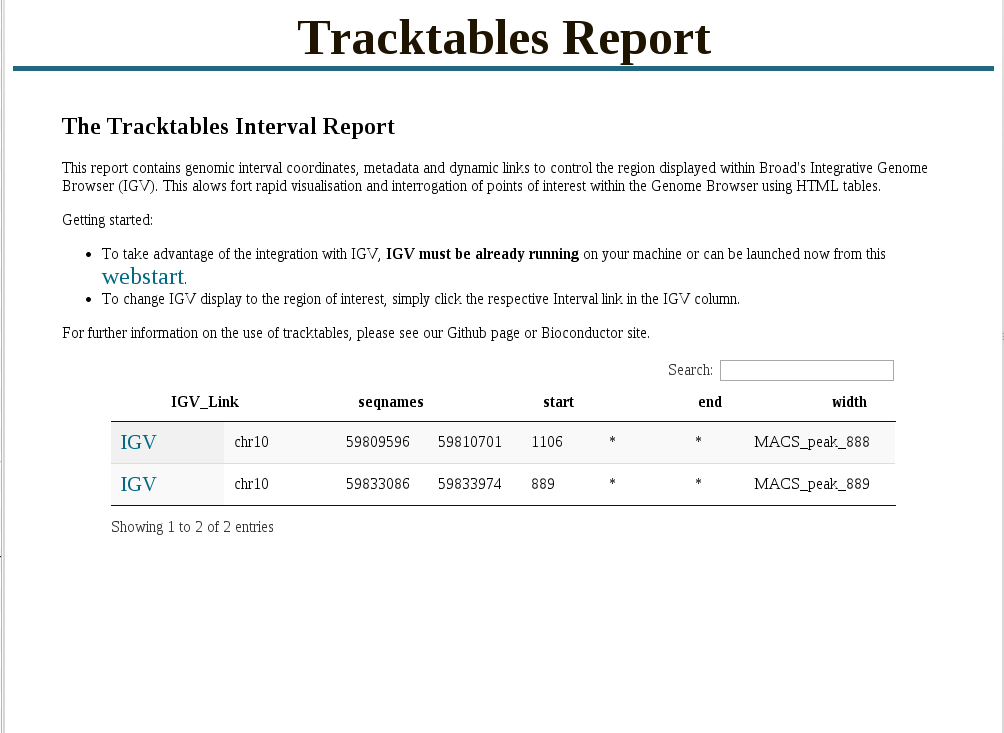
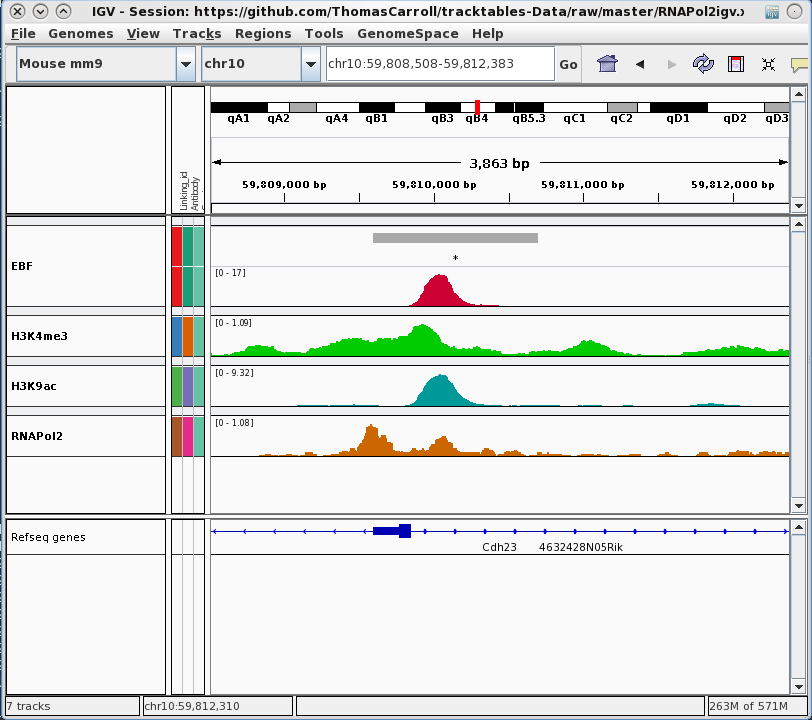
Interval report
IGV tips.
- User guide
- http://www.broadinstitute.org/igv/UserGuide
- MRC CSC courses -
- File formats - http://mrccsc.github.io/genomicFormats.html#/
- IGV - http://mrccsc.github.io/igvPres.html#/
Dynamics of epigenetic states
- With the advent of multiplexing technologies
- Greater number of sample groups
- Higher replicate numbers
- More complex hypotheses.
- From simple epigenetic mapping -> Identifying significant changes in epigenetic states.
Borrowing RNA-seq methods for ChIP-seq data
- Differential affinity/binding of epigenetic marks or transciption factors.
- Methods implemented in RNA-seq now being used in ChIP-seq (DEseq2/limma/EdgeR/Diffbind)
- ChIPQC integrates with Diffbind.
Visualising dynamics of epigenomic states over genomic interval sets
- RNA-seq visualisation methods don't cover ChIP-seq
- Require tools to investigate shapes of signal.
- Simple tools designed for small sample numbers.
soGGi package
Summarising Over Grouped Genomic Intervals
- Accepts multiple input types (BAMs/bigWigs/Motifs) to generate profiles.
- Leverages GGplot2 to enable intuitive plotting grammar
- Implements normalisation procedures and arithmetic operations across profiles.
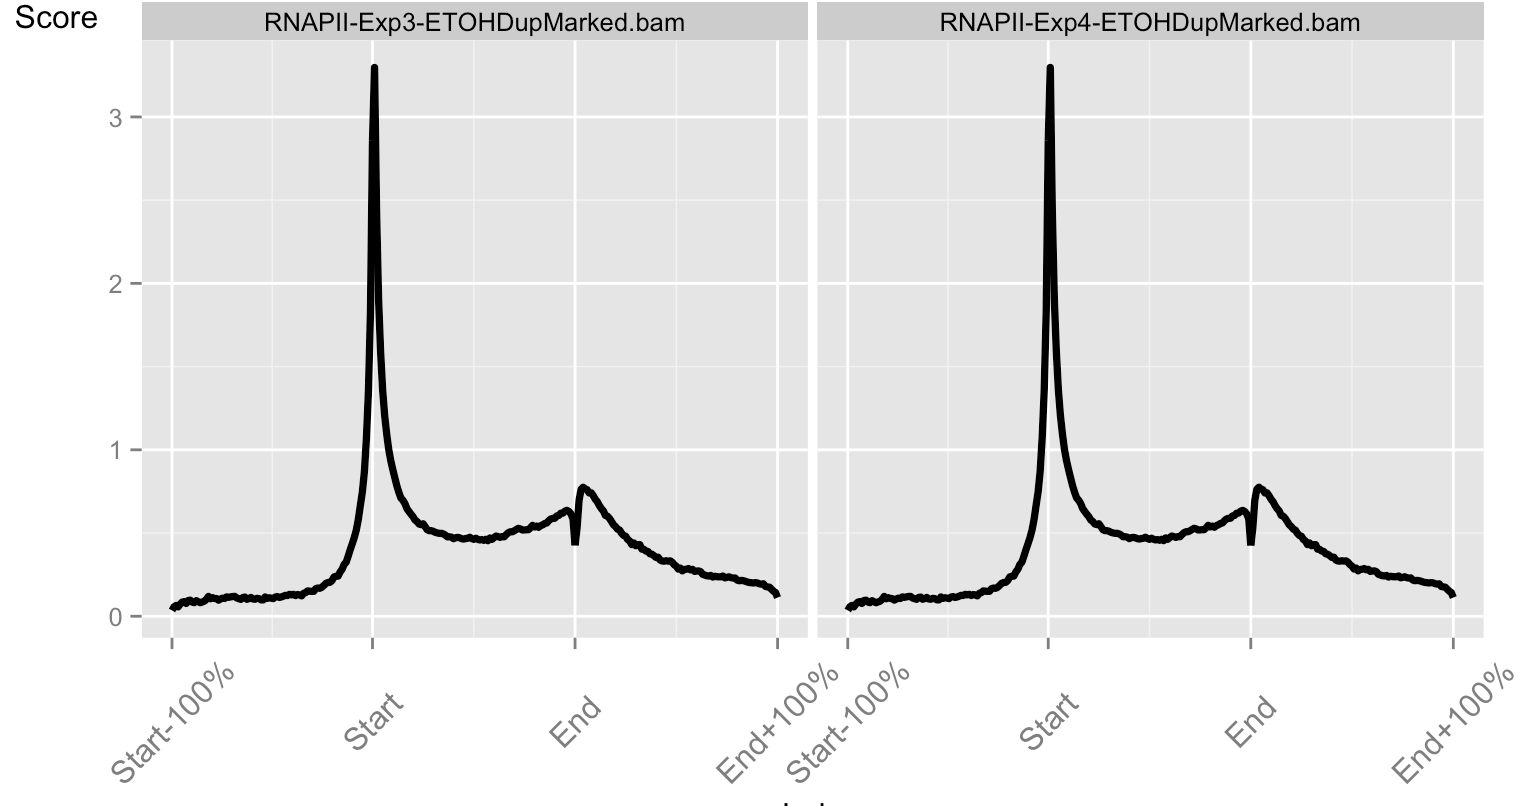
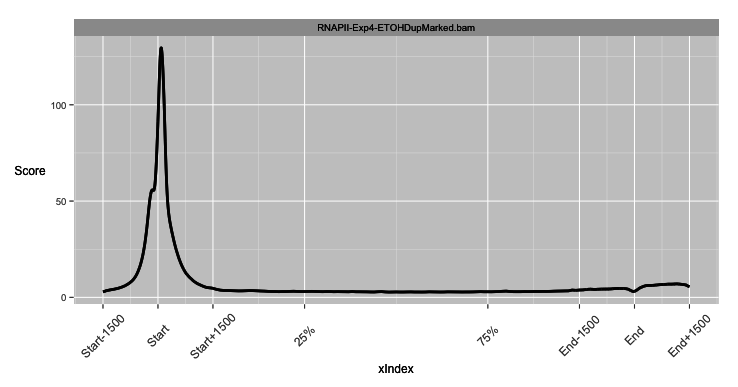
Profile types require different techniques
- soGGi allows for three types of plot
- Point (signal around a genomic location).
- Meta (signal over and around a genomic region normalised to that genomic regions length).
- Hybrid (Point plot over edges and Meta plot over central genomic region).
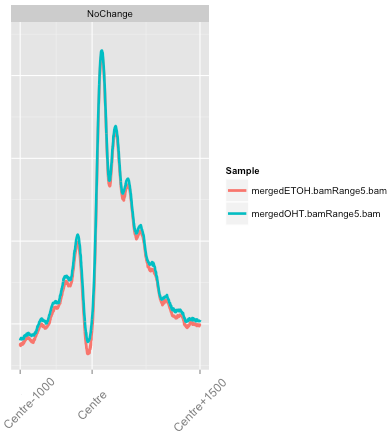
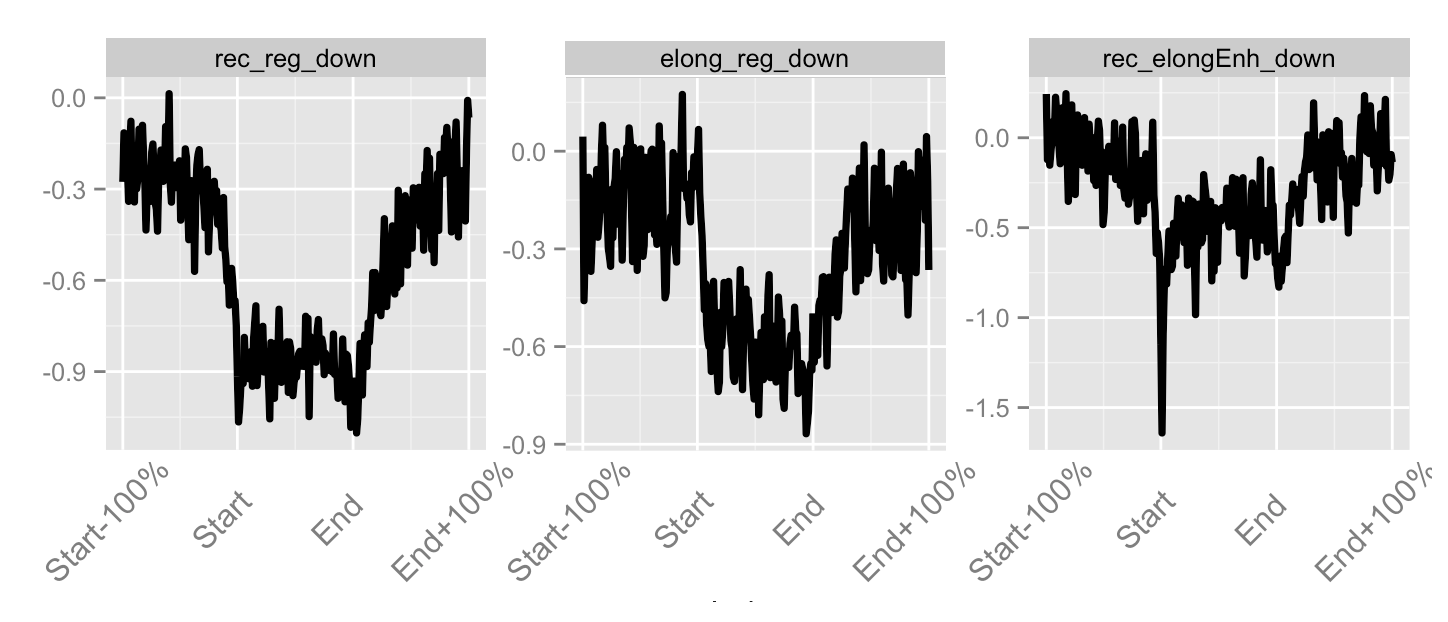
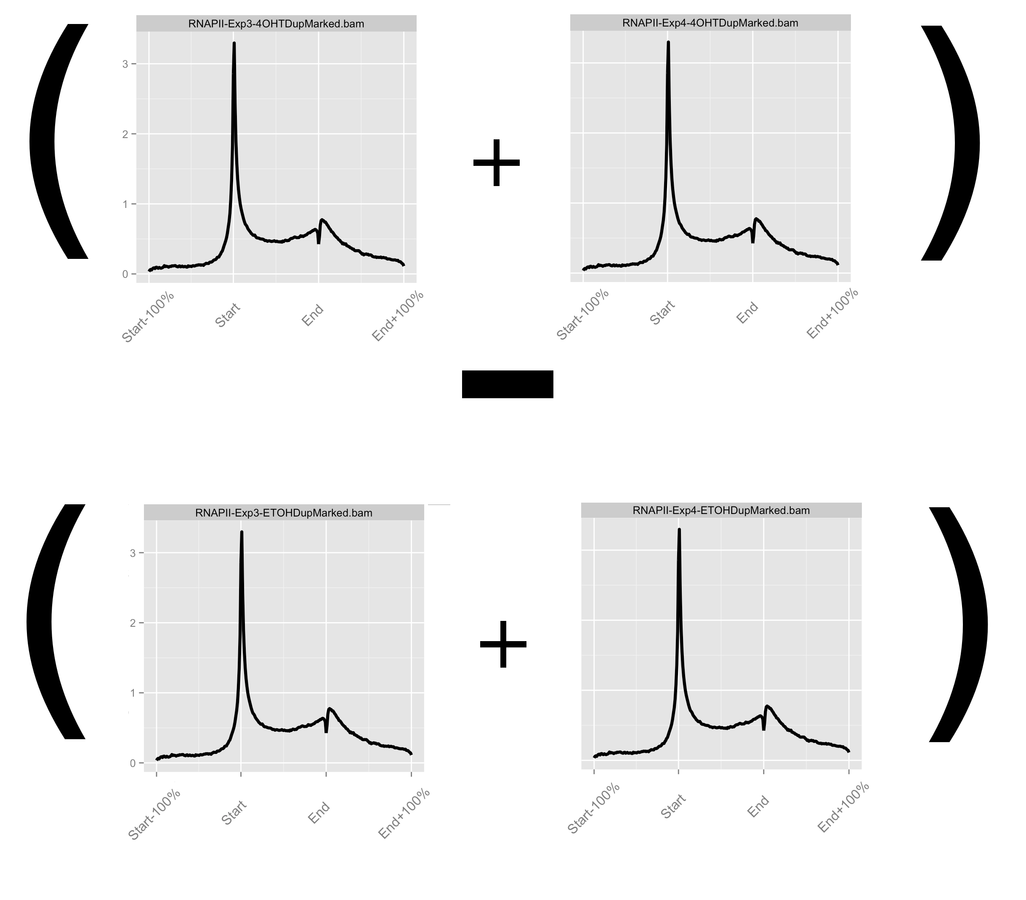
Integrating Arithmetic Operations
- Profiles can be further normalised and operated on to visualise hypotheses.
- Most common arithmetic operations and transformations can be applied between profiles.
Accounting for noise in ChIP-seq
- Technical variation in ChIP-seq is typically considered very high.
- Signal across artefact regions and duplication rates can be highly variable.
- Such defined sources of noise can inform the models used in differential binding analysis.
pol2Rates package (unpublished)
- Tools to evaluate quantitative changes in Pol2.
- Calculates normalisation factors from Pol2 signal distribution.
- Not available yet but hope for release before end of year
Comparison of Uncorrected vs Corrected
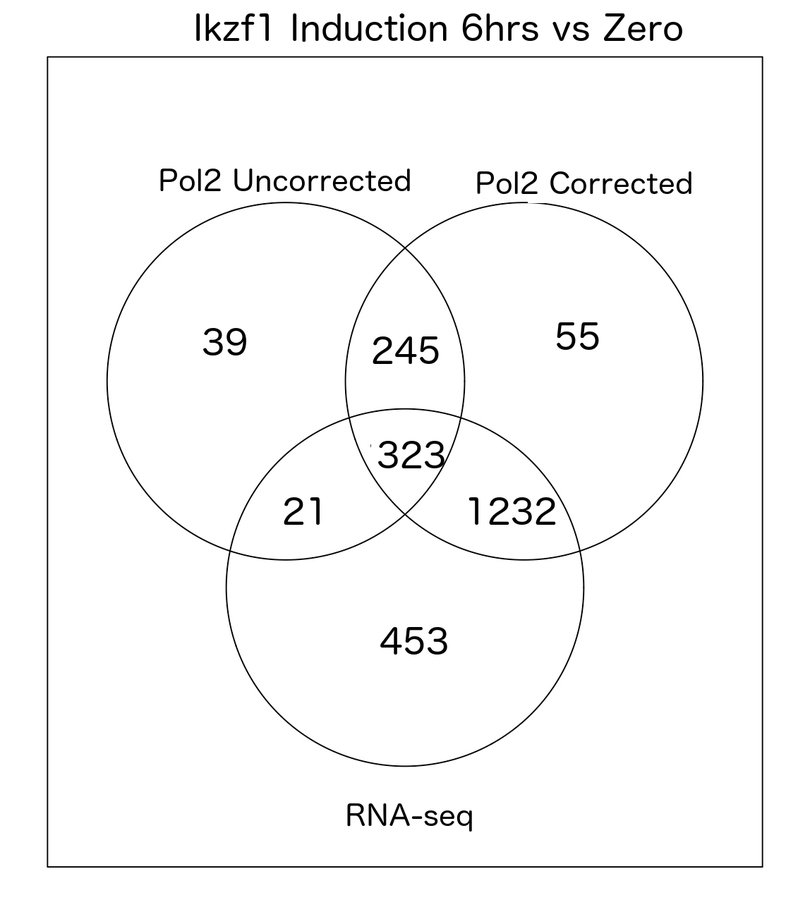
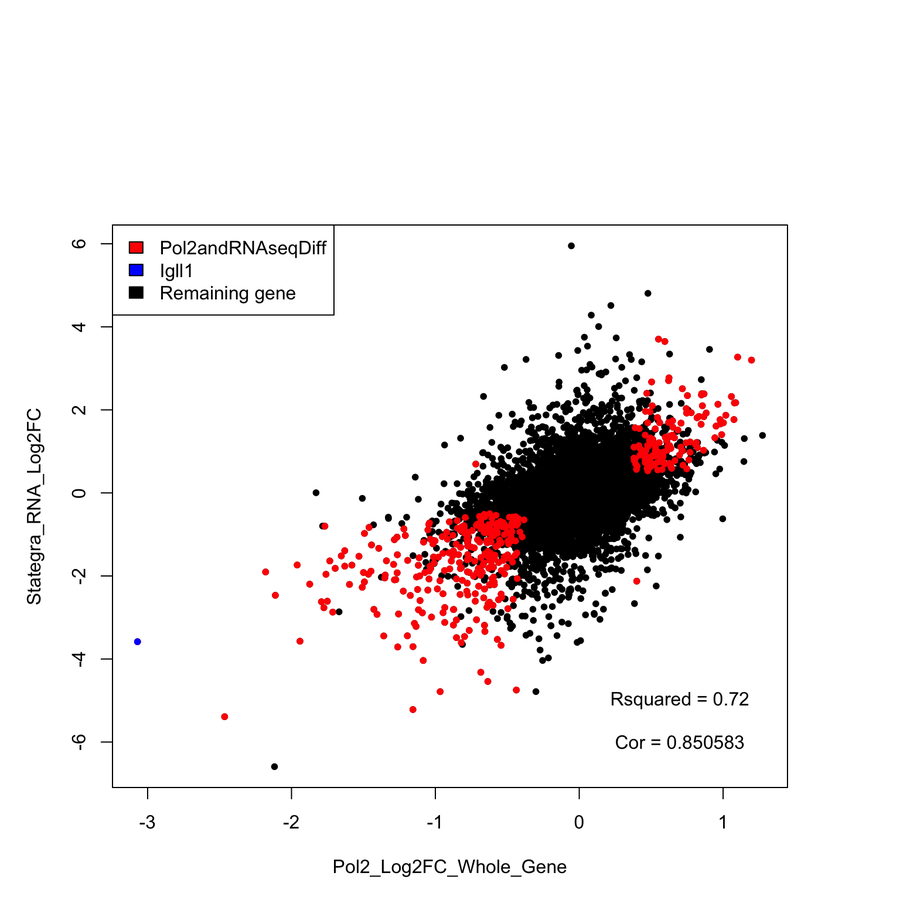
- Correction significantly improves correlation with RNA-seq data and known targets.
A Reproducible Workflow
- Created three packages to handle:
- Quality control
- Genome Browser integration.
- Visualisation of signal structure over genomic regions of interest.
- Integrated with R's rMarkdown (Reporting) and packrat (Version control) packages.
- Together allows for creation of customisable and reproducible reporting for ChIP-seq.
Acknowledgements
MRC Clinical Sciences Centre
- Dr Ziwei Liang
- Mr Gopuraja Dharmalingham
- Mr Sanjay Khadayate
- Dr Yi-Fang Wang
- Professor Matthias Merkenschlager
CRUK Cambridge Institute
- Dr Rafik Salama
- Dr Ines de Santiago
- Dr Rory Sark


References
- Carroll et al Impact of artifact removal on ChIP quality metrics in ChIP-seq and ChIP-exo data. Front Genet. April 2014.
-
Bioconductor (http://bioconductor.org/)
- ChIPQC Bioconductor 2.13 (May 2014)
- tracktables Bioconductor 2.14 (September 2014)
- soGGi Bioconductor 3.0 (May 2015)
Chip-seq analysis AX3
By tom carroll