


Trang Le
#math graduate. Postdoc fellow with Jason Moore.
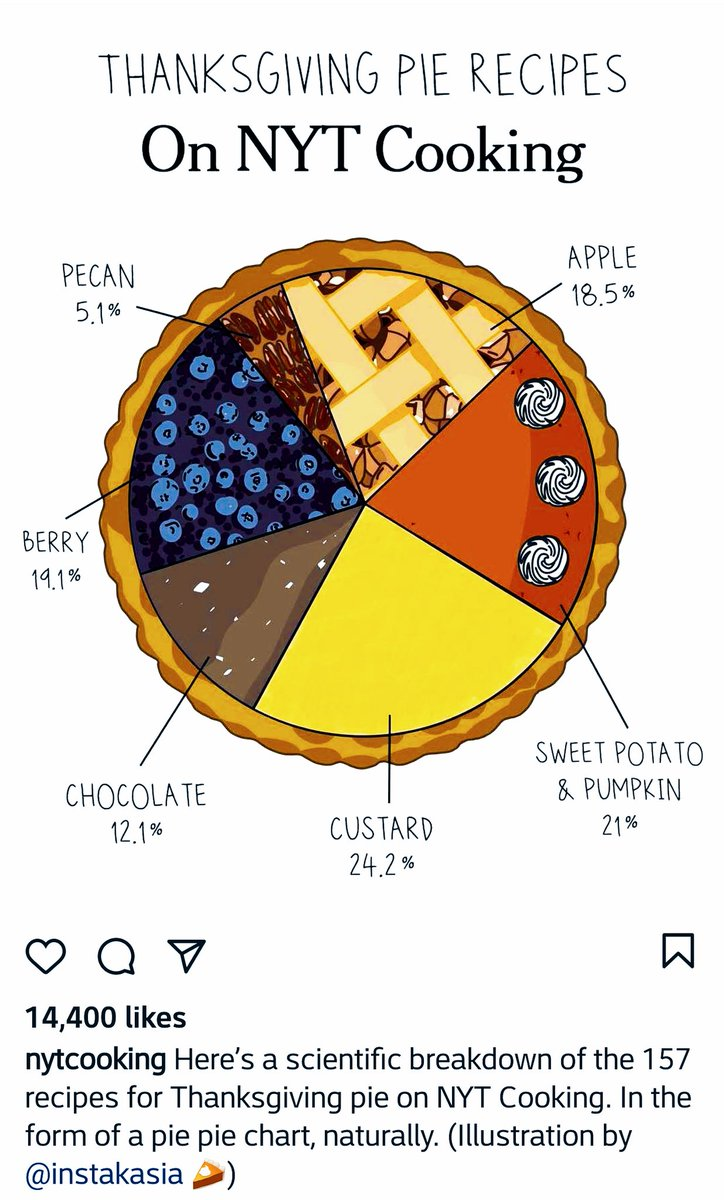
@instakasia
@tylermorganwall
@trang1618
I'm Trang Le.
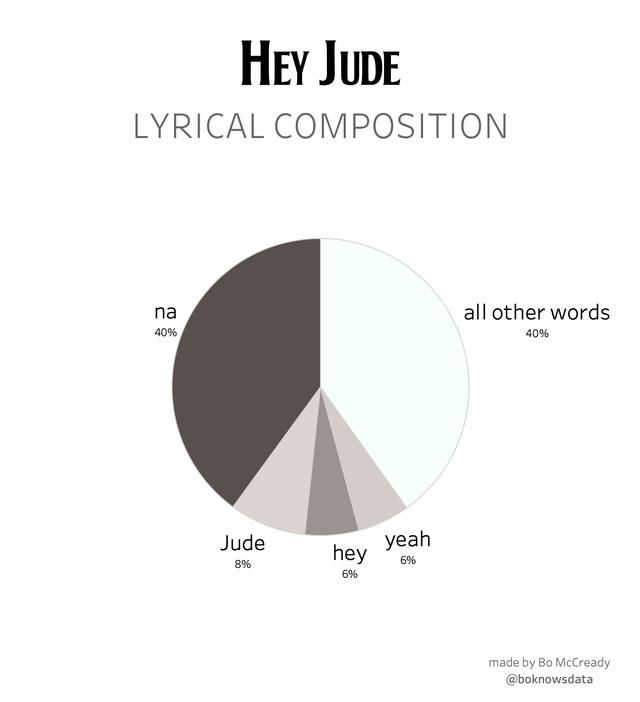
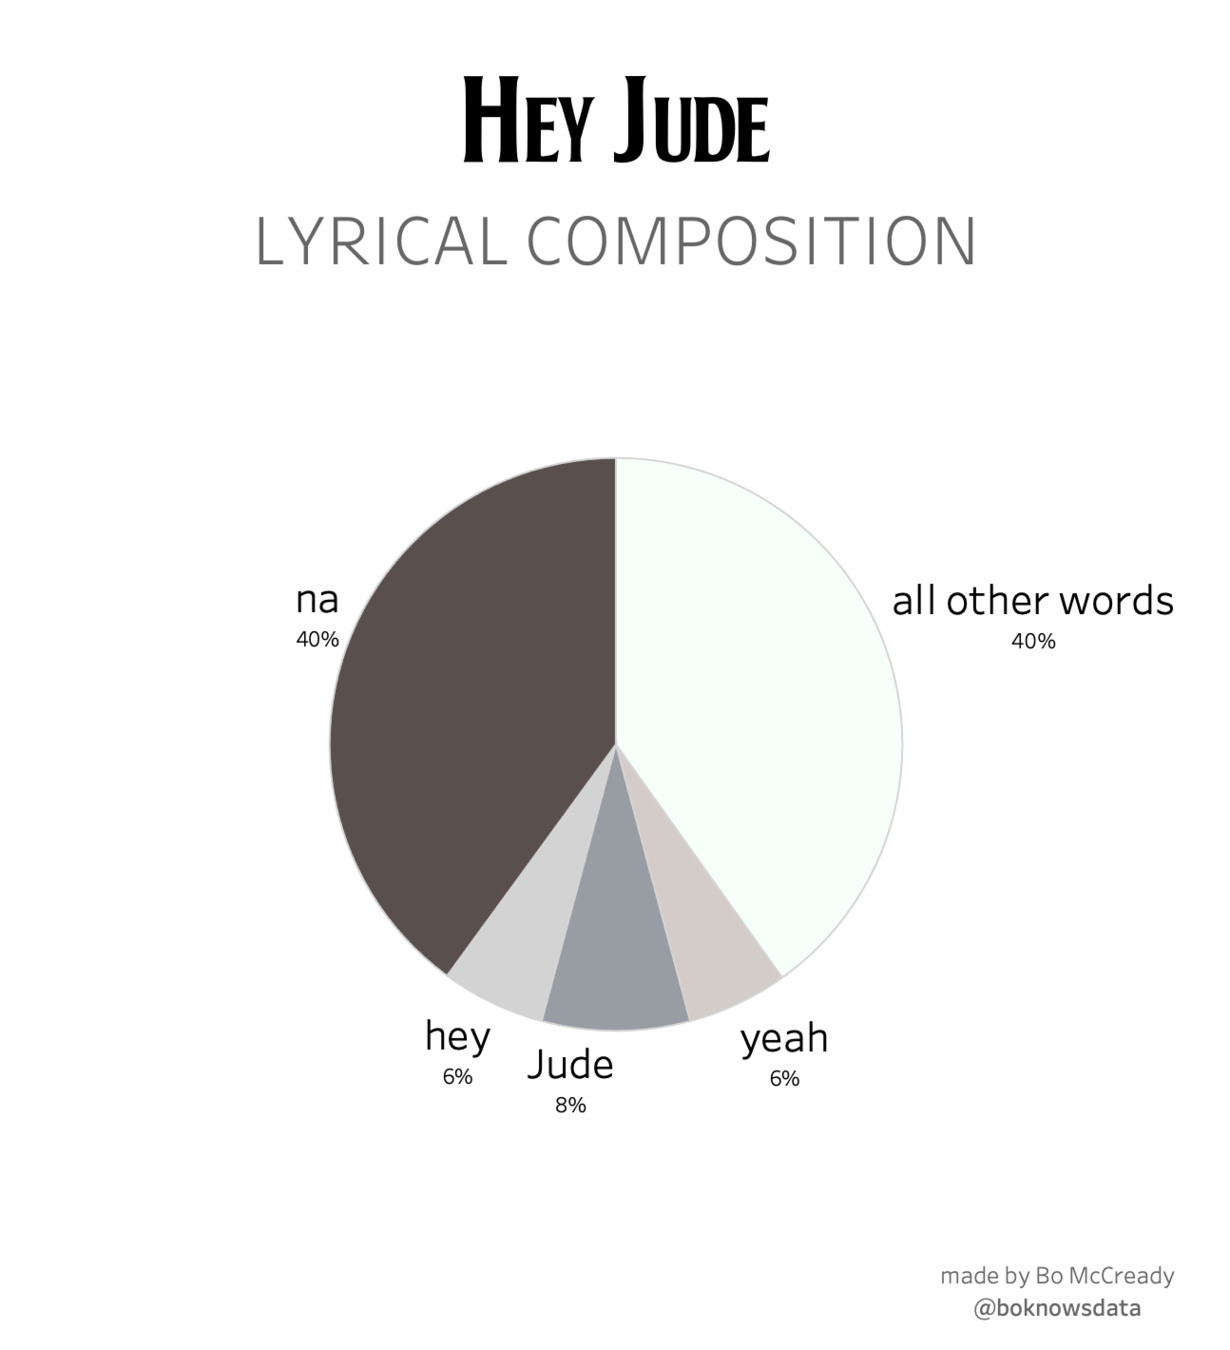
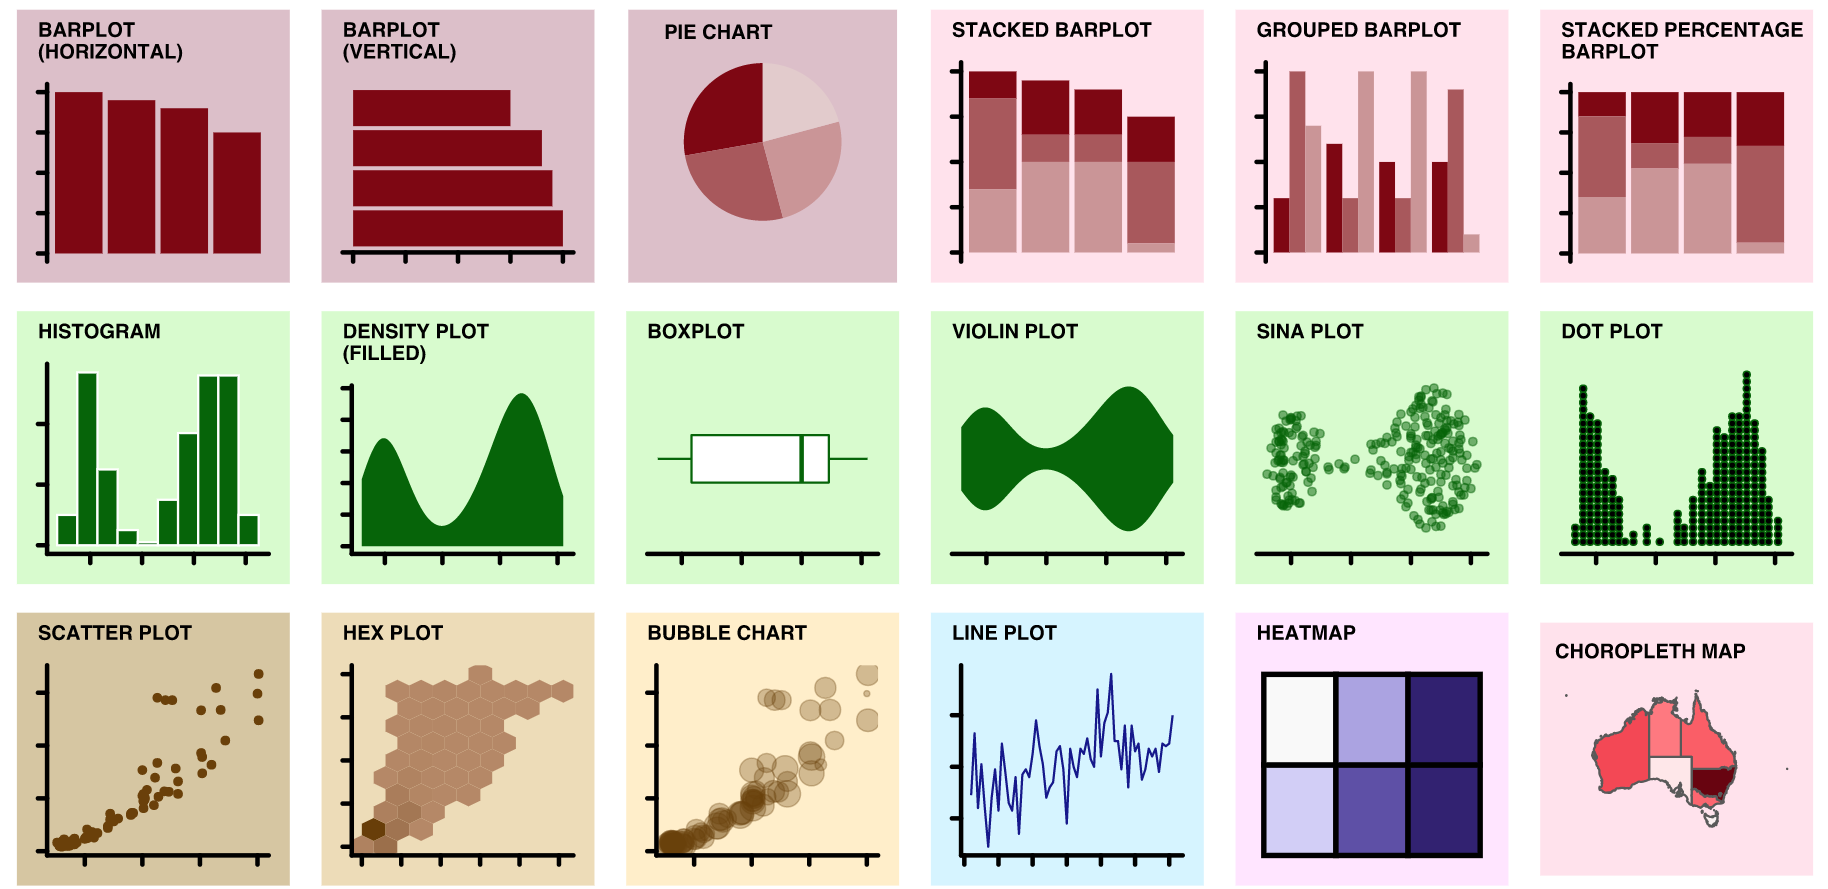
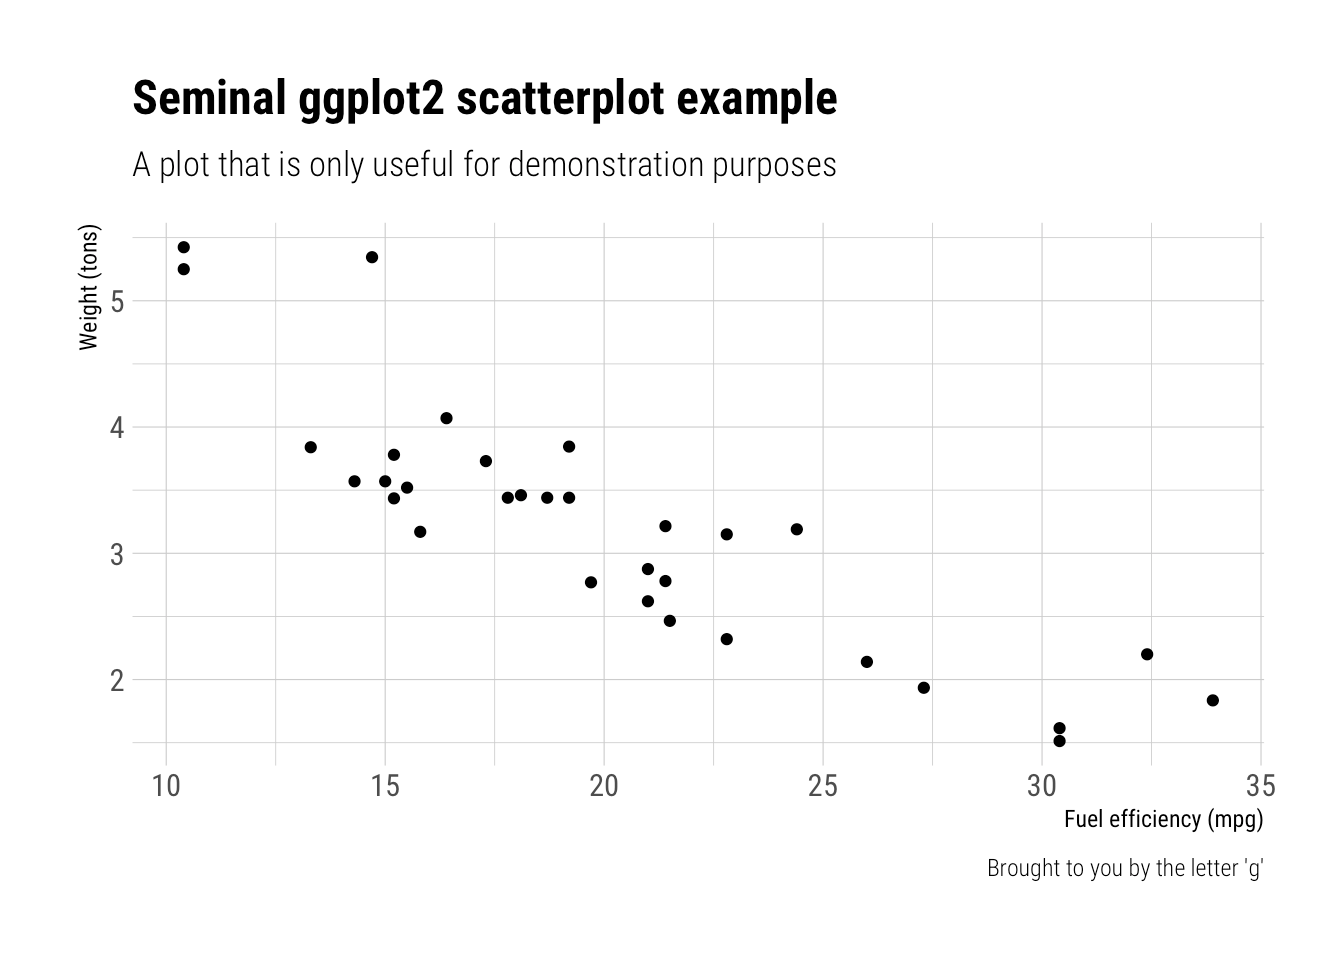
I have made some (very) bad charts.
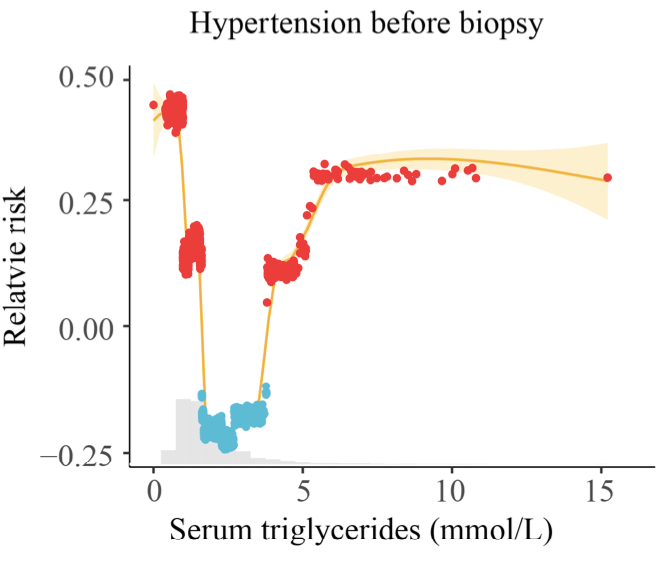
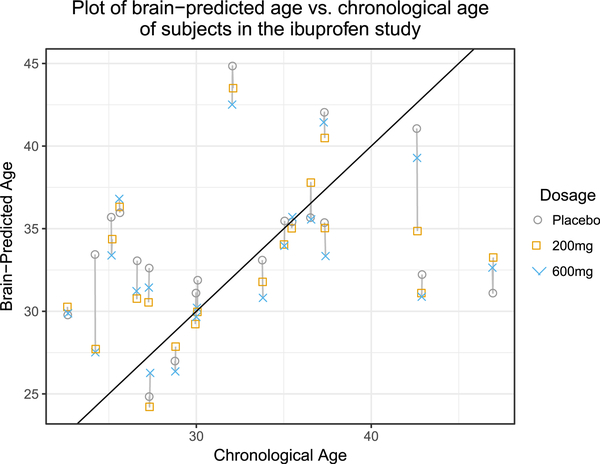
Risk of hypertension
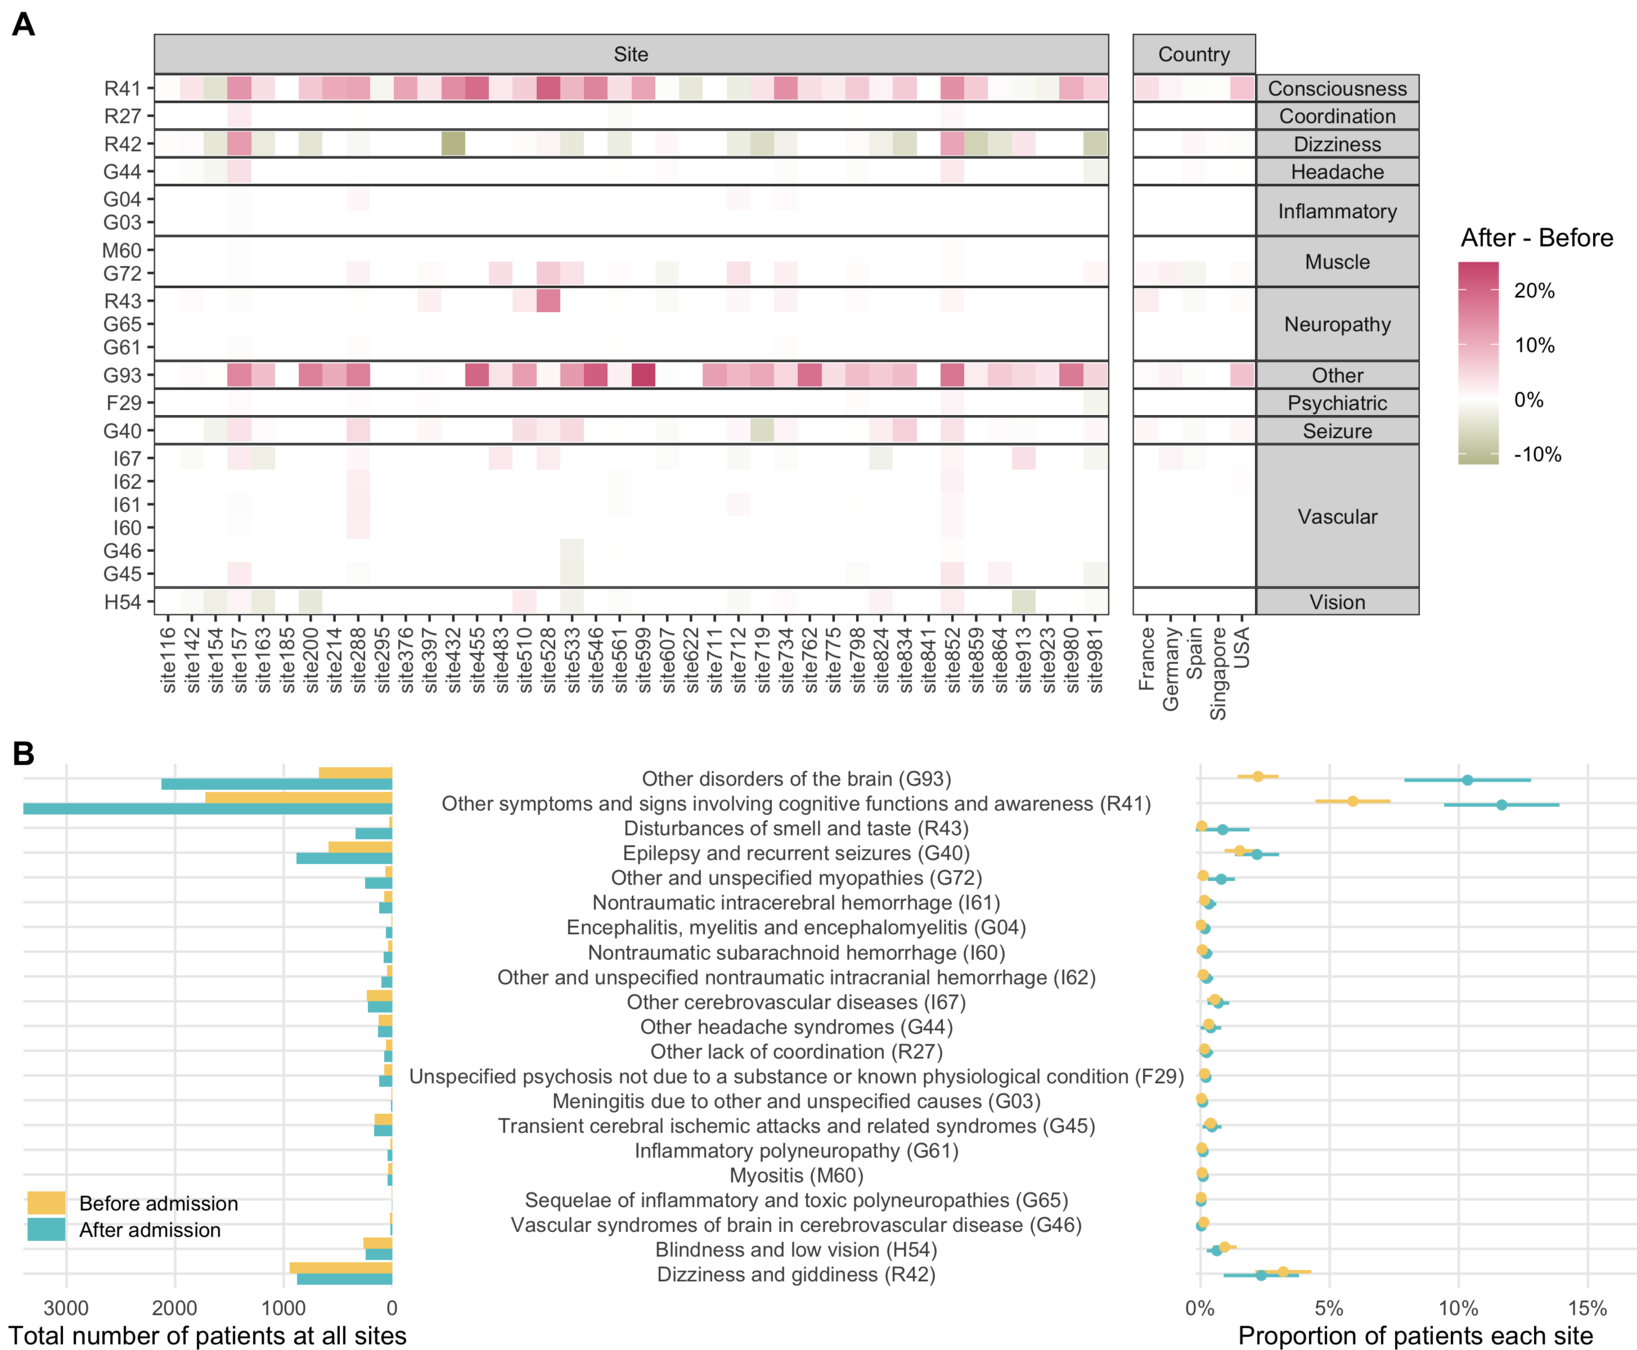
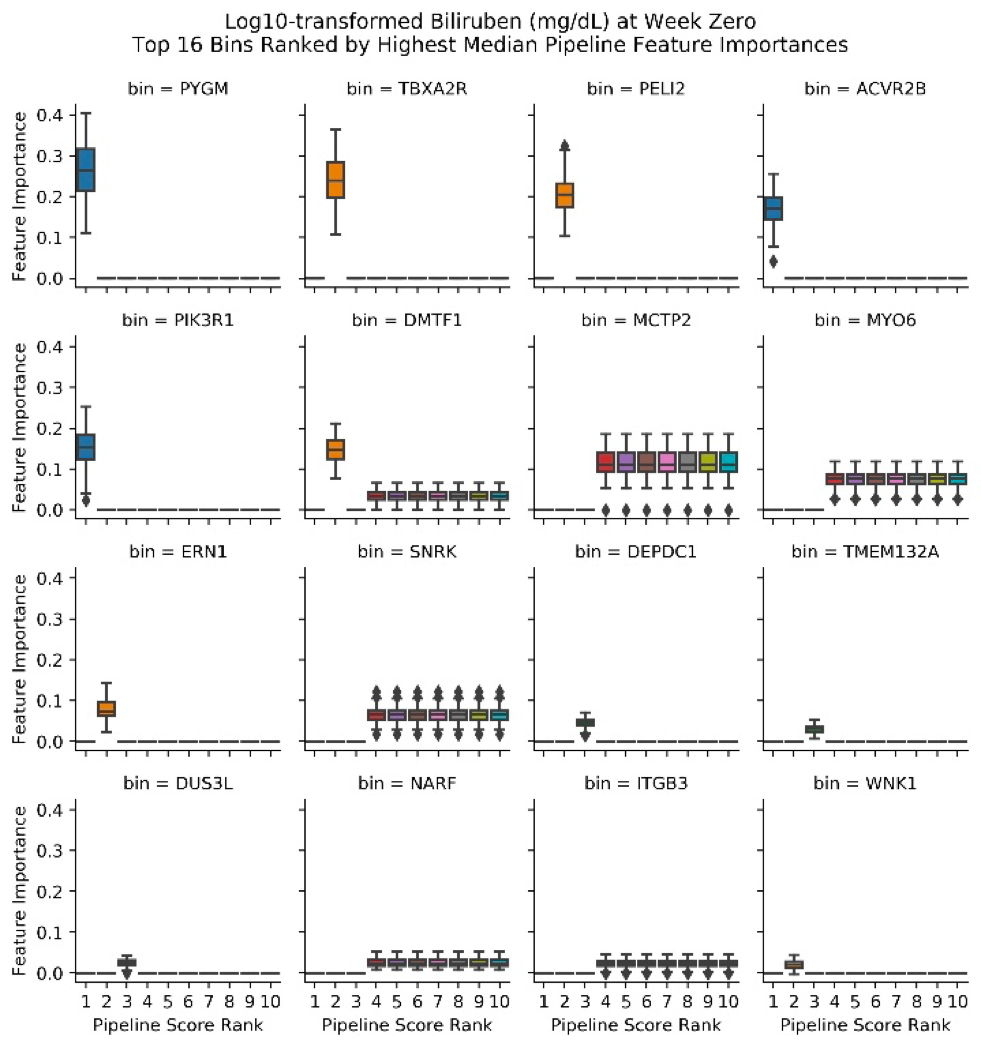
facet_grid(
  cols = vars(...),
  scales = 'free',
  space = 'free')
scales = 'free'
space = 'free'
"strips"
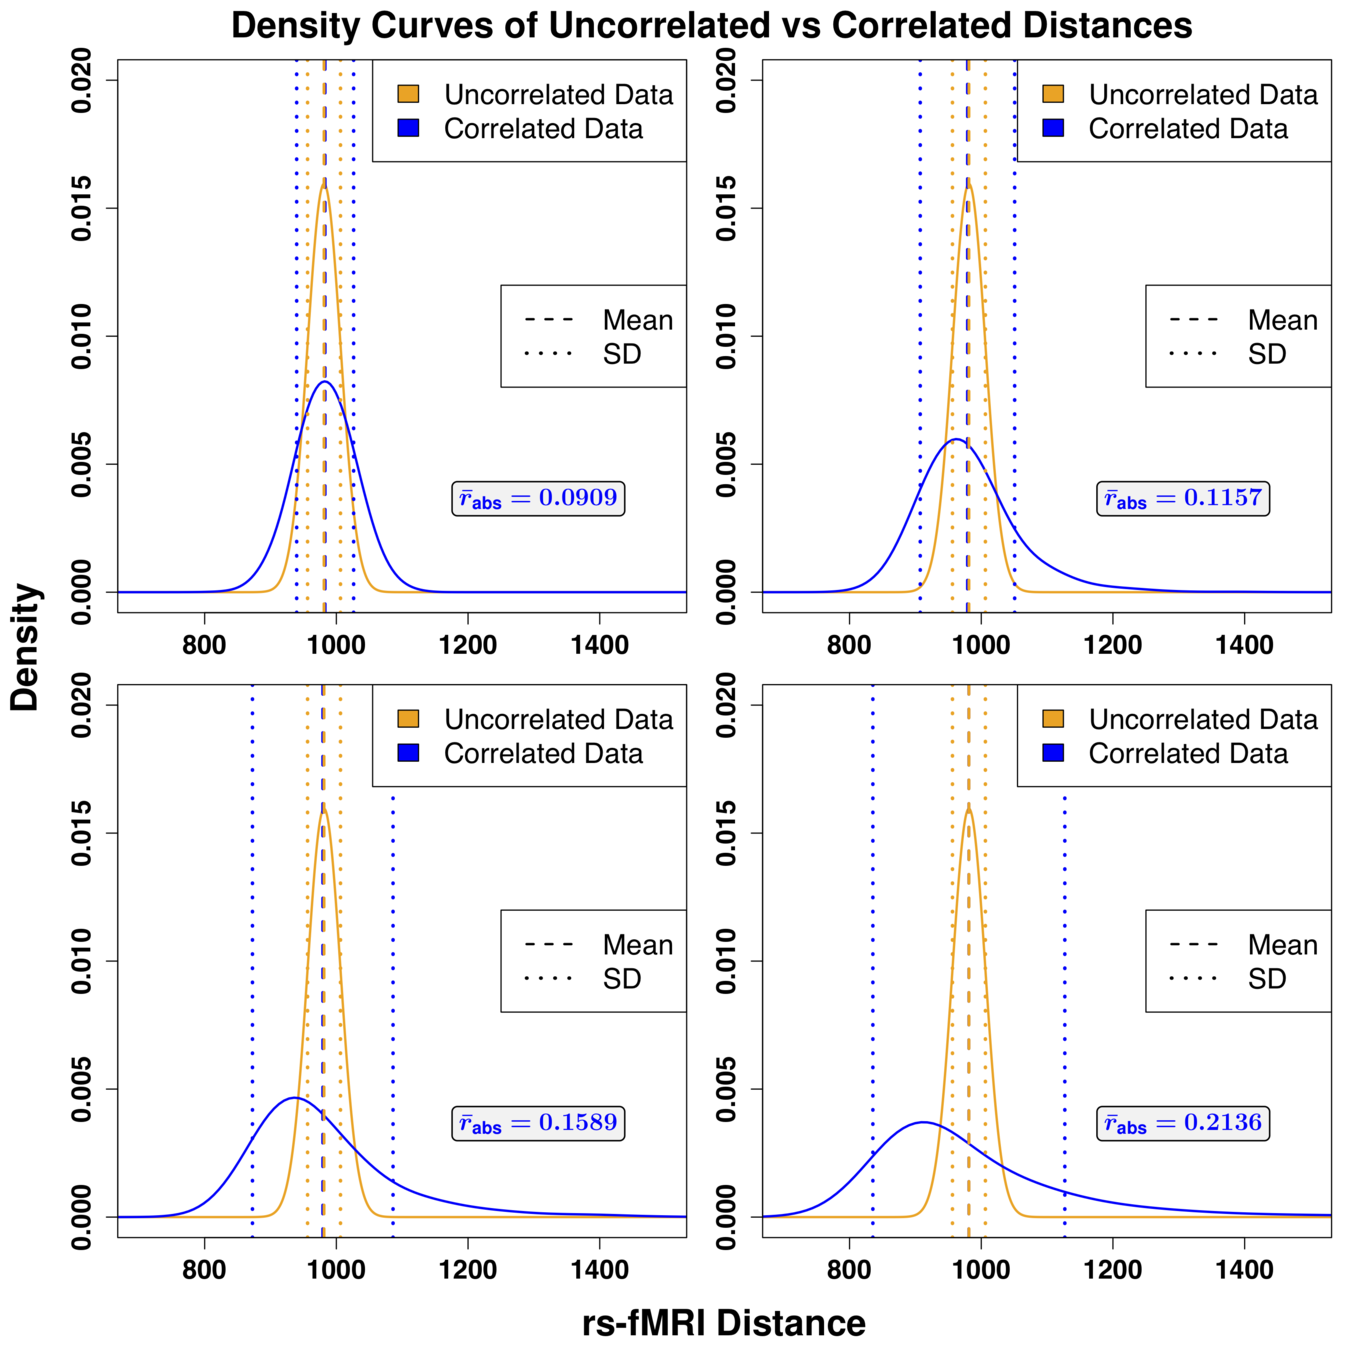
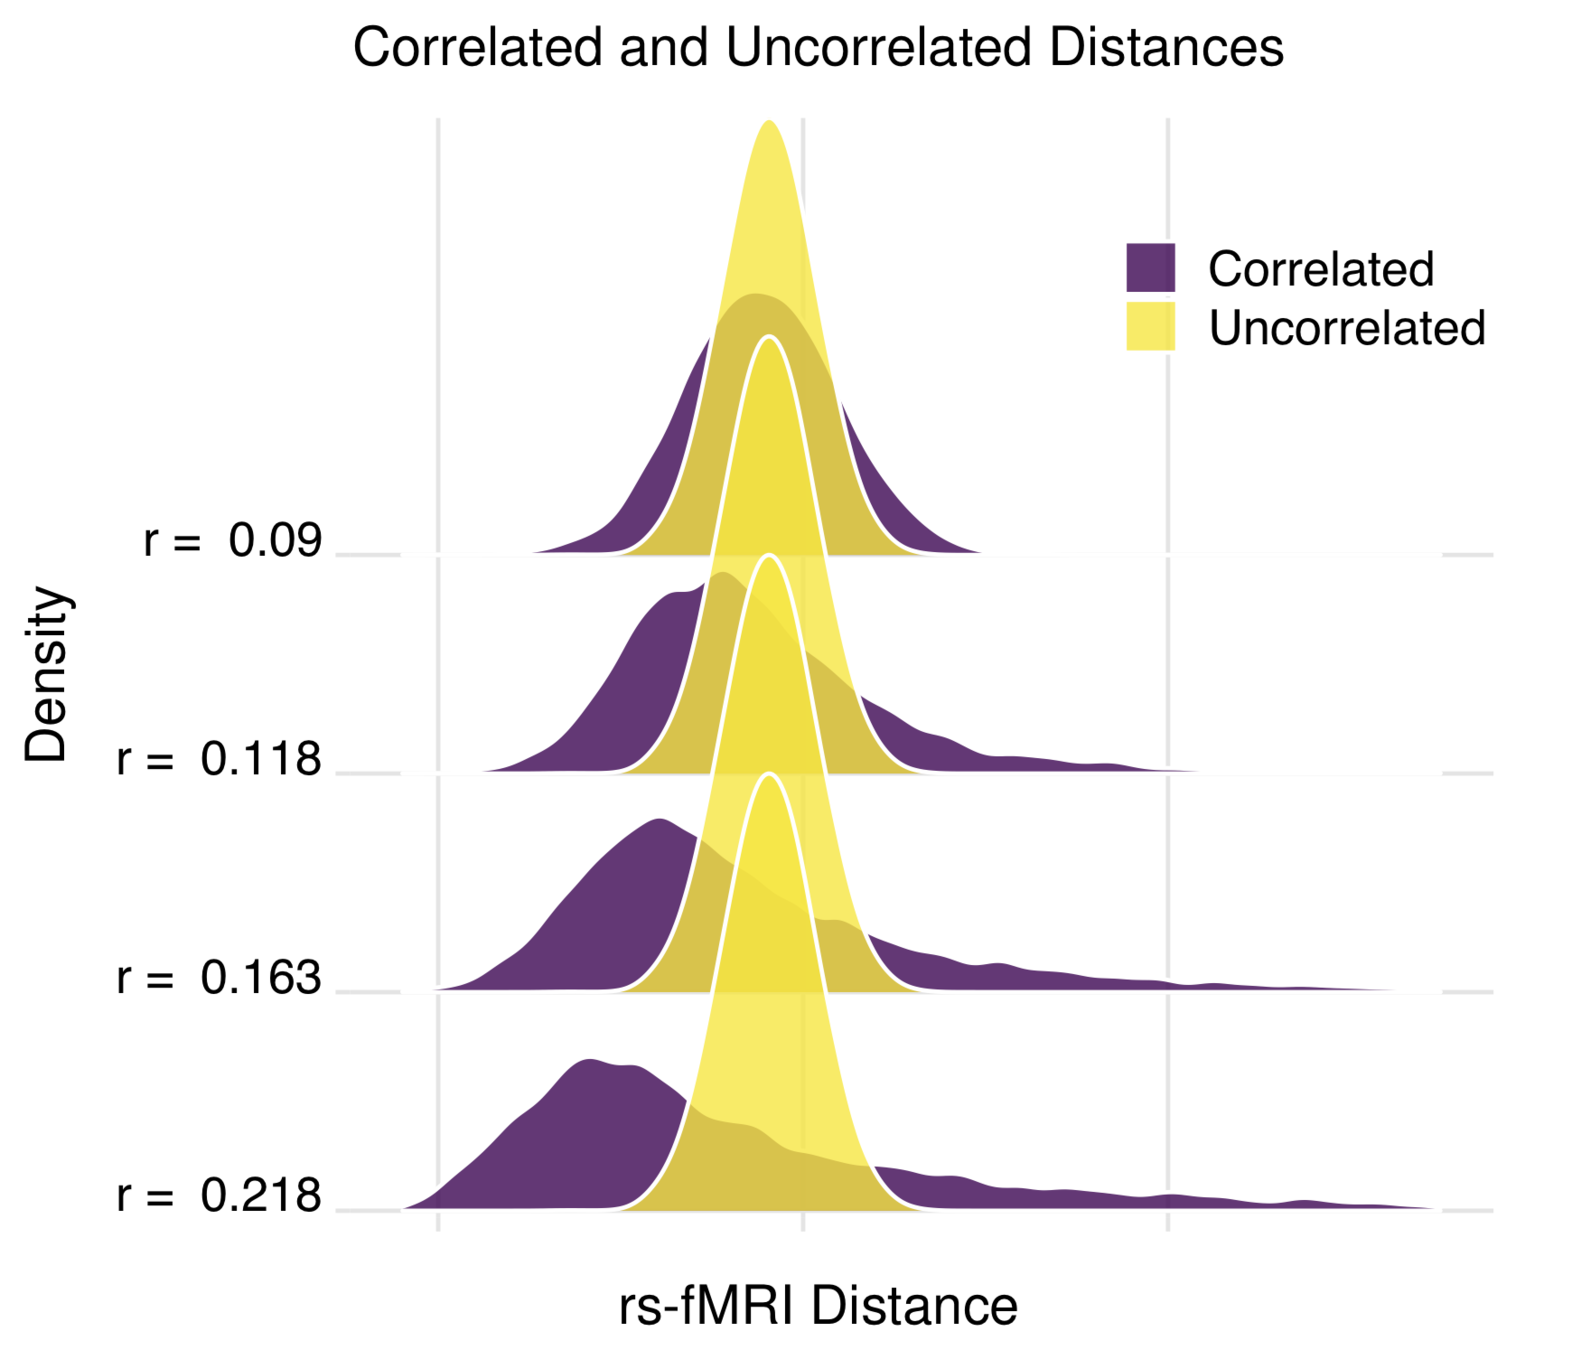
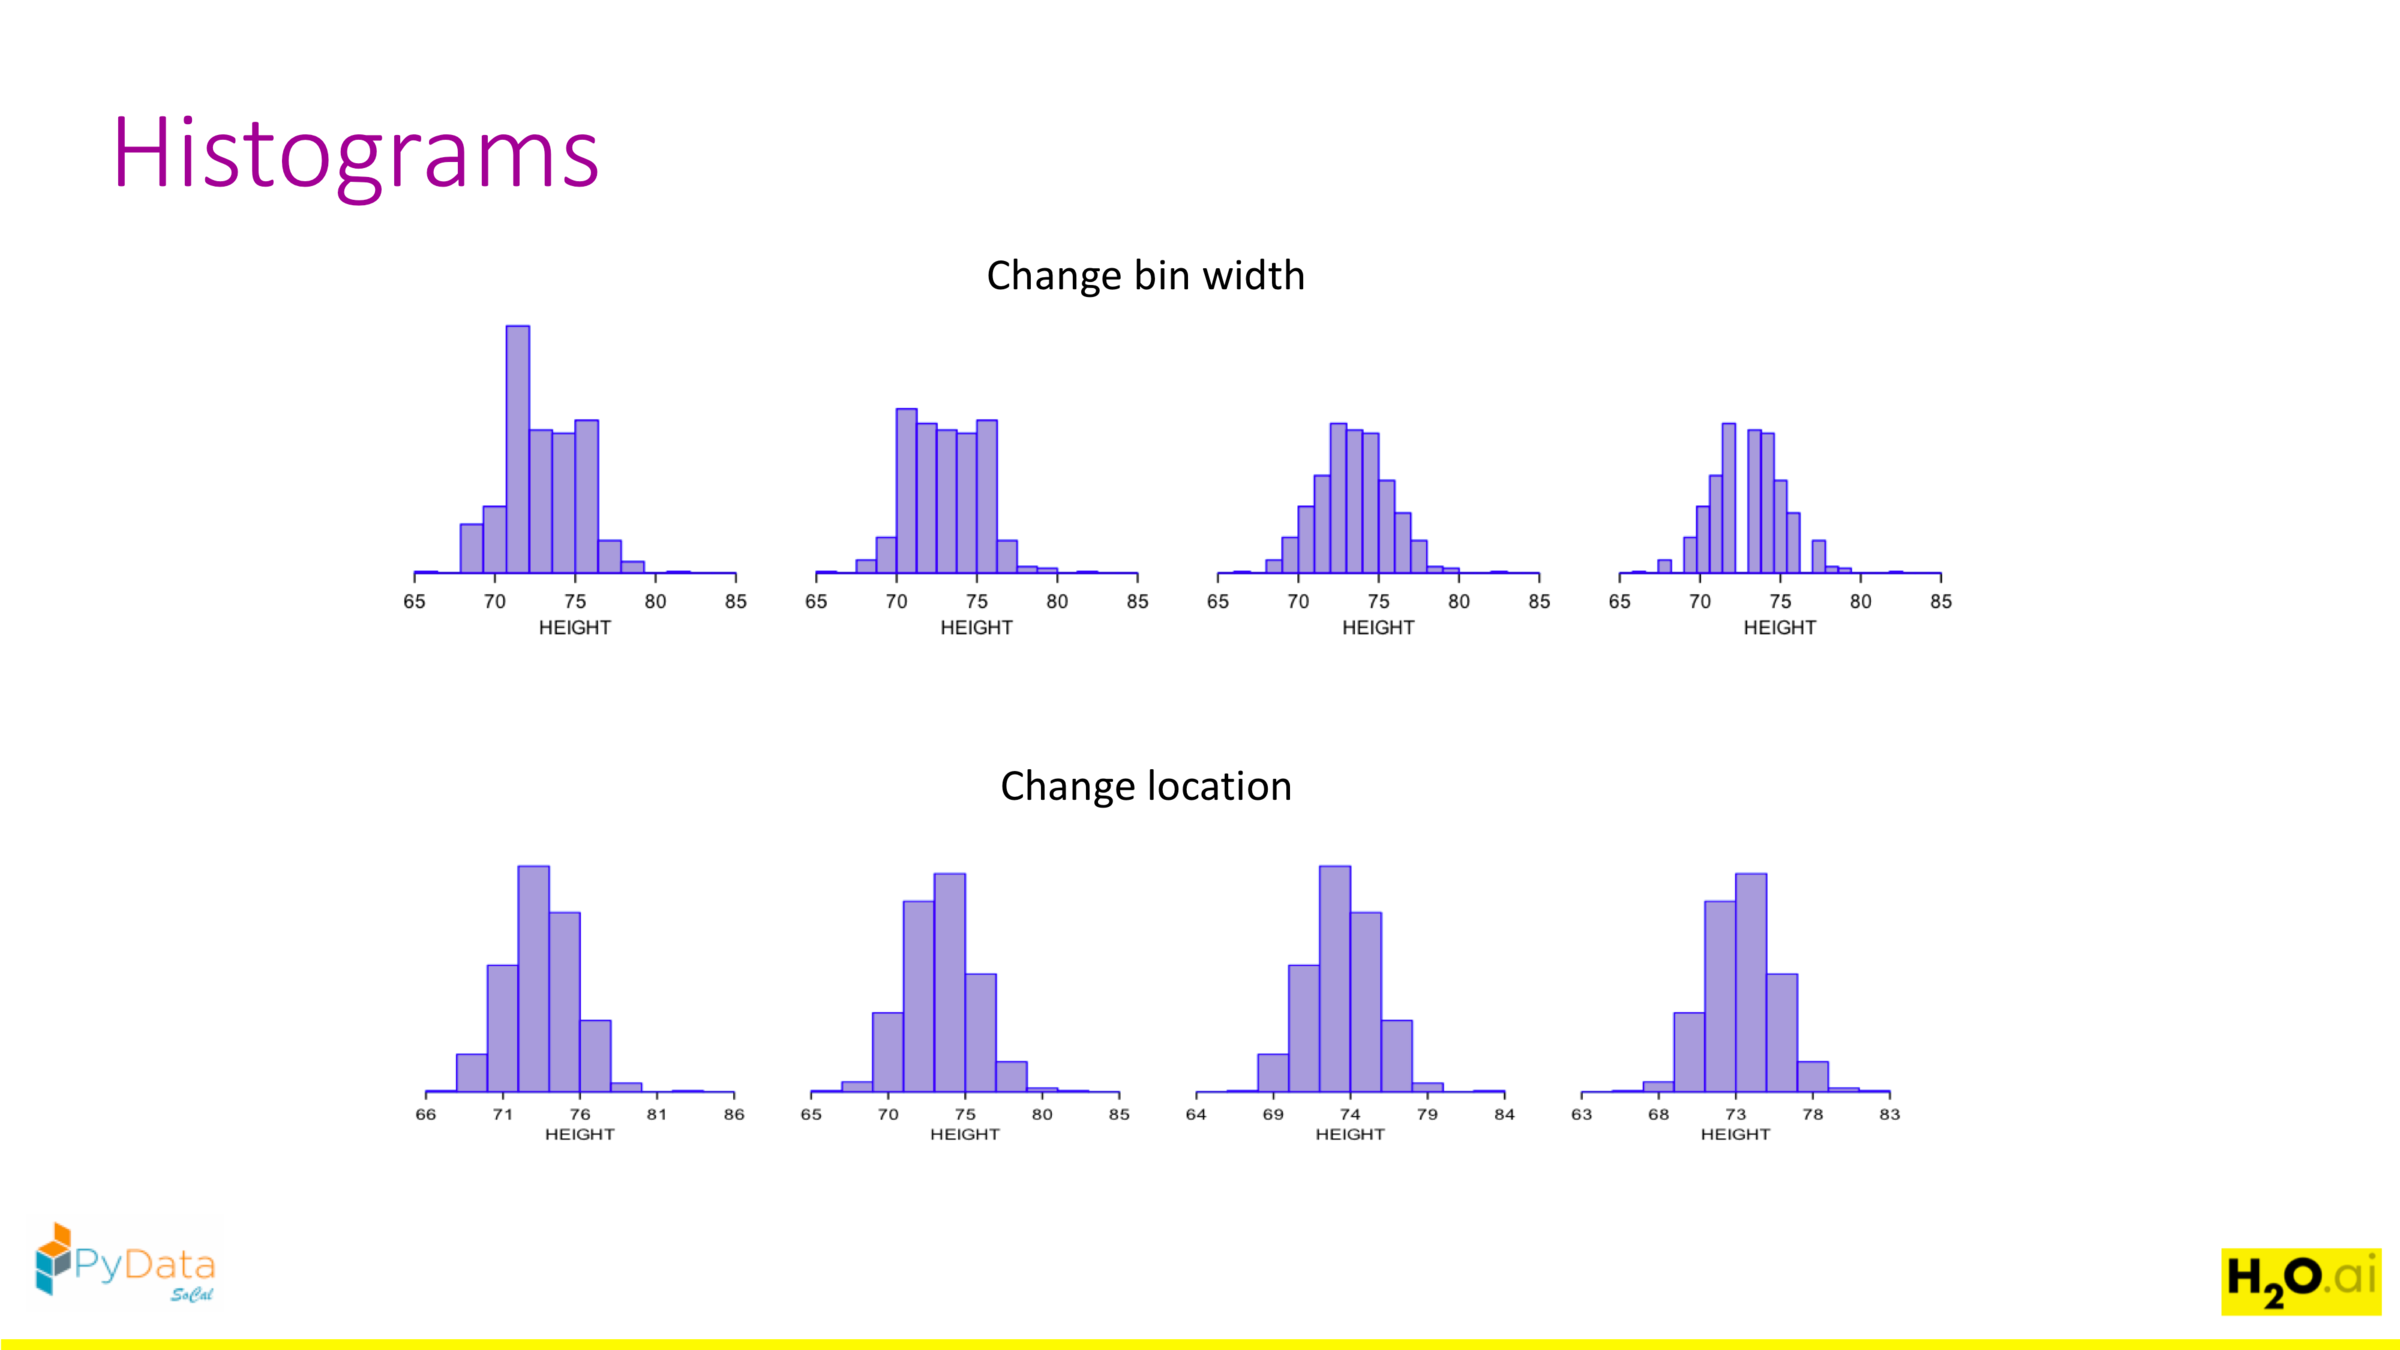
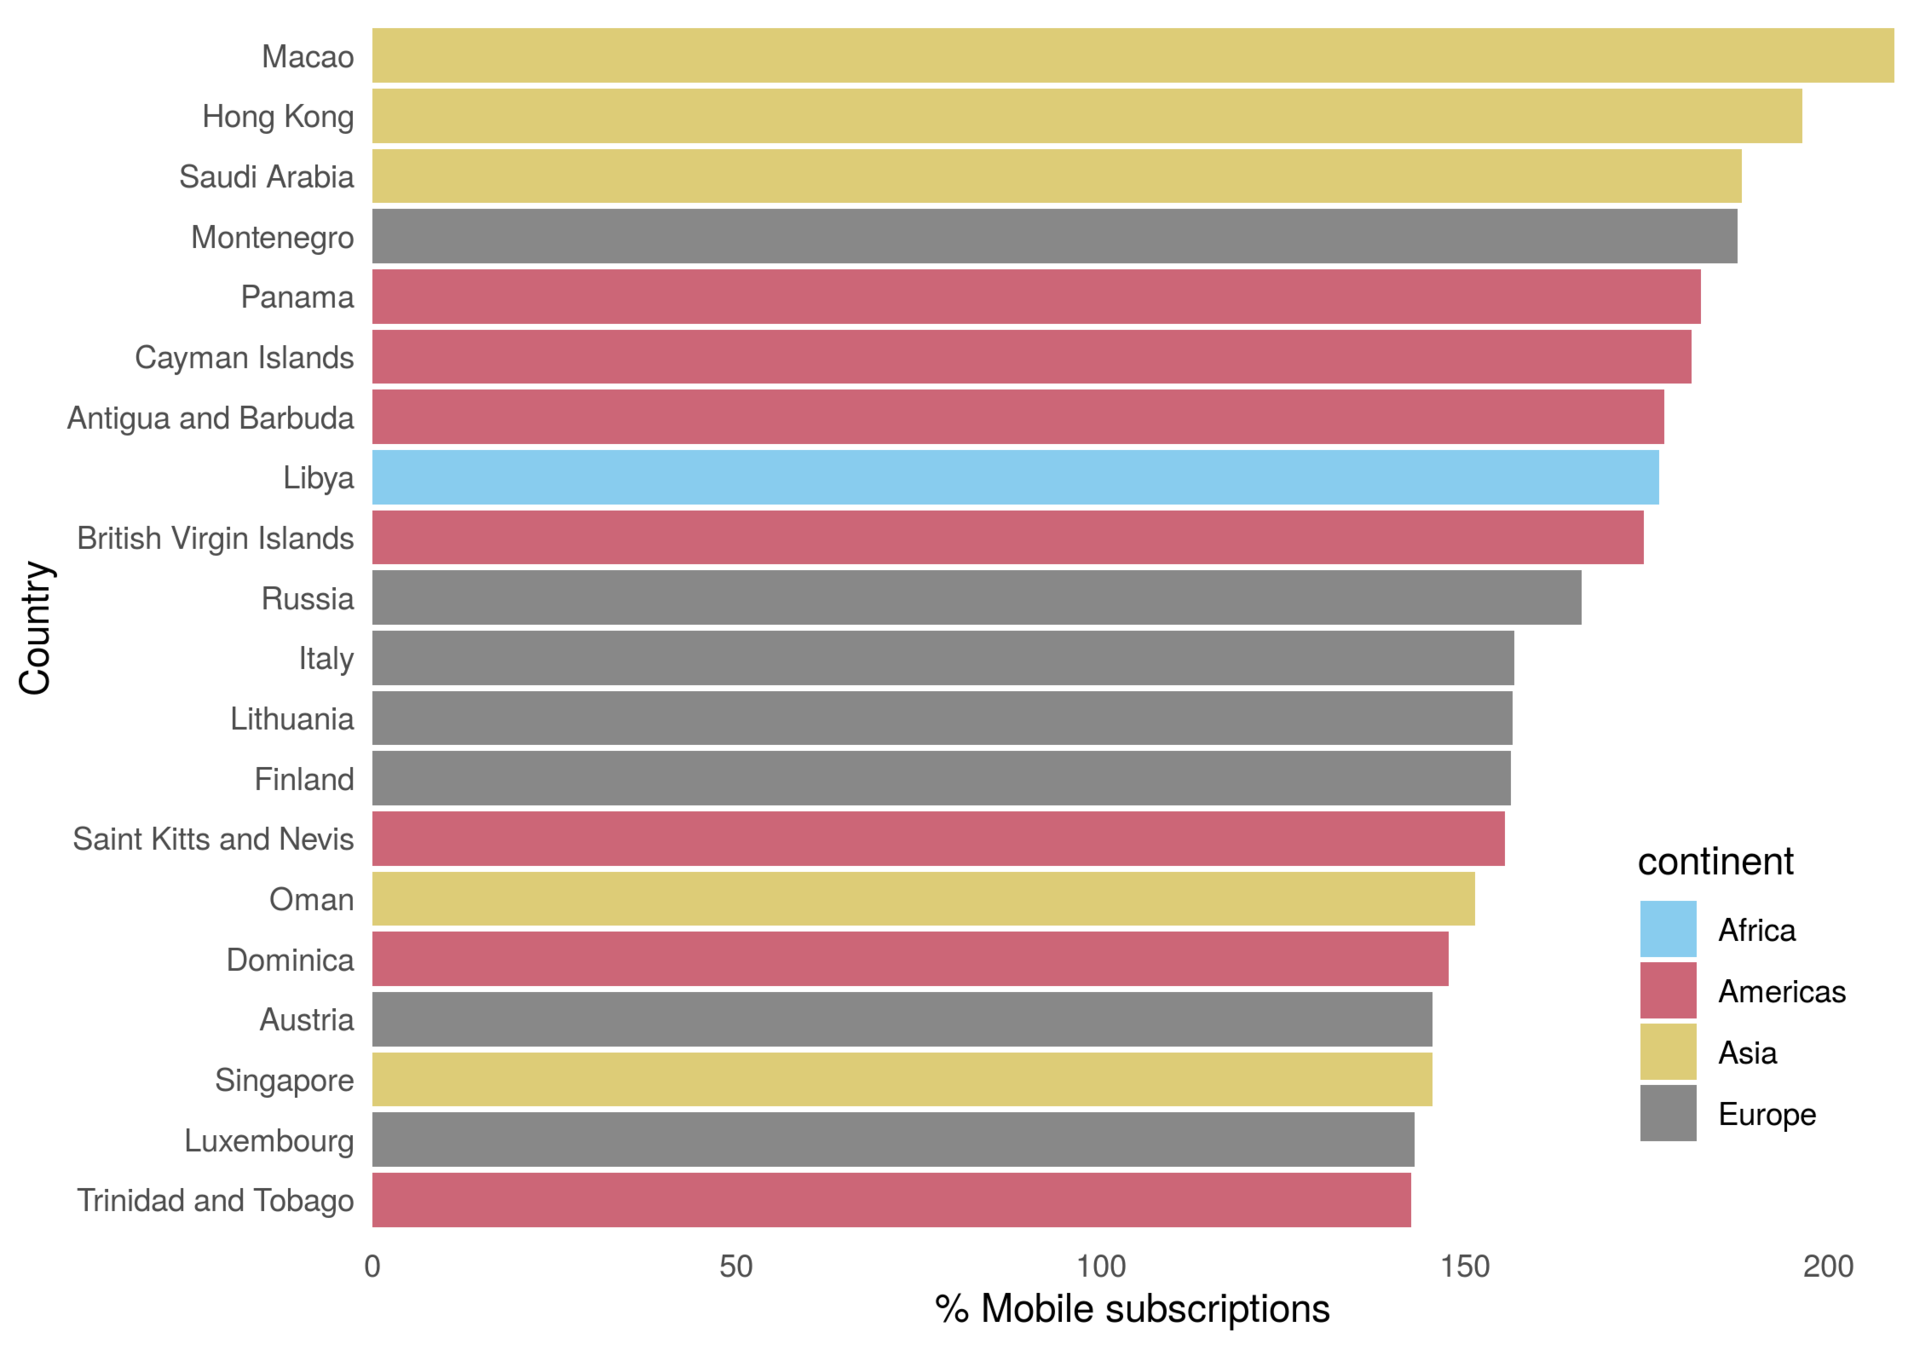
I would use histograms or stacked bar charts for each comparison.
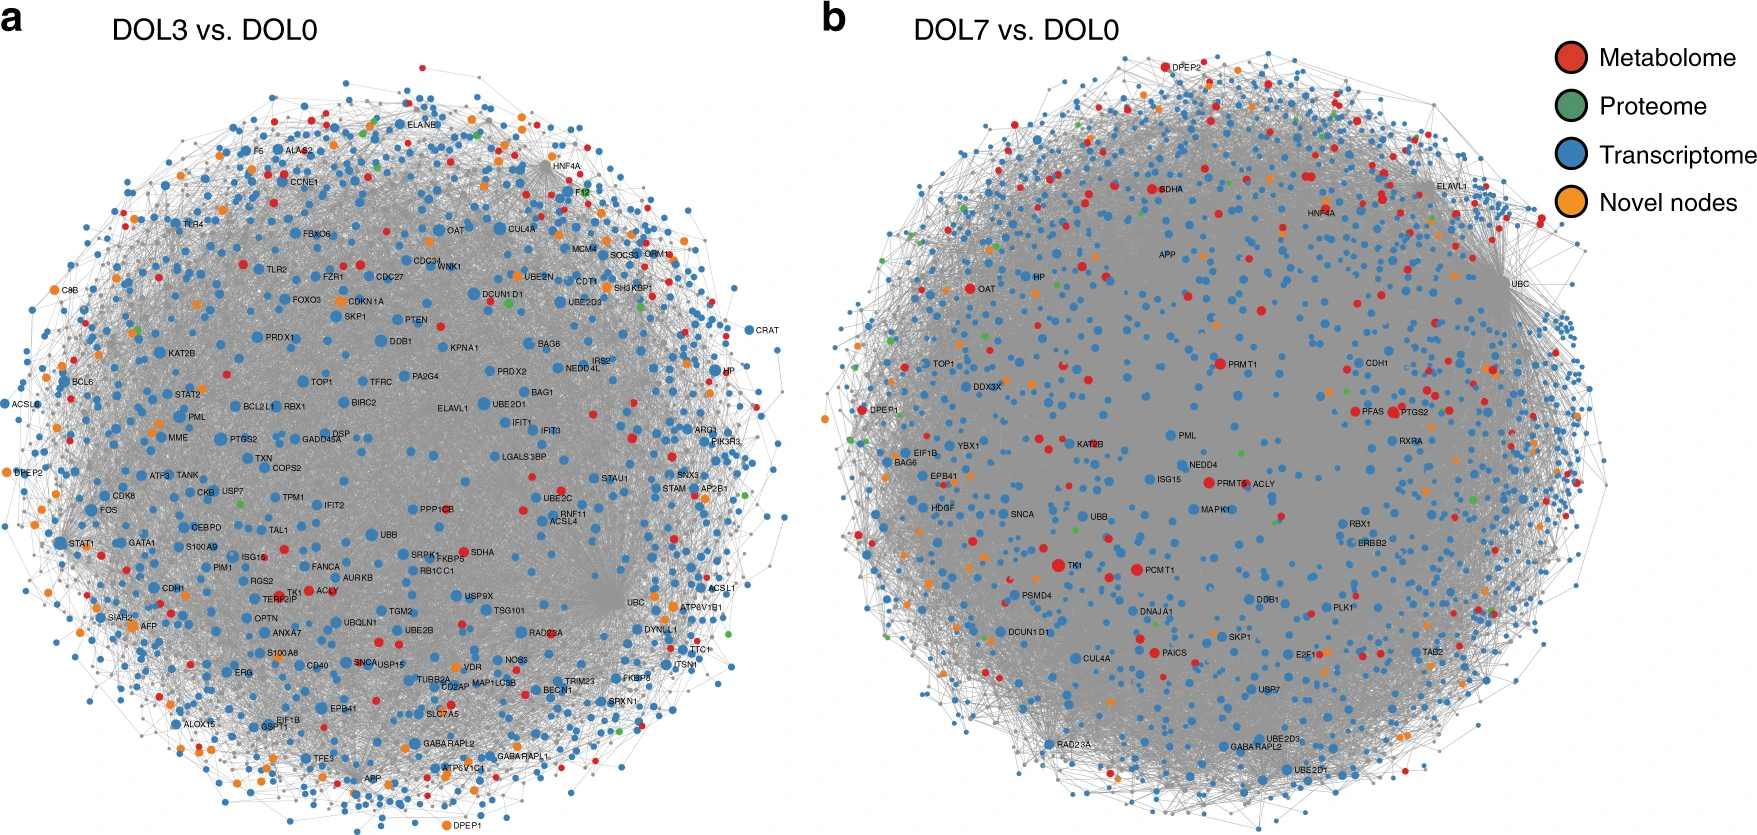
Trade-off: node sizes, edges not shown.
Day 3 vs. Day 0
Day 7 vs. Day 0
Metabolome
Proteome
Transcriptome
Novel nodes
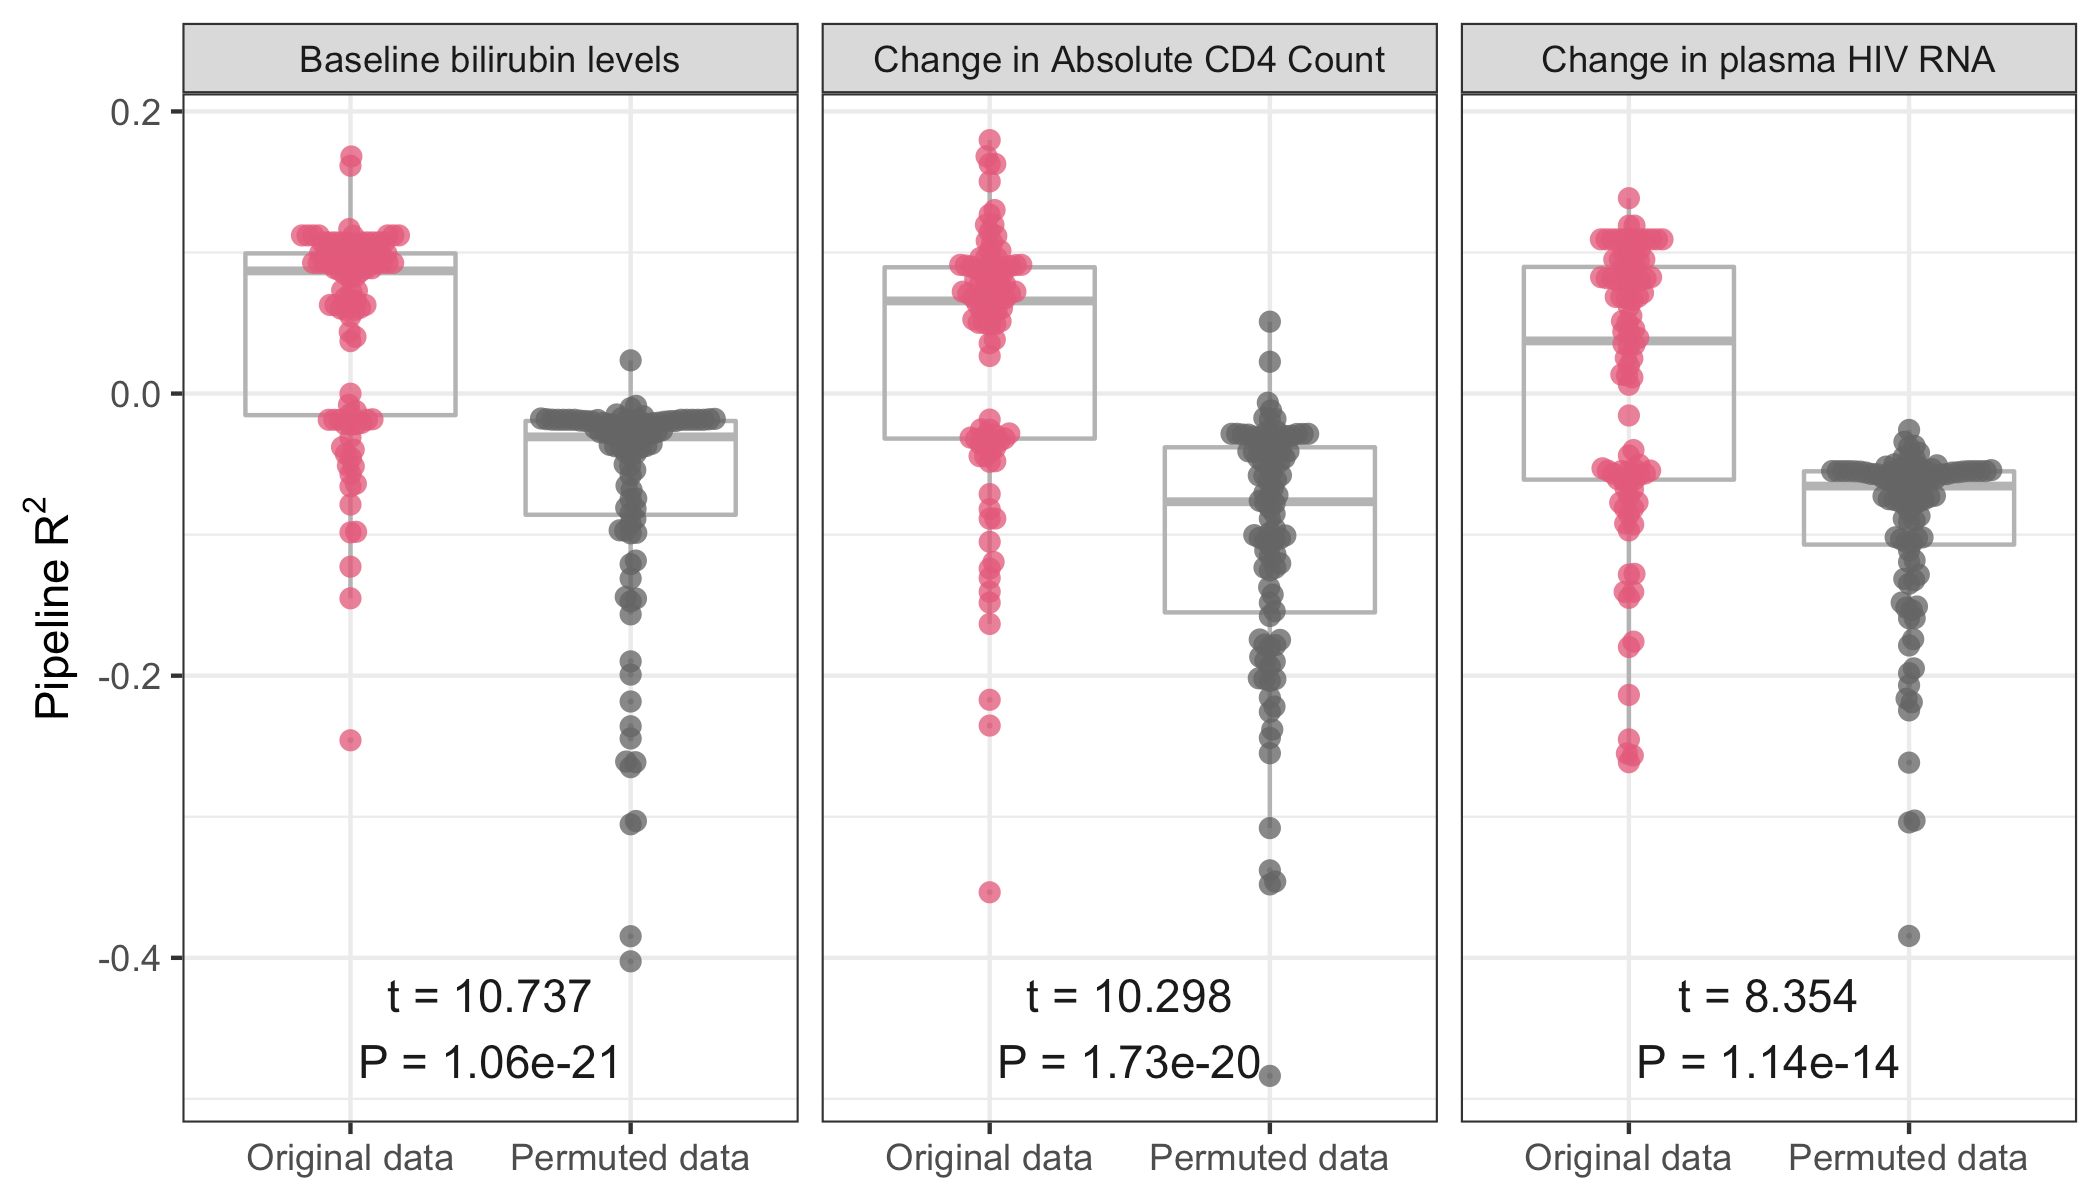
performance
Model B – Model A
Model B
Model A
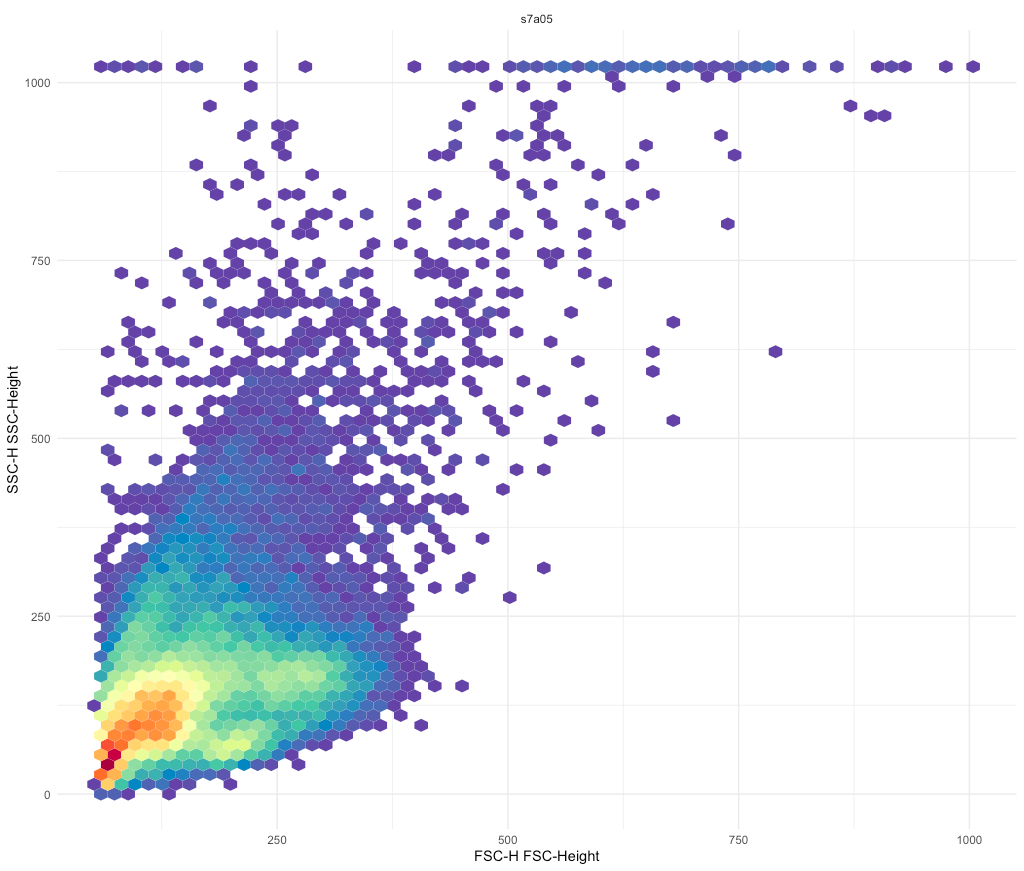
ggcyto::ggcyto() + geom_hex(bins = 64)
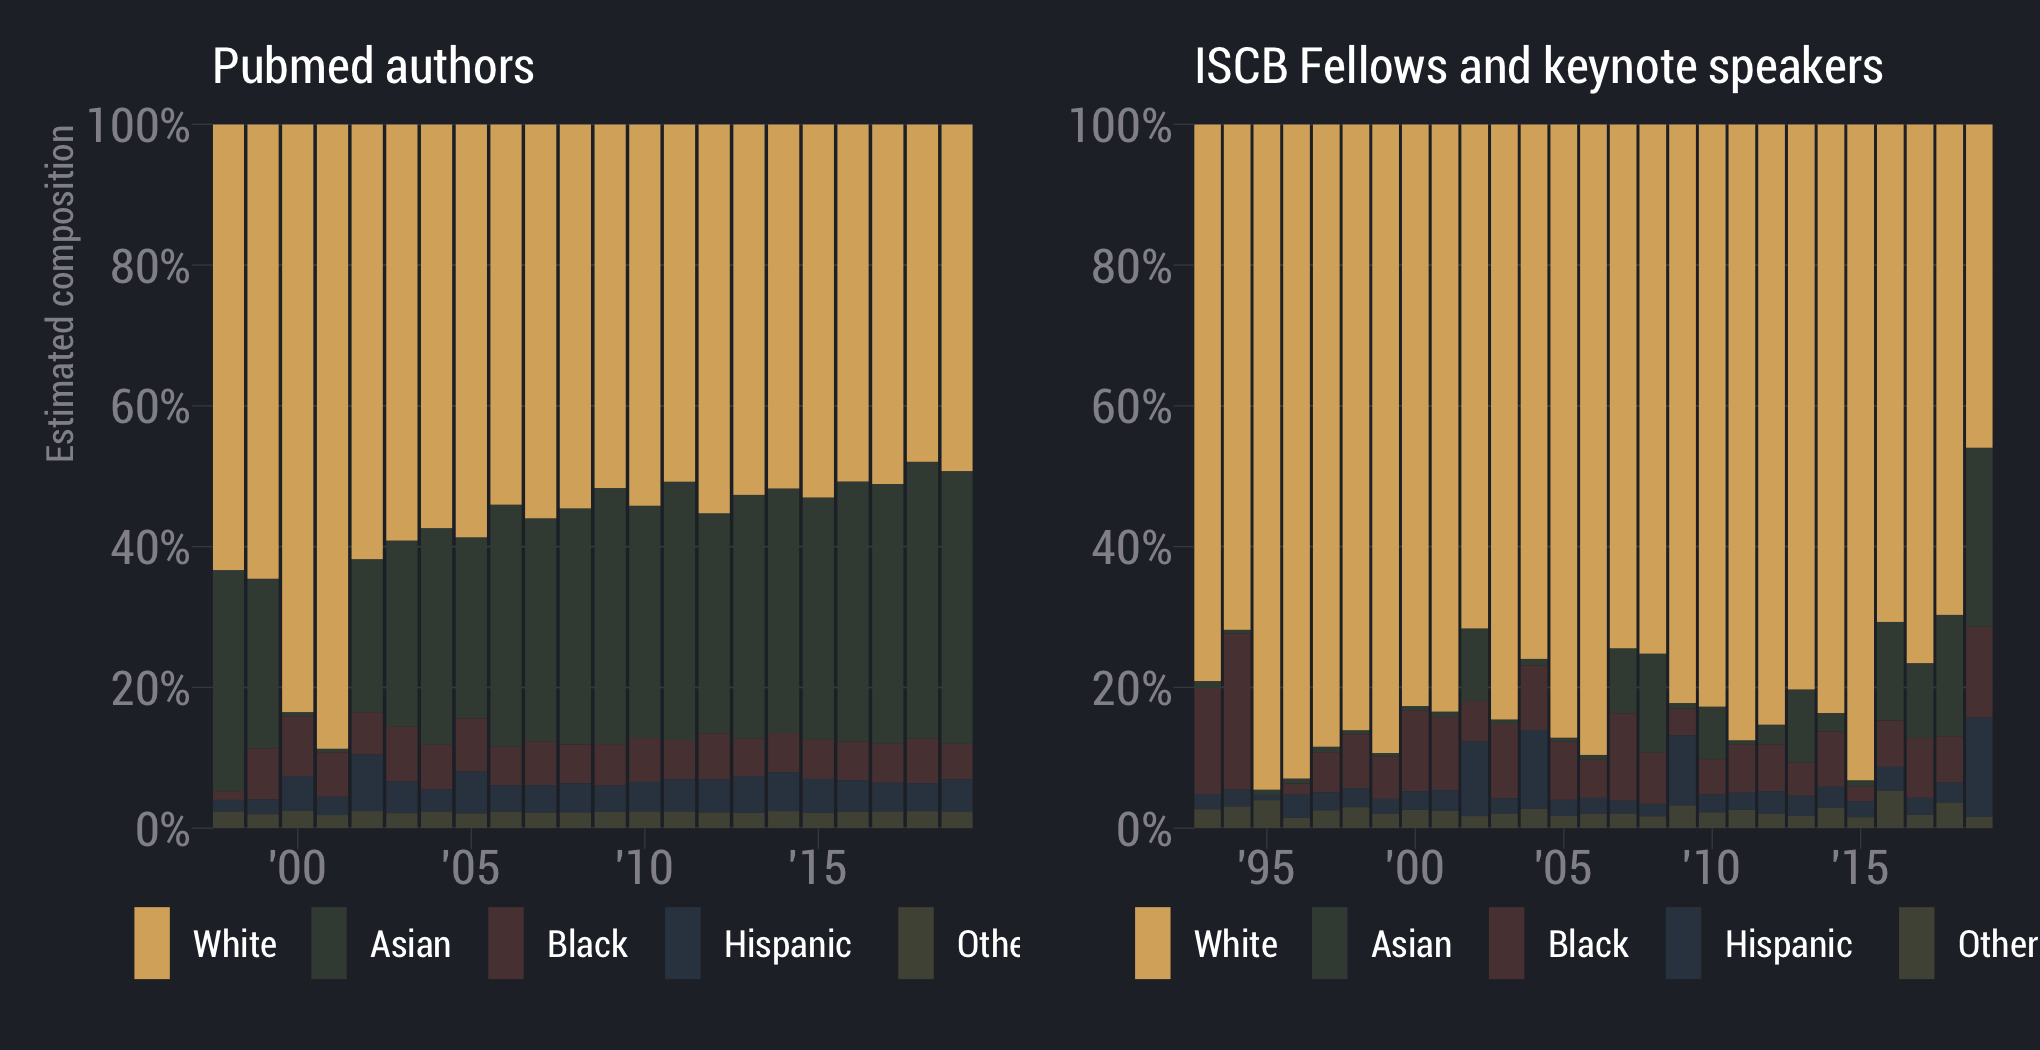
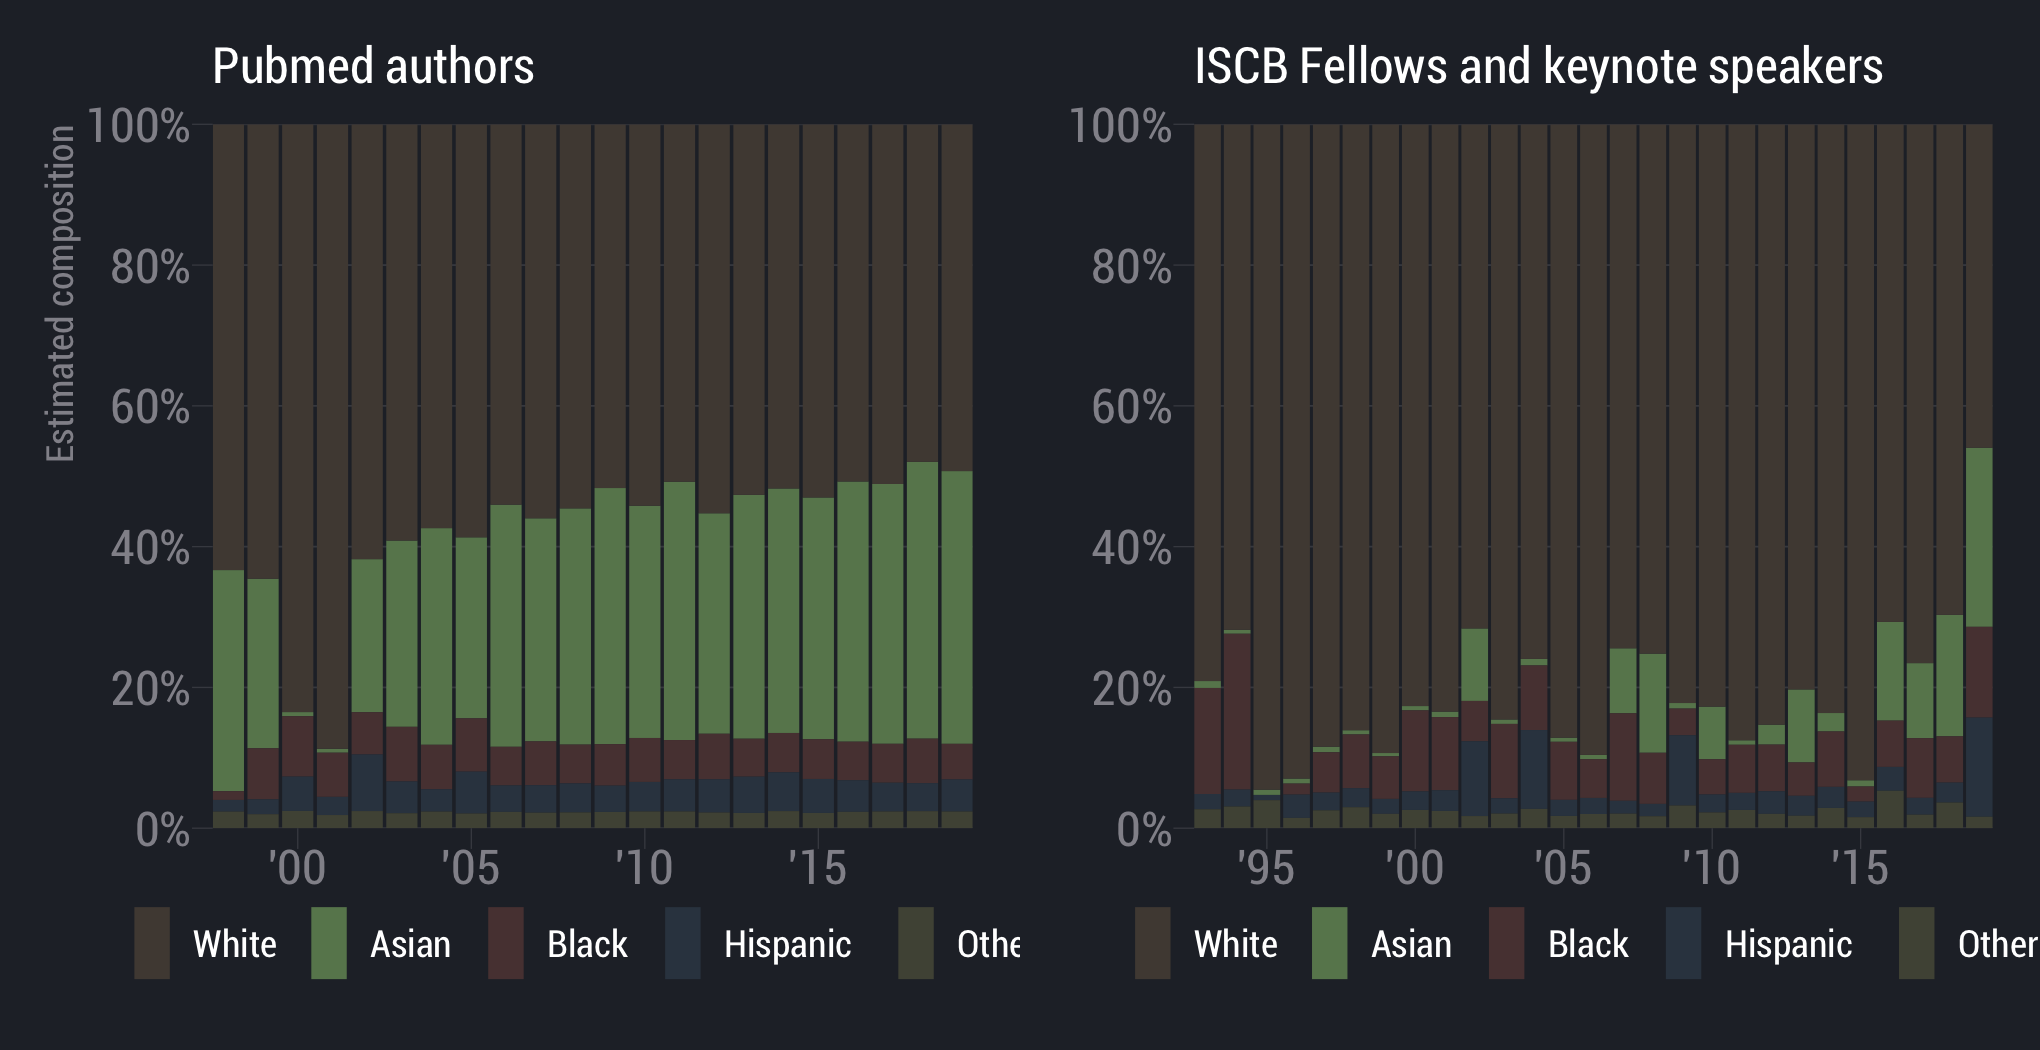
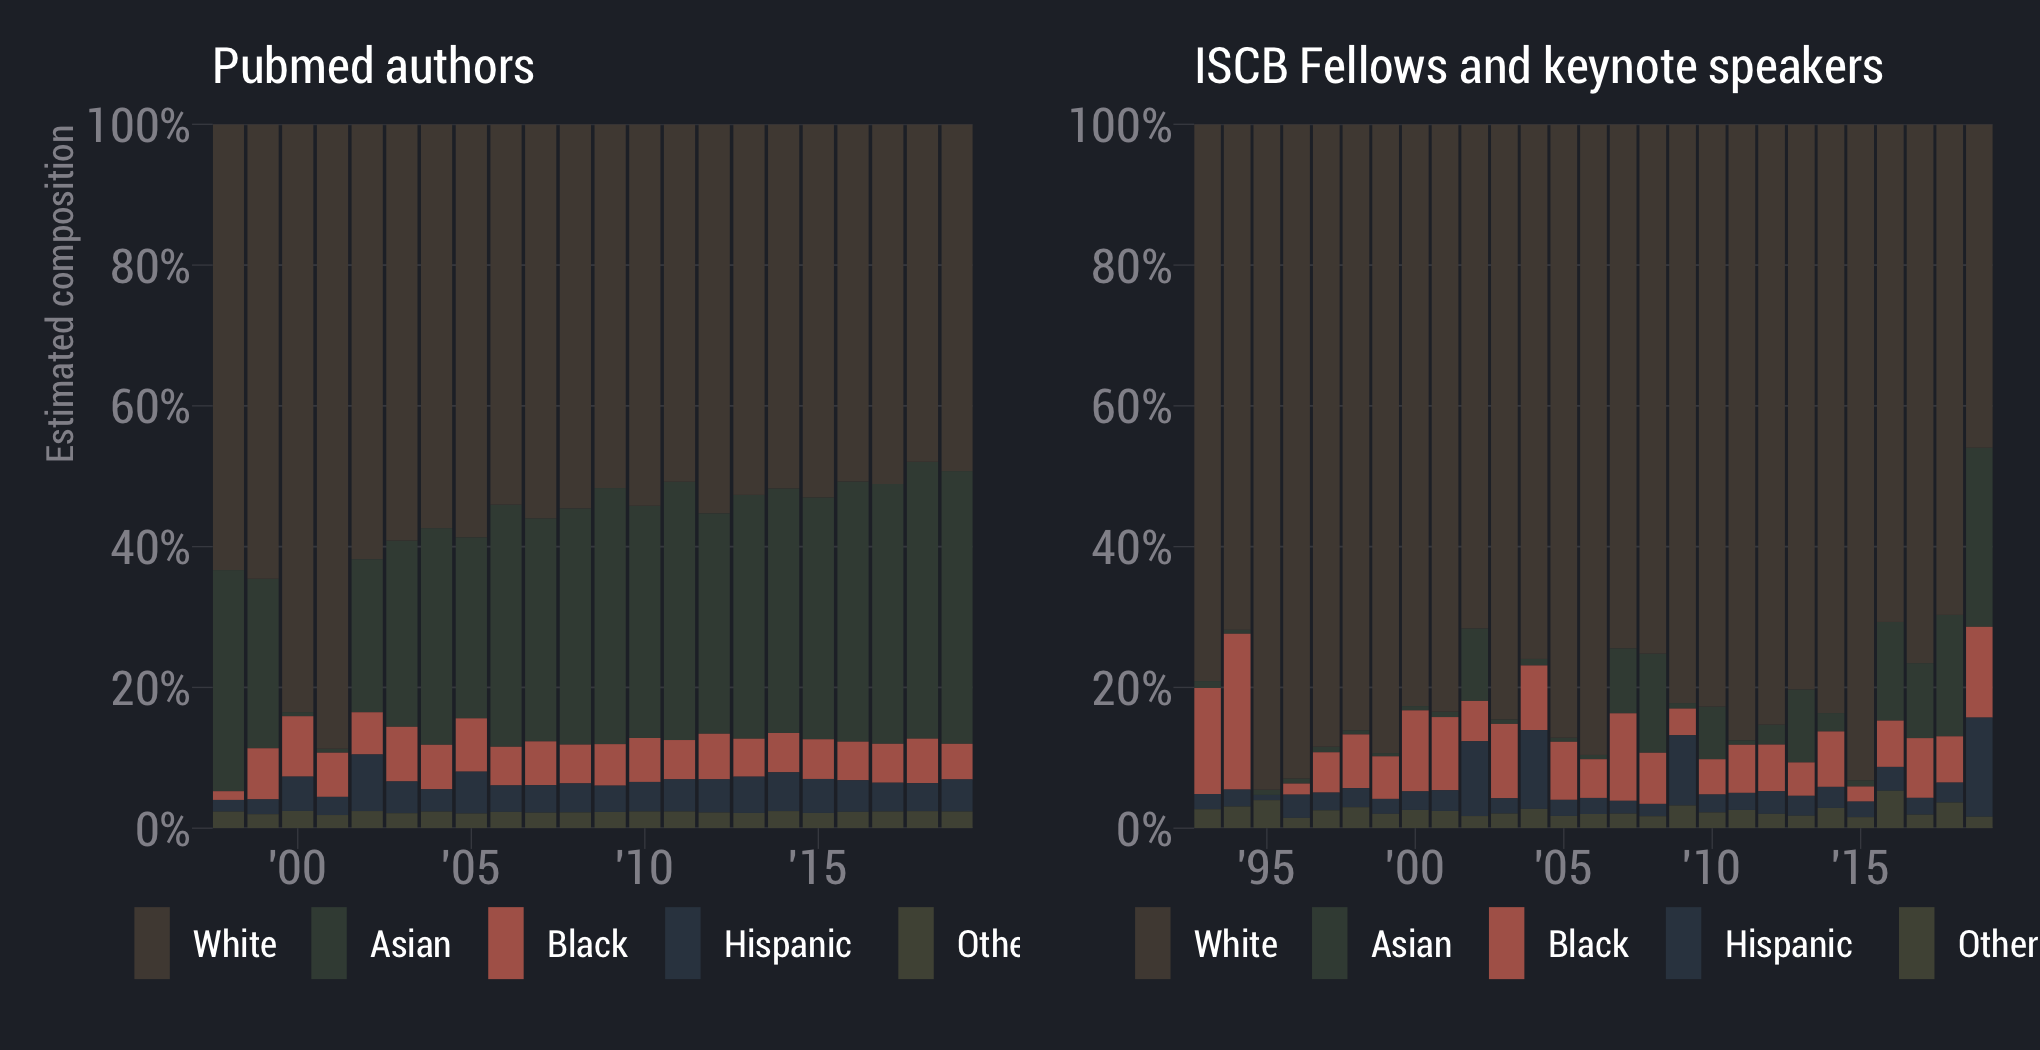
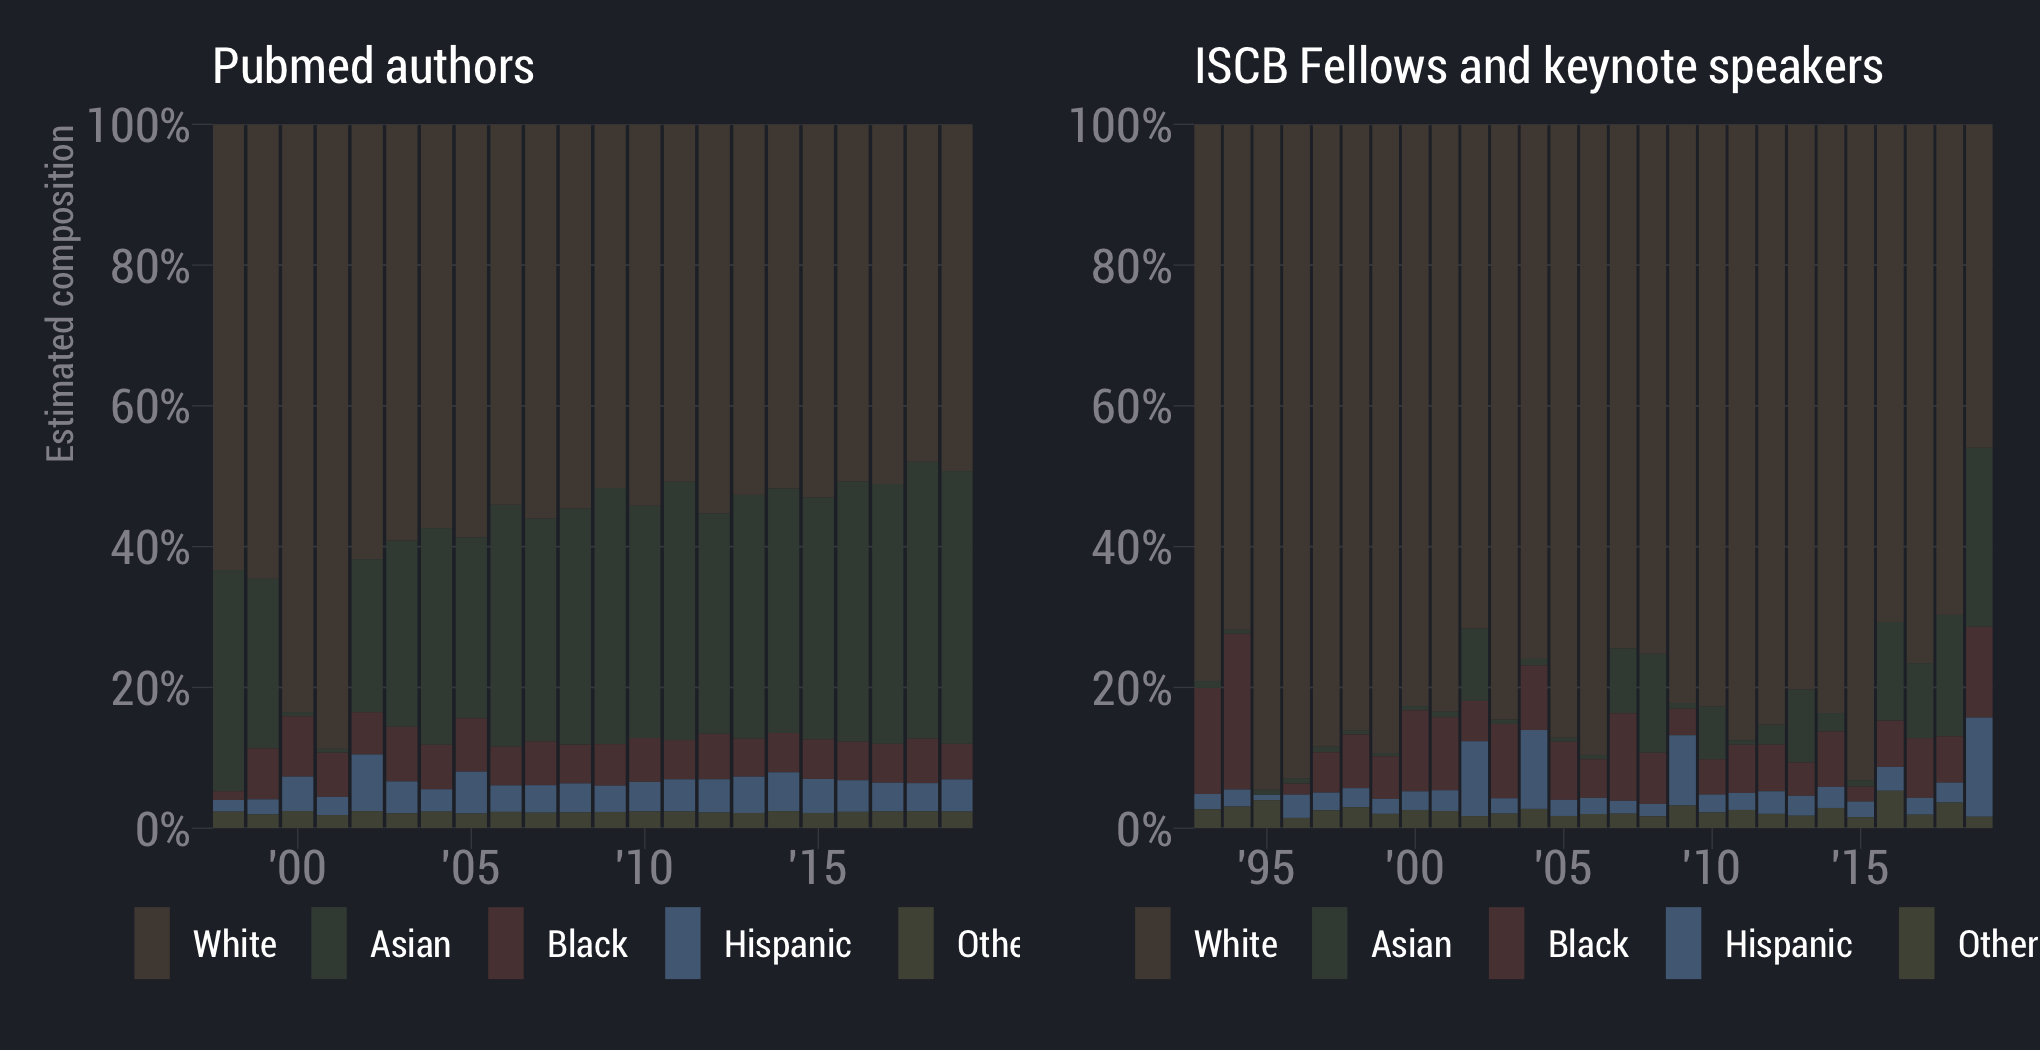
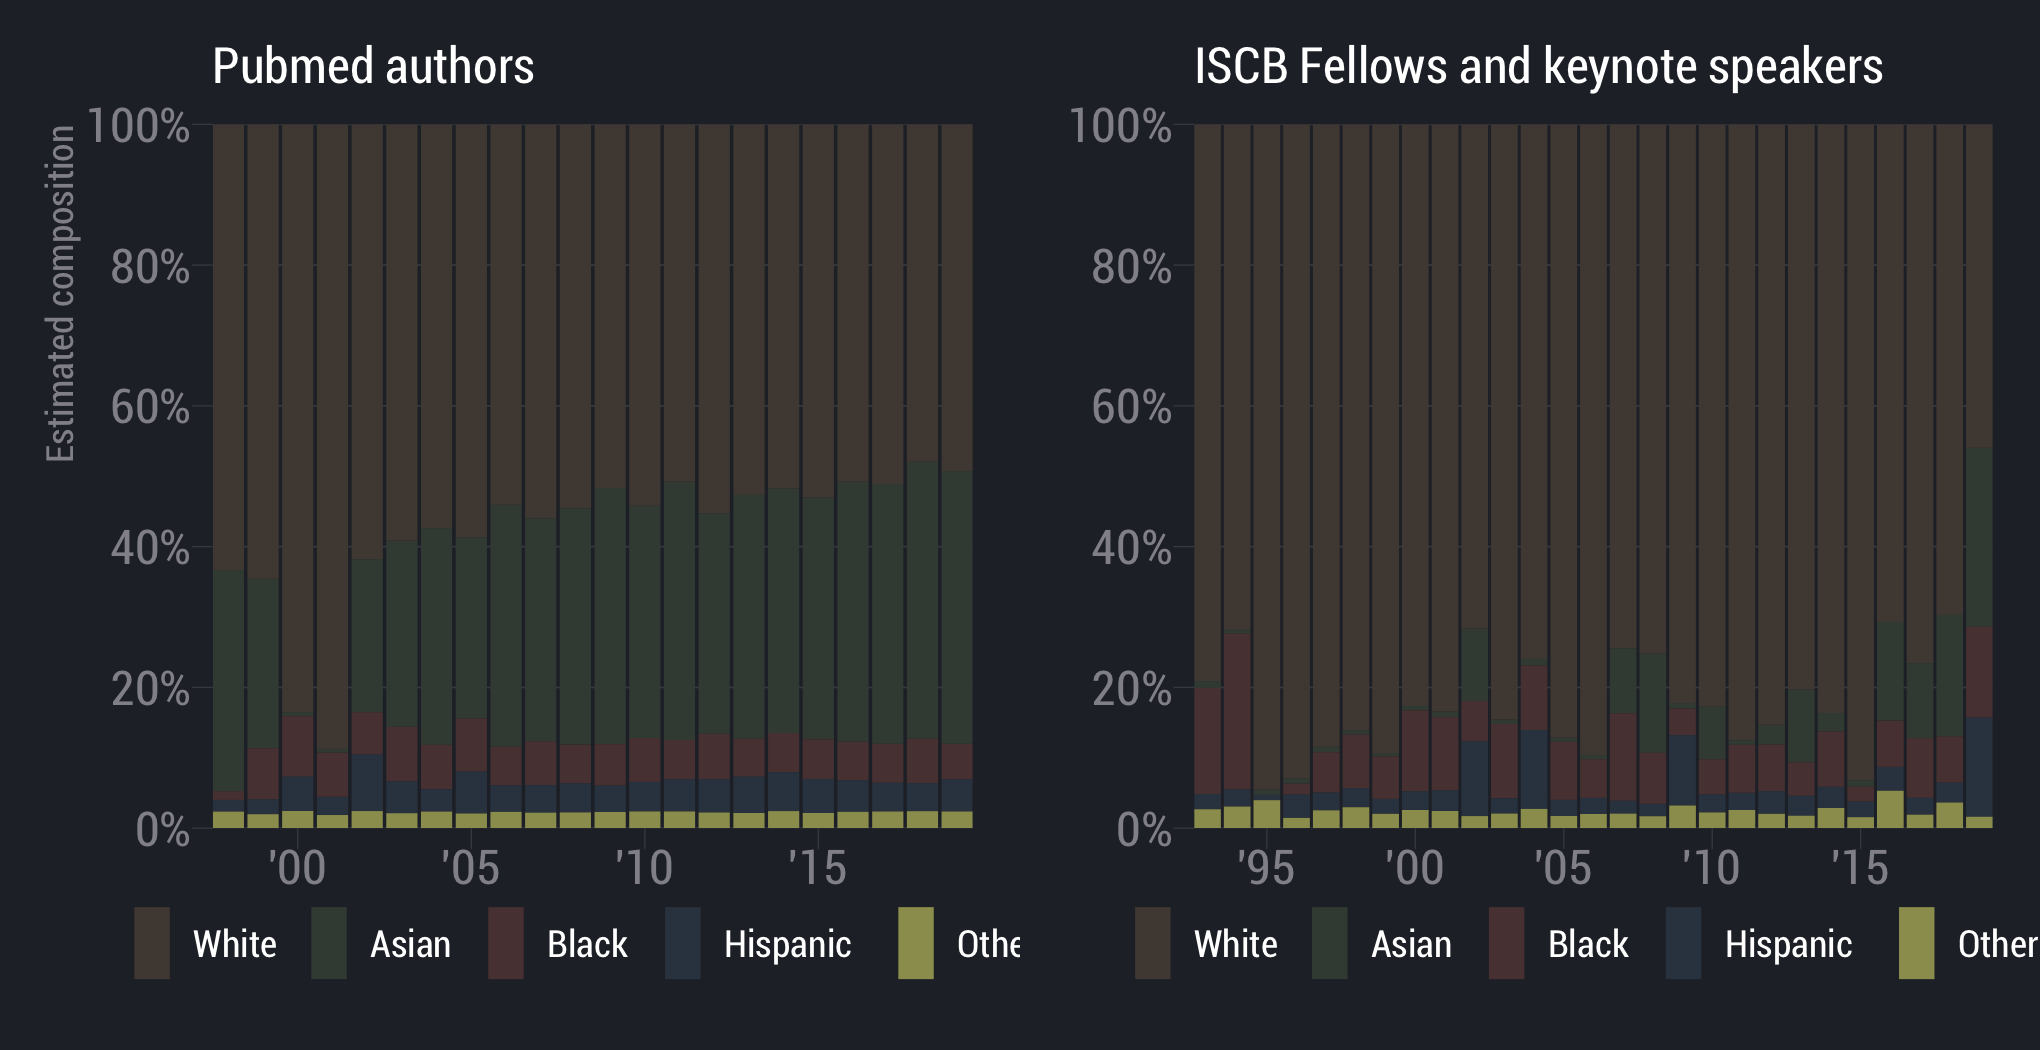
White scientists are overrepresented
scientists are underrepresented
Asian
theme_set(theme_minimal())
theme_update(
  legend.title = element_blank(),
  panel.grid.minor = element_blank())
)
theme_set()ggplot(df, aes(x = x, y = y)) +
geom_point() +
theme_bw() +
NULLggplot(df, aes(x = x, y = y)) +
geom_point() +
# theme_bw() +
NULLin magrittr pipe:
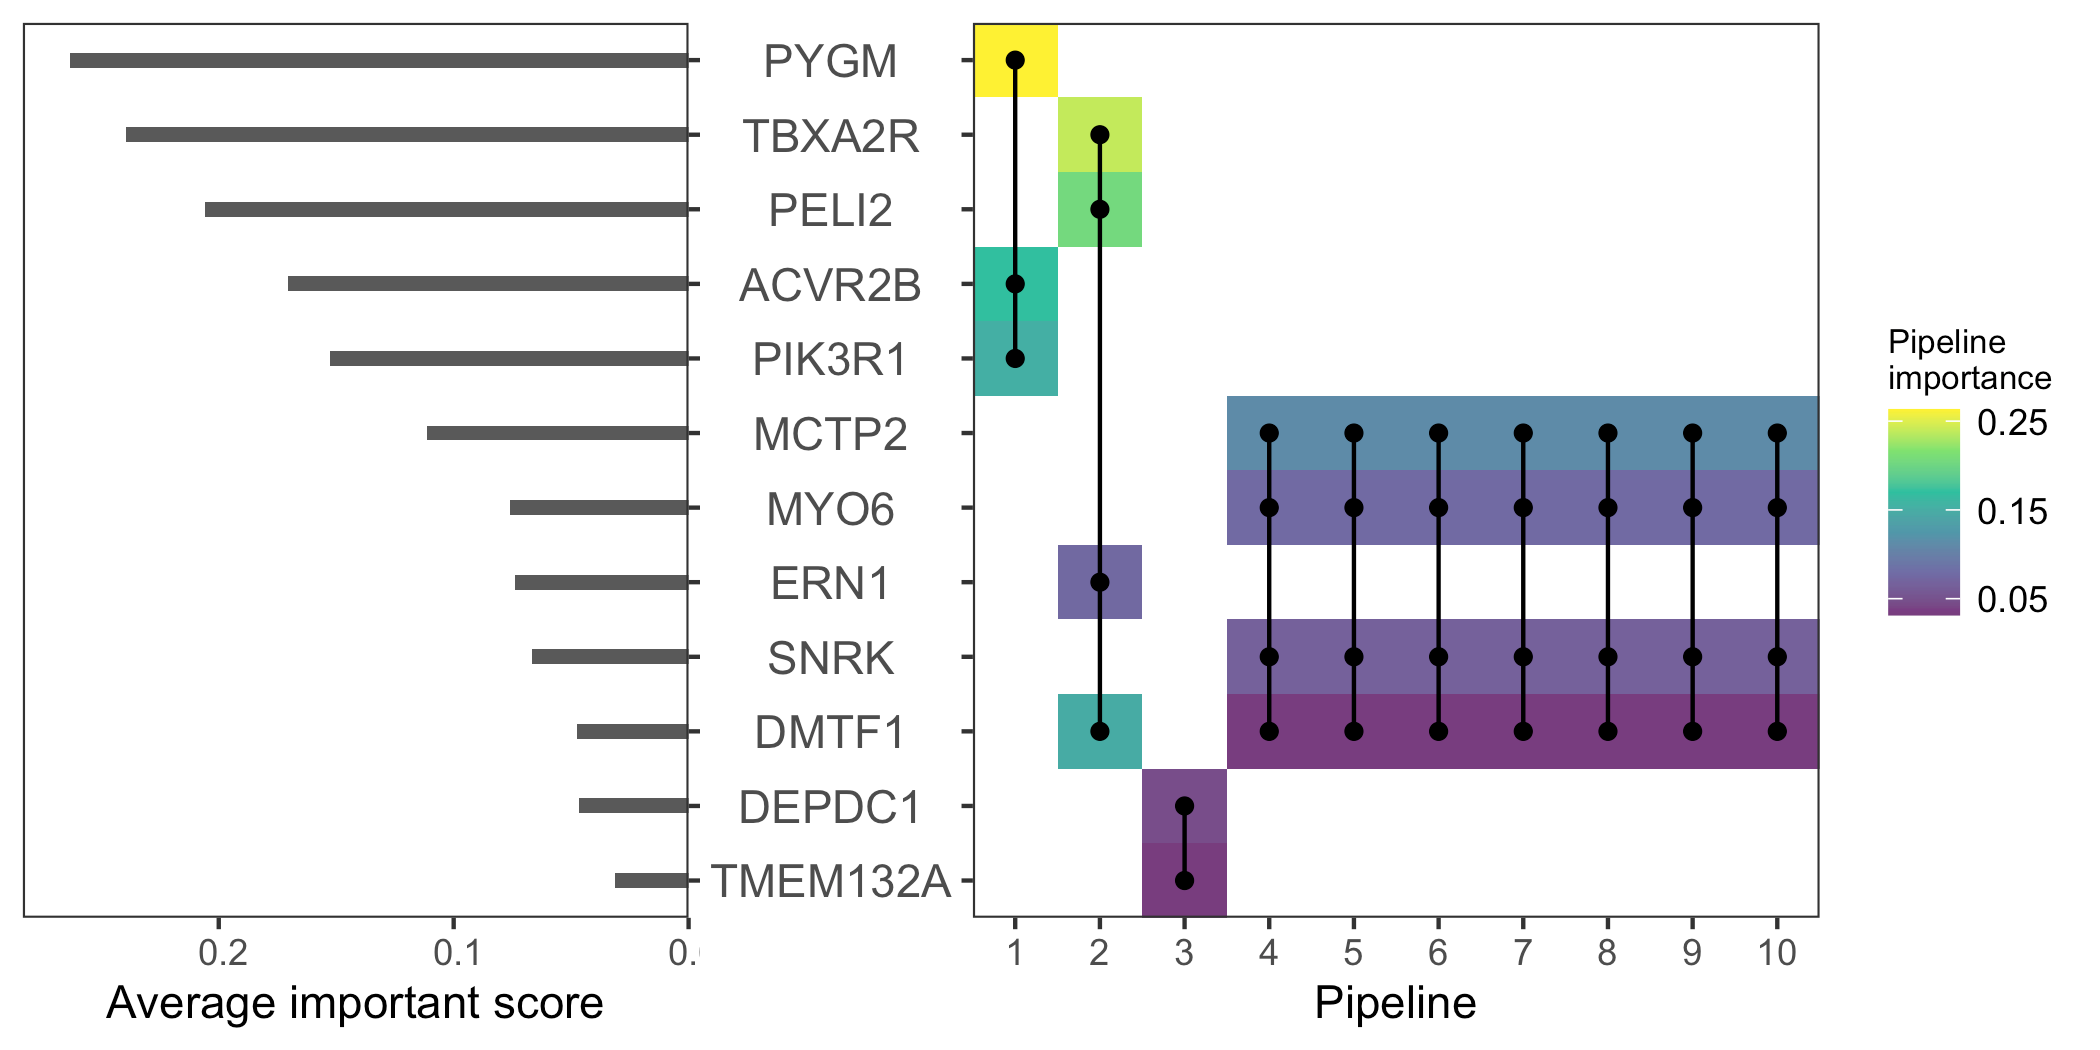
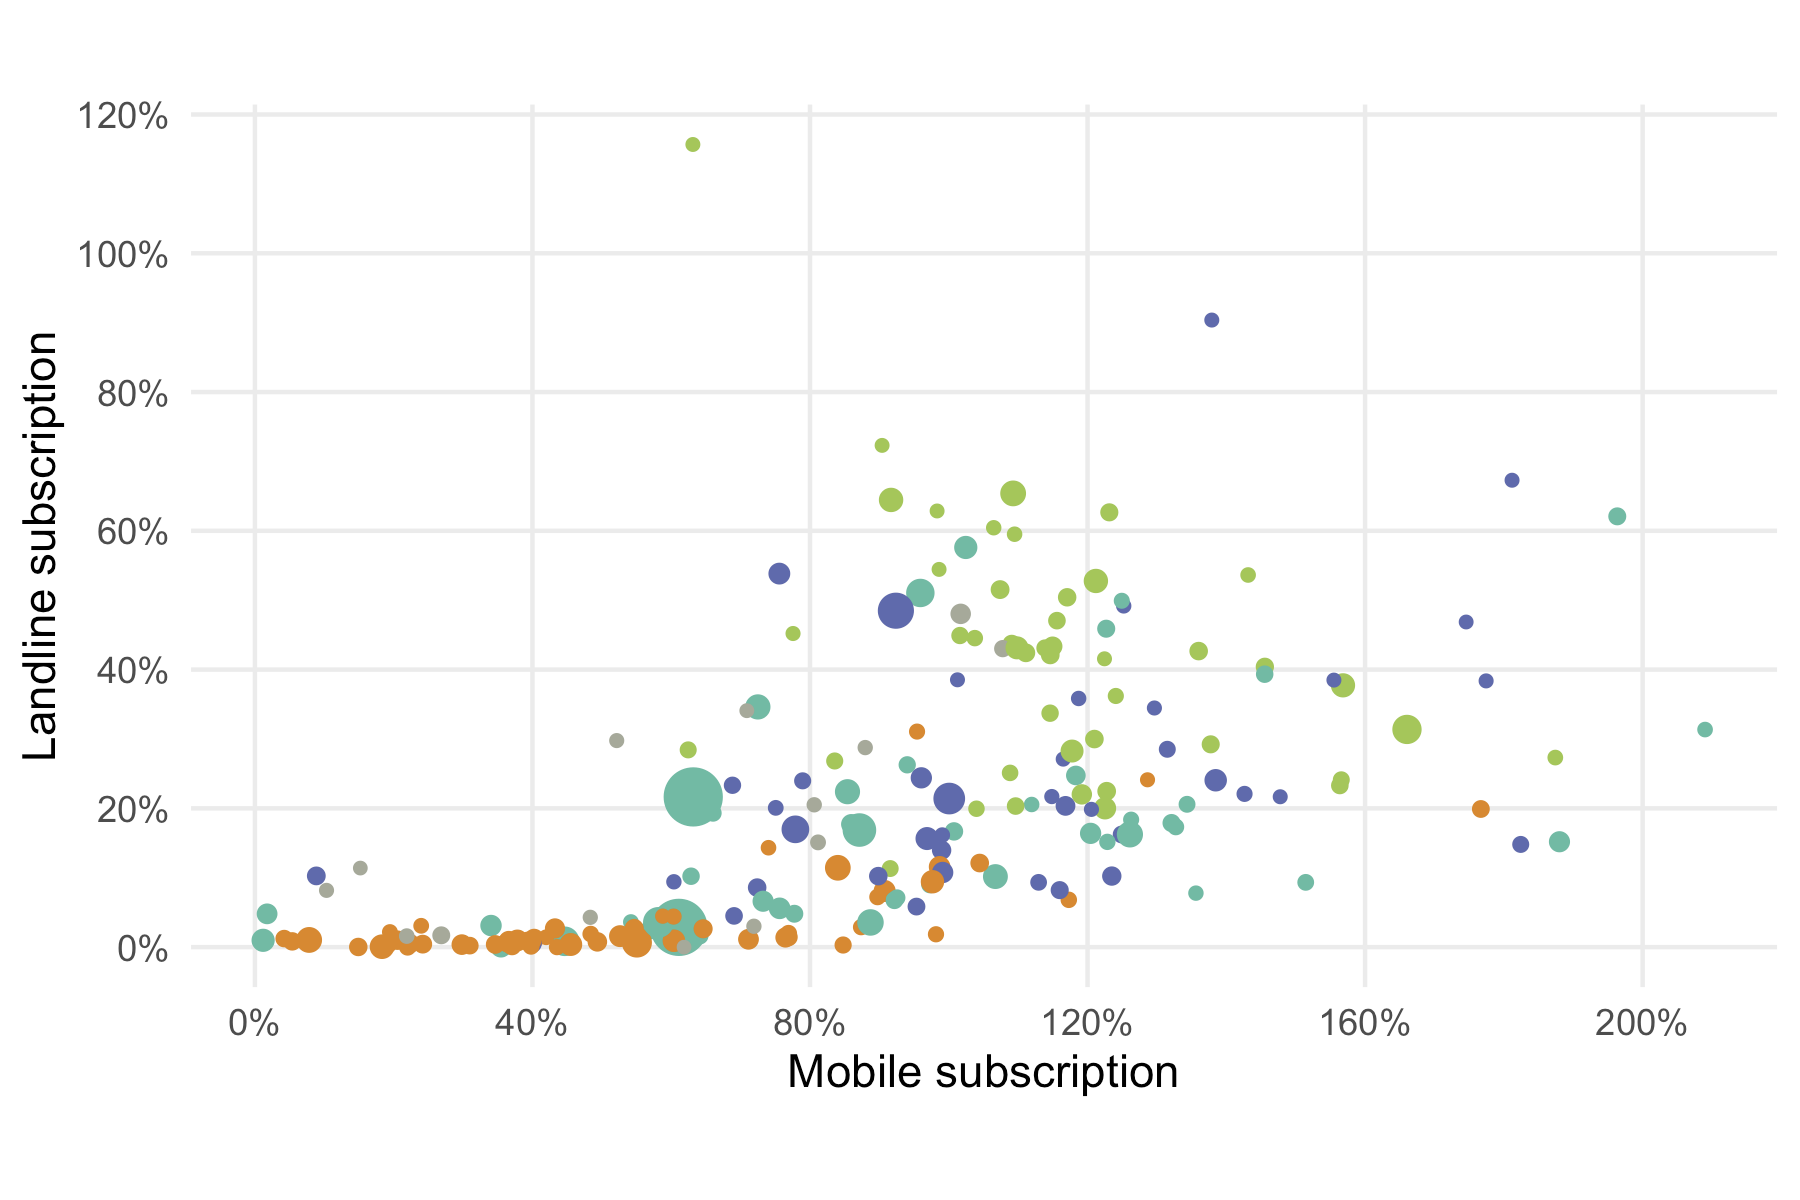
%>% {.}scale_y_continuous(
breaks = seq(0, 1, 0.2),
labels = scales::percent_format(accuracy = 0.1),
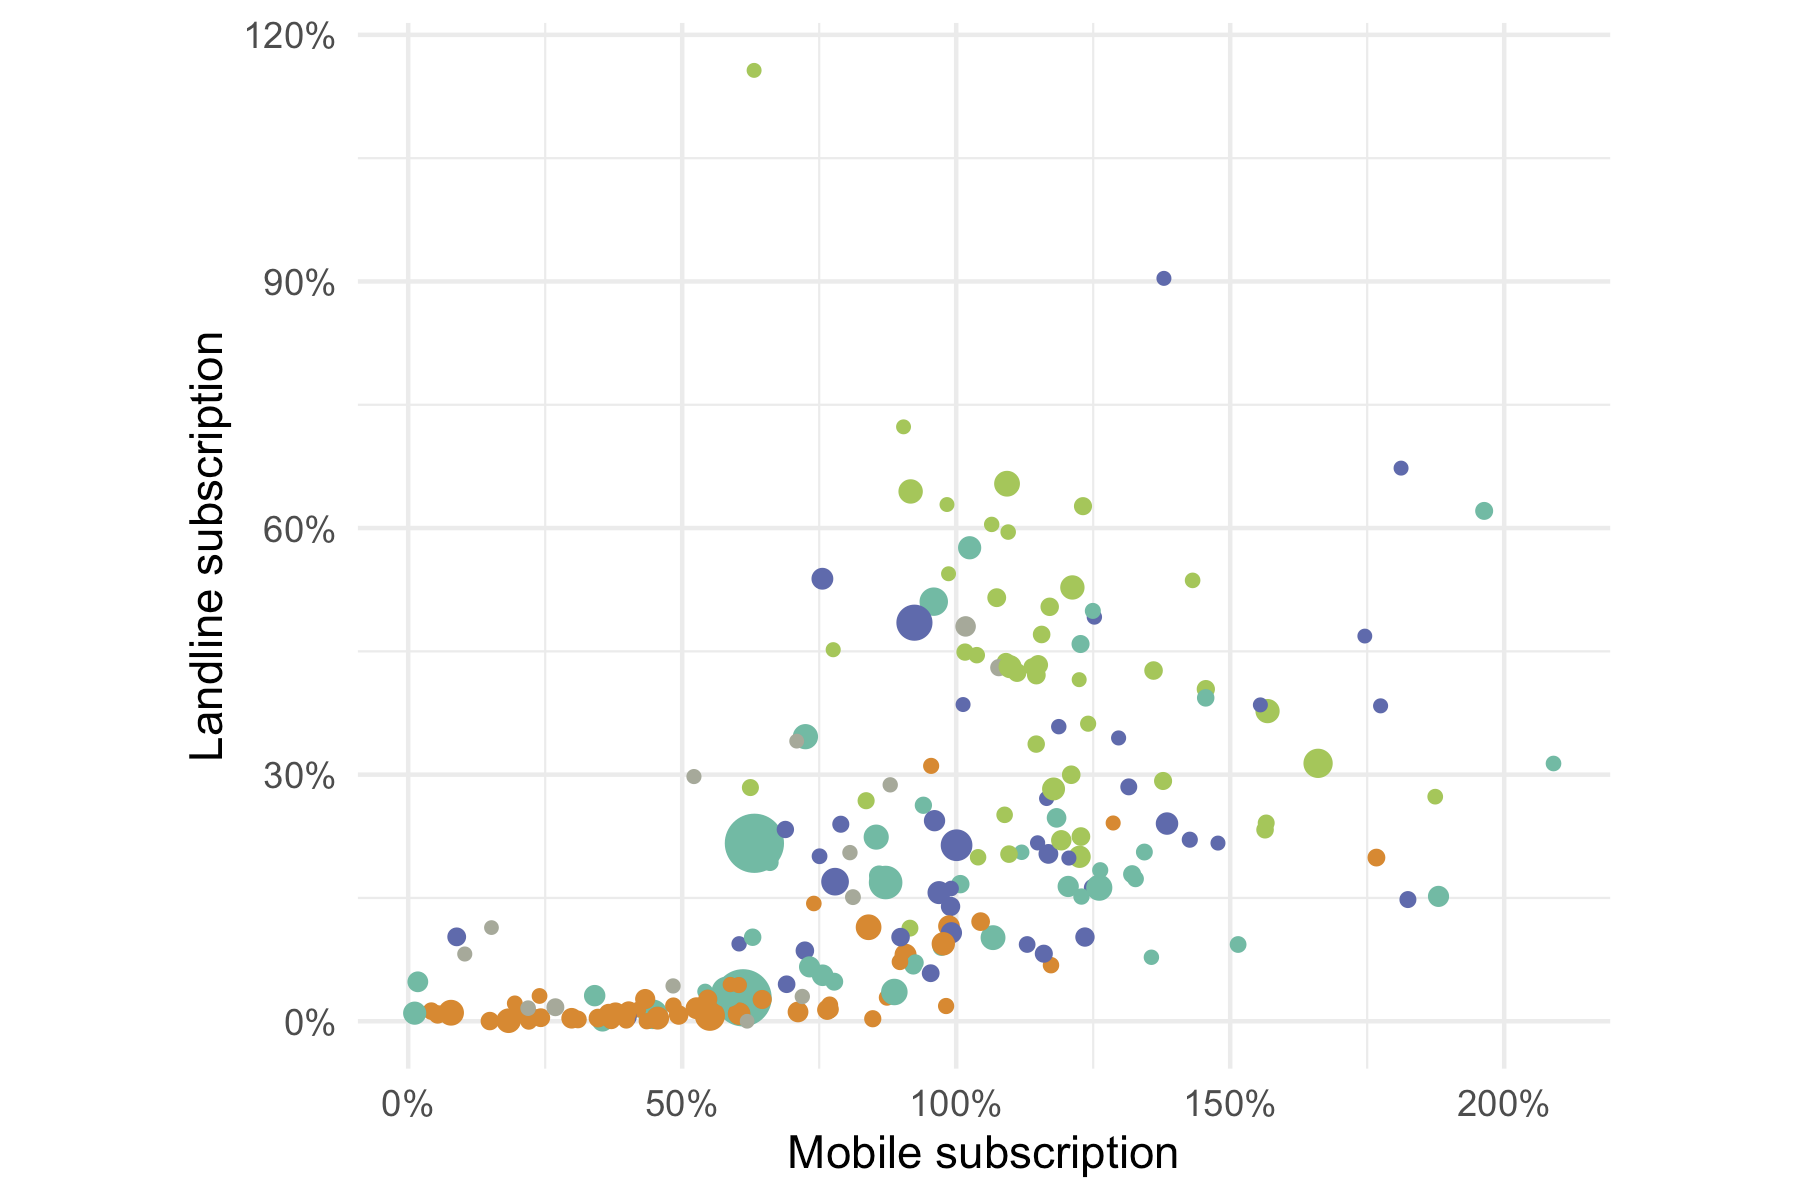
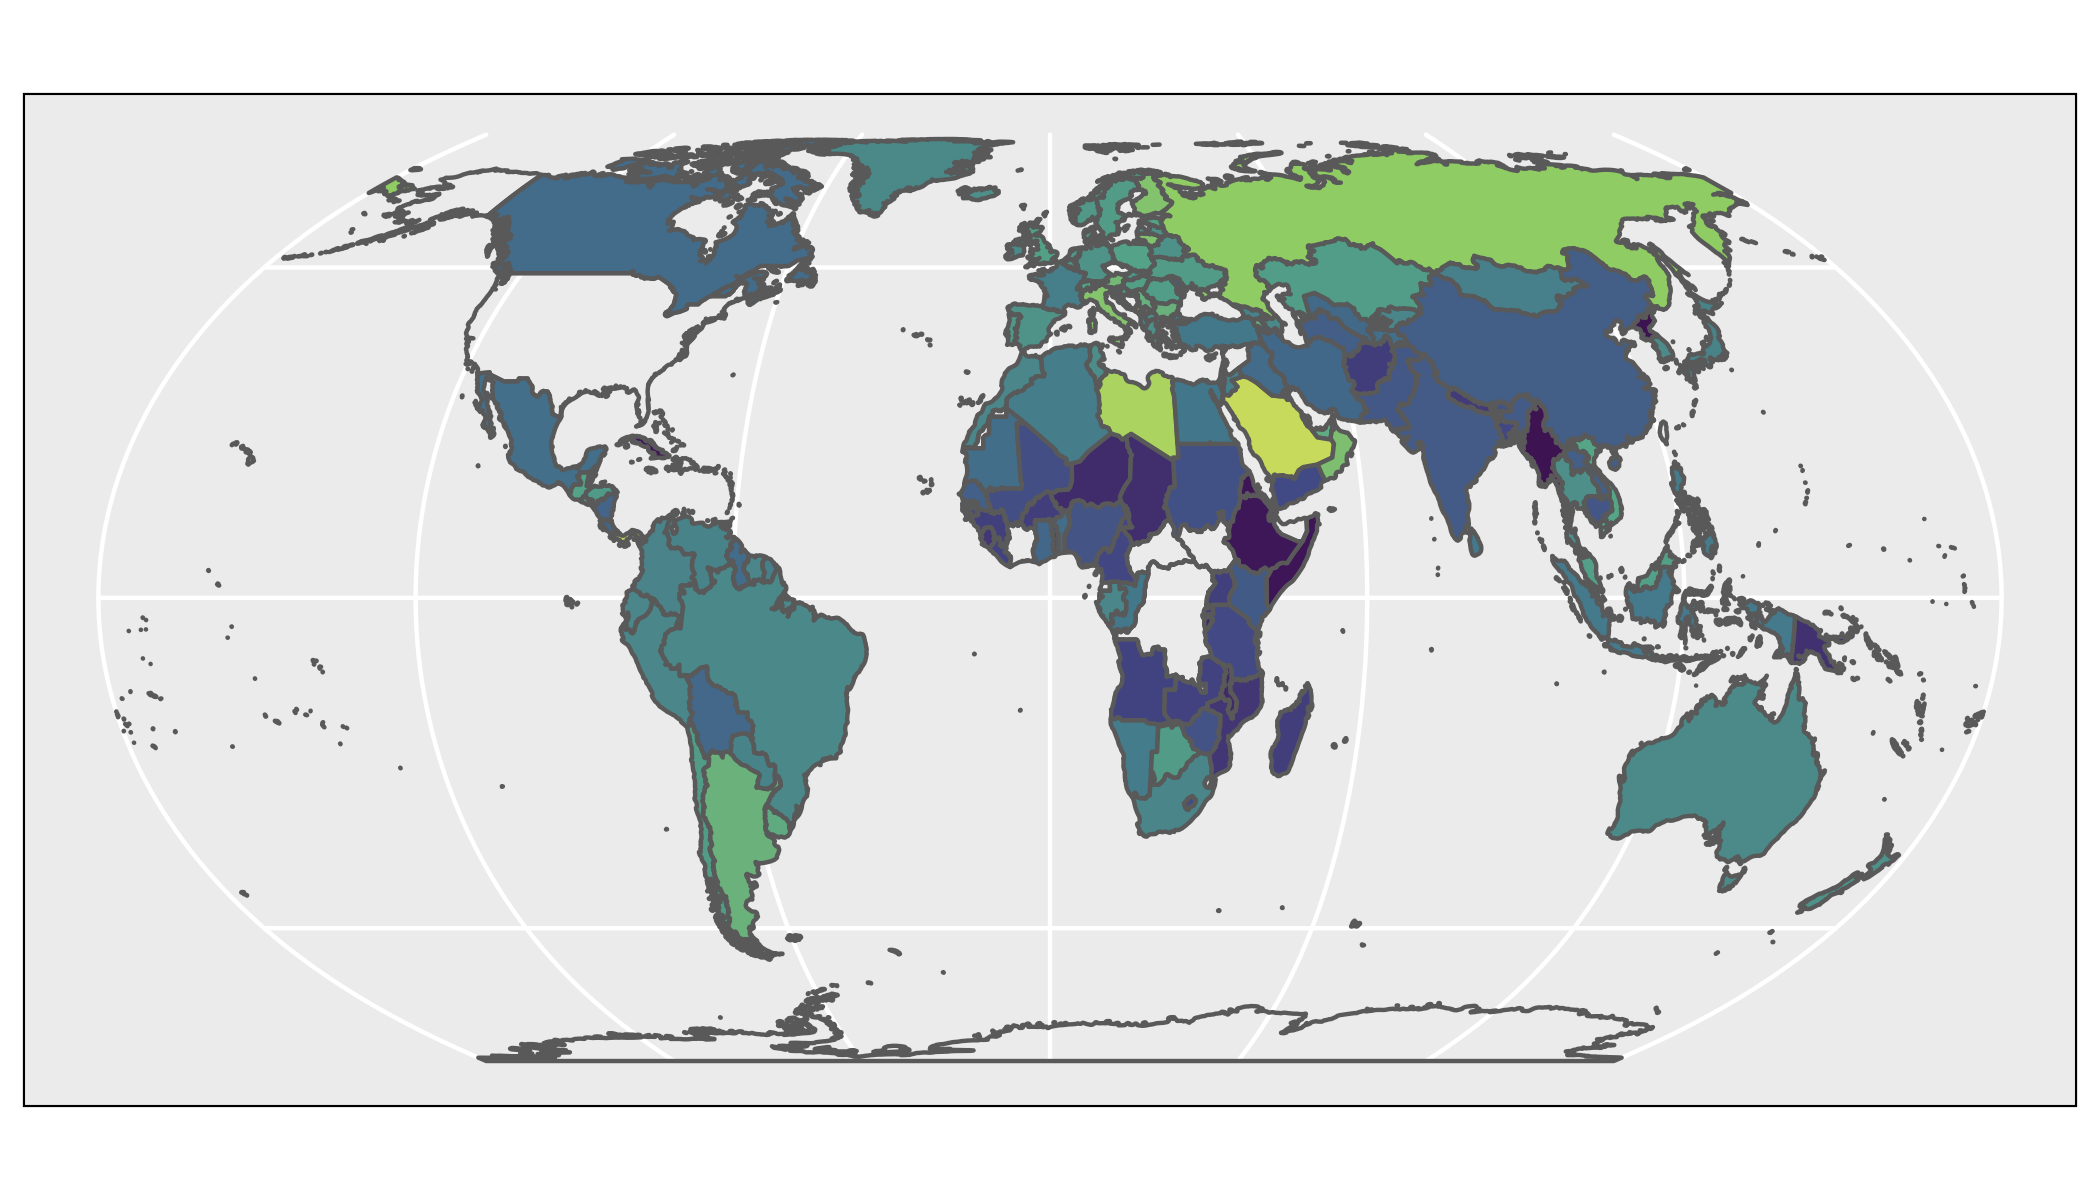
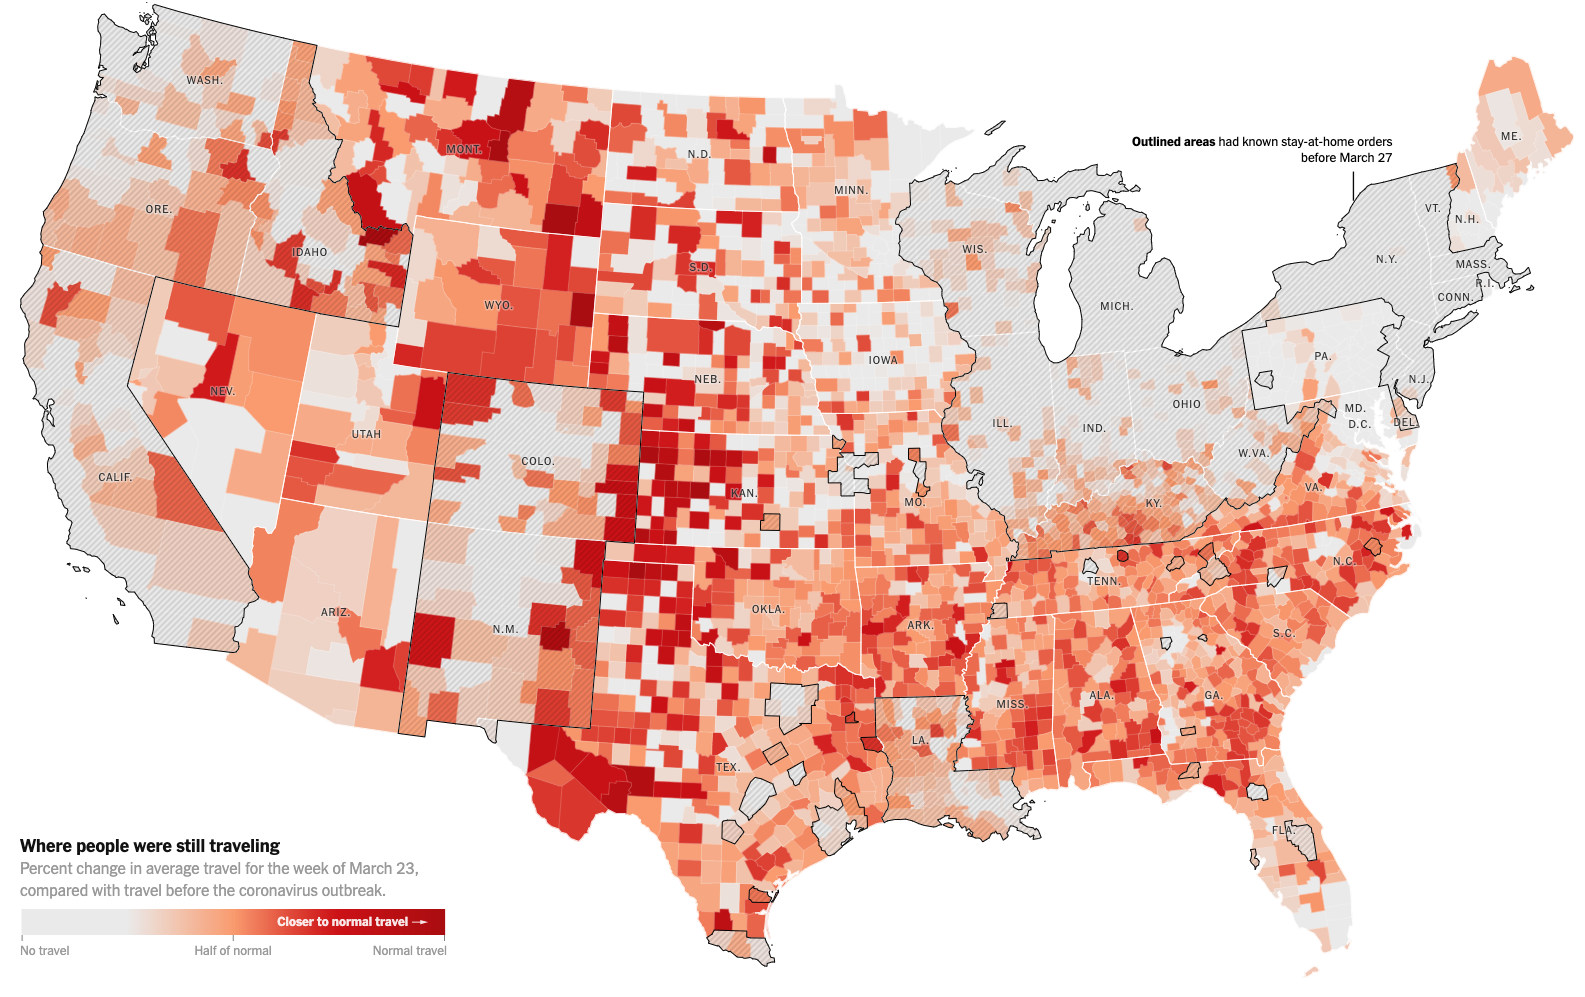
expand = expansions(mult = c(0, .1)))+ coord_fixed(ratio = 1)ggplot(mobile) +
geom_sf(aes(fill = mobile_subs)) +
coord_sf(crs = "+proj=eqearth +wktext")+ labs(y = NULL, fill = NULL)+ theme(axis.title.y = element_blank(),
legend.title = element_blank())# is equivalent to
+ labs(y = '', fill = '')+ scale_fill_continuous(guide = FALSE)+ guides(fill = FALSE)# is equivalent to
+ guides(fill = "none")+ scale_fill_continuous(guide = "none")# Setting the limits with the scale discards
# all data outside the range.
lims(x = c(20, NA), y = c(NA, 40))
# As of June 2019, this is allowed (and recommended)
coord_cartesian(xlim = c(20, NA), ylim = c(NA, 40))# Setting the limits with the scale discards
# all data outside the range.
lims(x = c(20, NA), y = c(NA, 40))
# As of June 2019, this is allowed (and recommended)
coord_cartesian(xlim = c(20, NA), ylim = c(NA, 40))geom_col()geom_bar()geom_histogram()geom_point()geom_count()geom_jitter()jitters both in the x and y direction by defaults
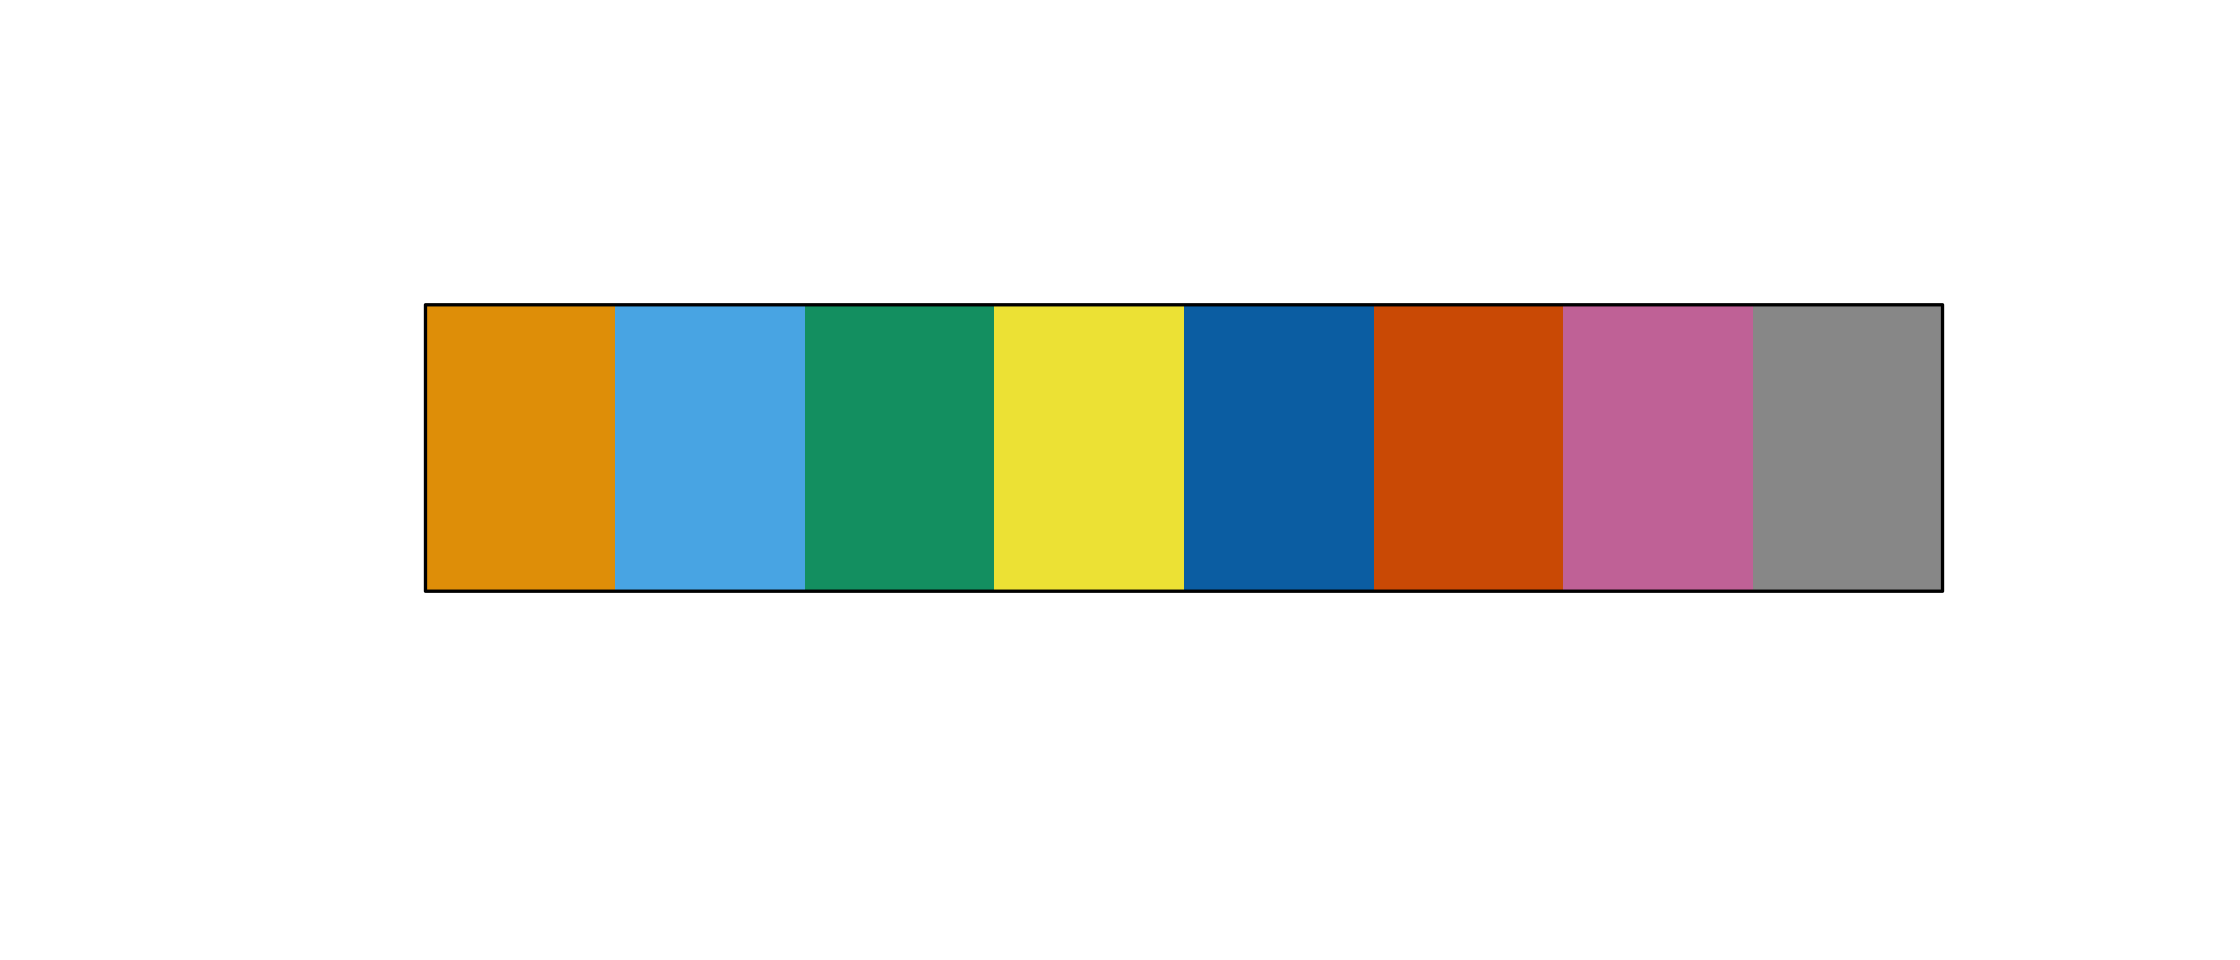
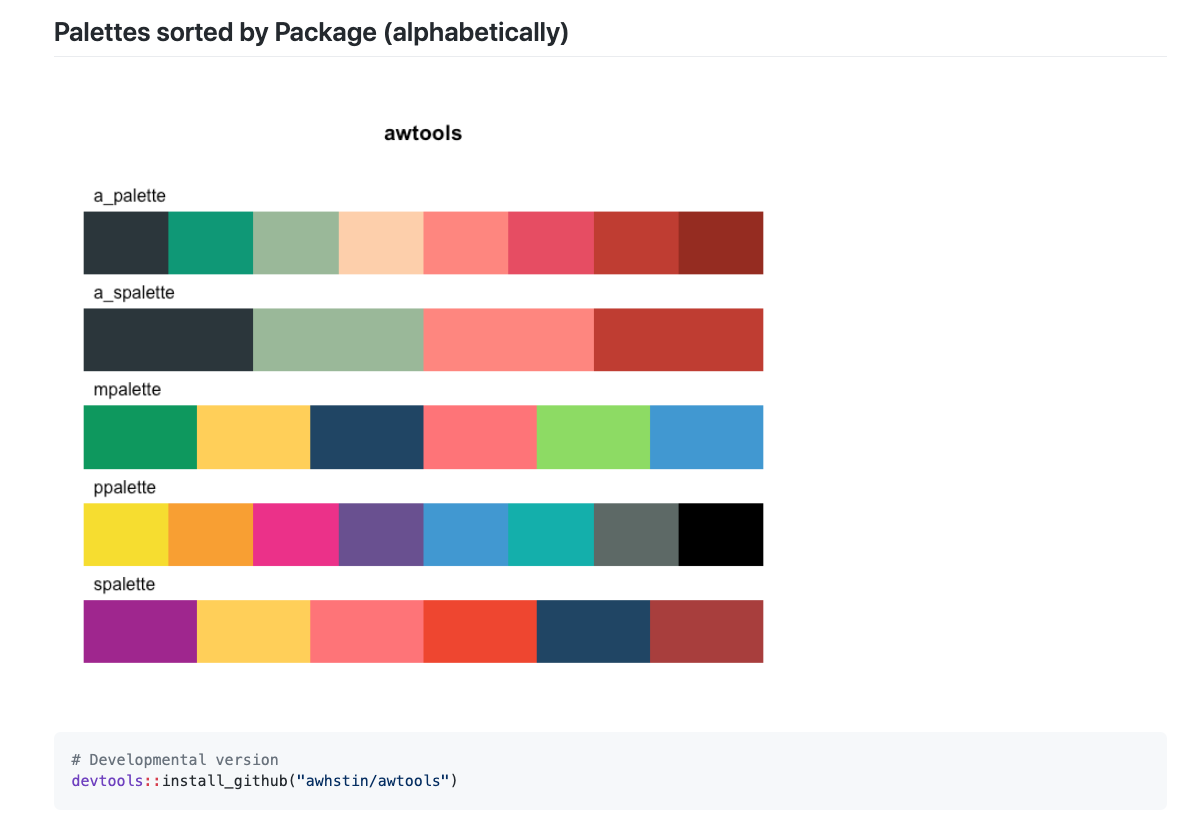
+ scale_color_viridis_c()filld+ colorblindr::scale_fill_OkabeIto()+ rcolorcarto::scale_color_carto_d()Tools → Global Options → R Markdown:
uncheck Show output inline
http://mkweb.bcgsc.ca/
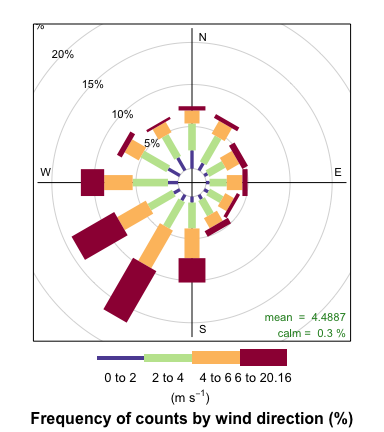
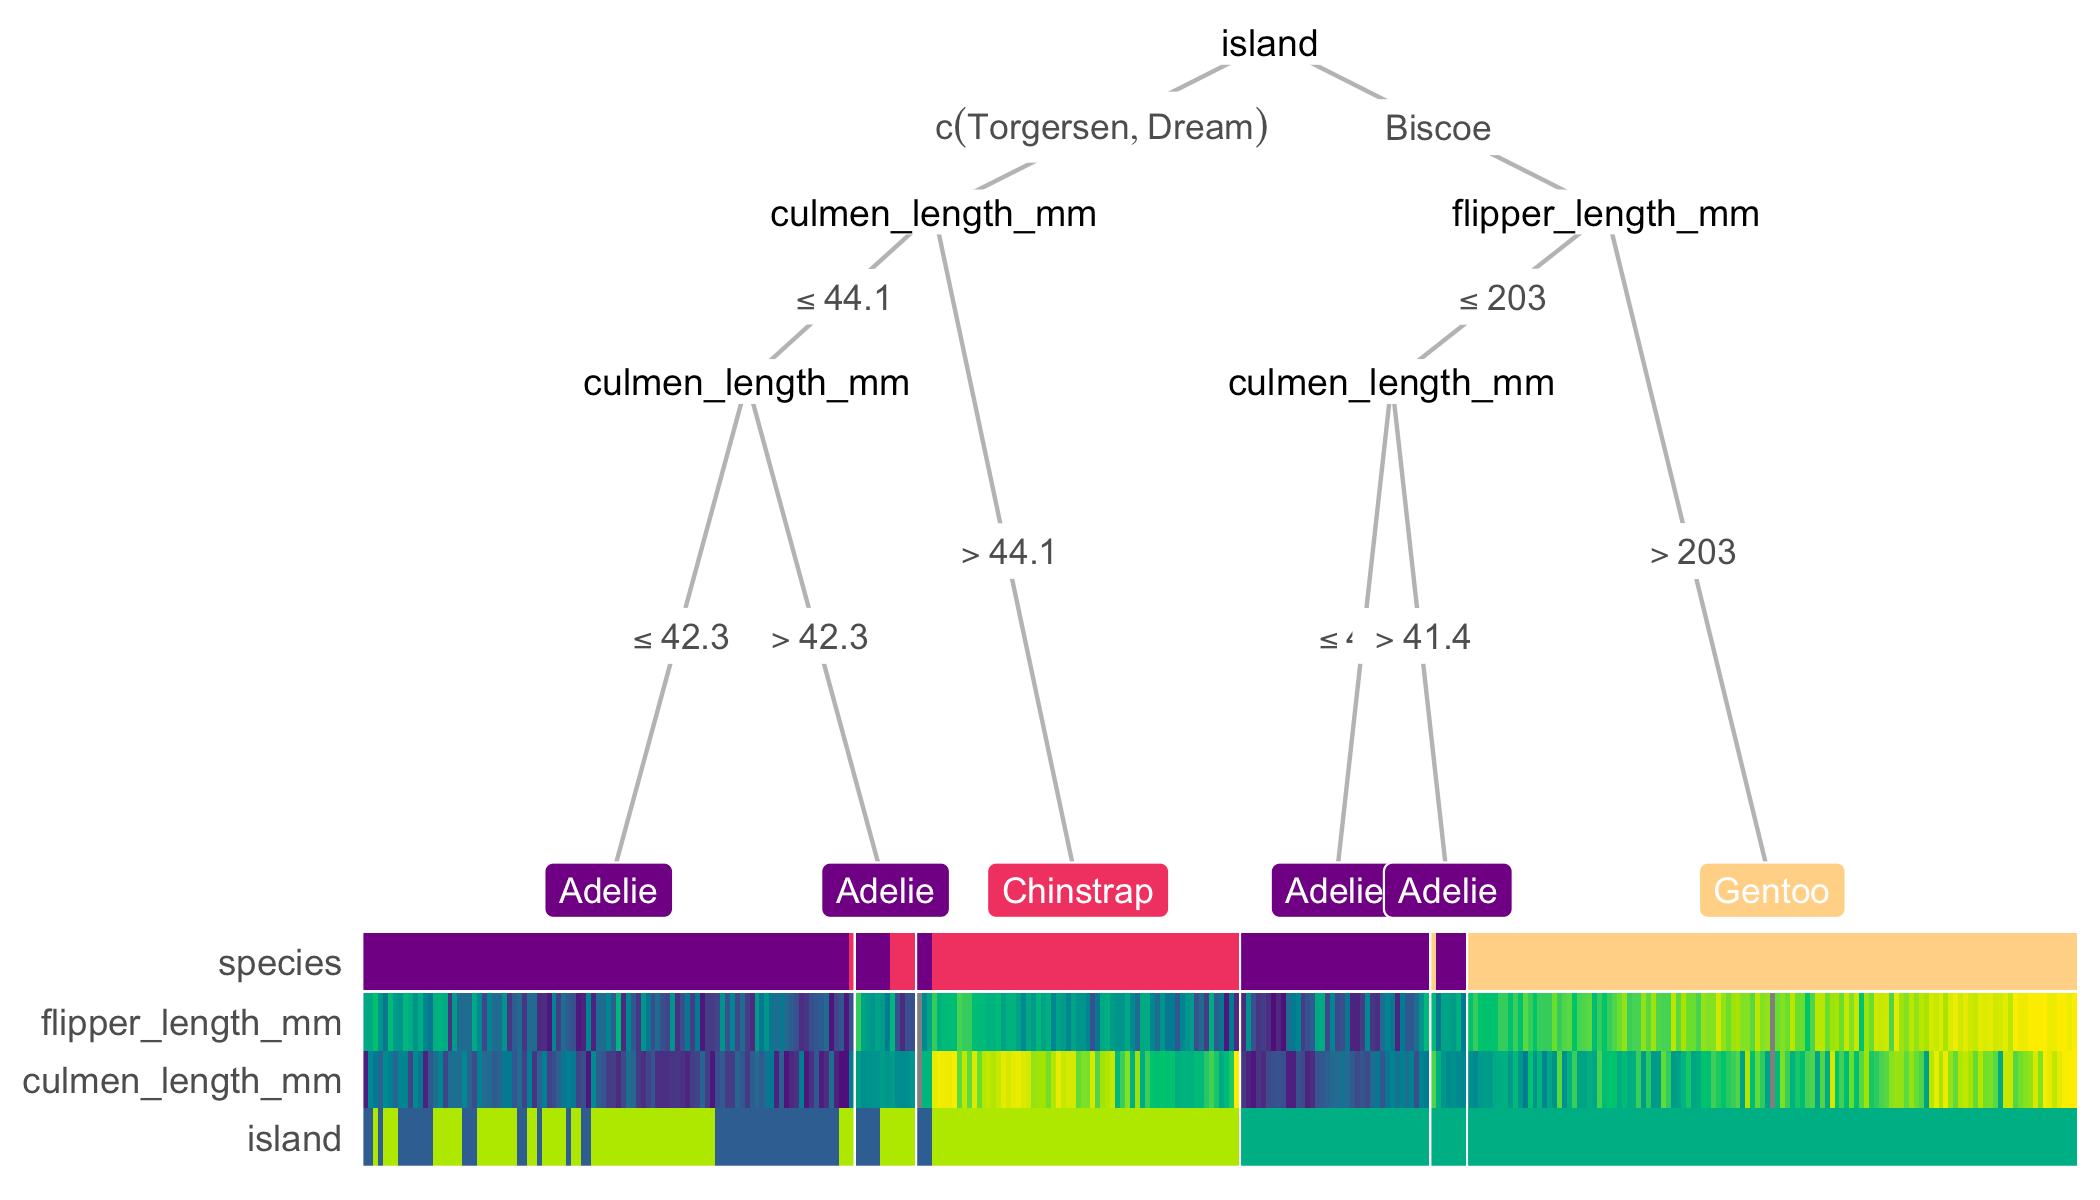
windRose(openair_data)library(treeheatr)
heat_tree(penguins, target_lab = 'species')By Trang Le
Miscellaneous collection of visualizations for academic papers.


