Lesson 4
Interactivity in Visual Analytics: Principles and Methods

ISSS608 Visual Analytics and Applications
-
Aptitudes and Attitudes of effective visual analytics
-
Interactive analytics techniques
-
The concept of linked multiple views
-
Principles for animation and a taxonomy of transition types
-
Design consideration for animated data visualisation
ISSS608 Visual Analytics and Applications
Lesson 4: Interactivity in Visual Analytics
What will you learn from this lesson?
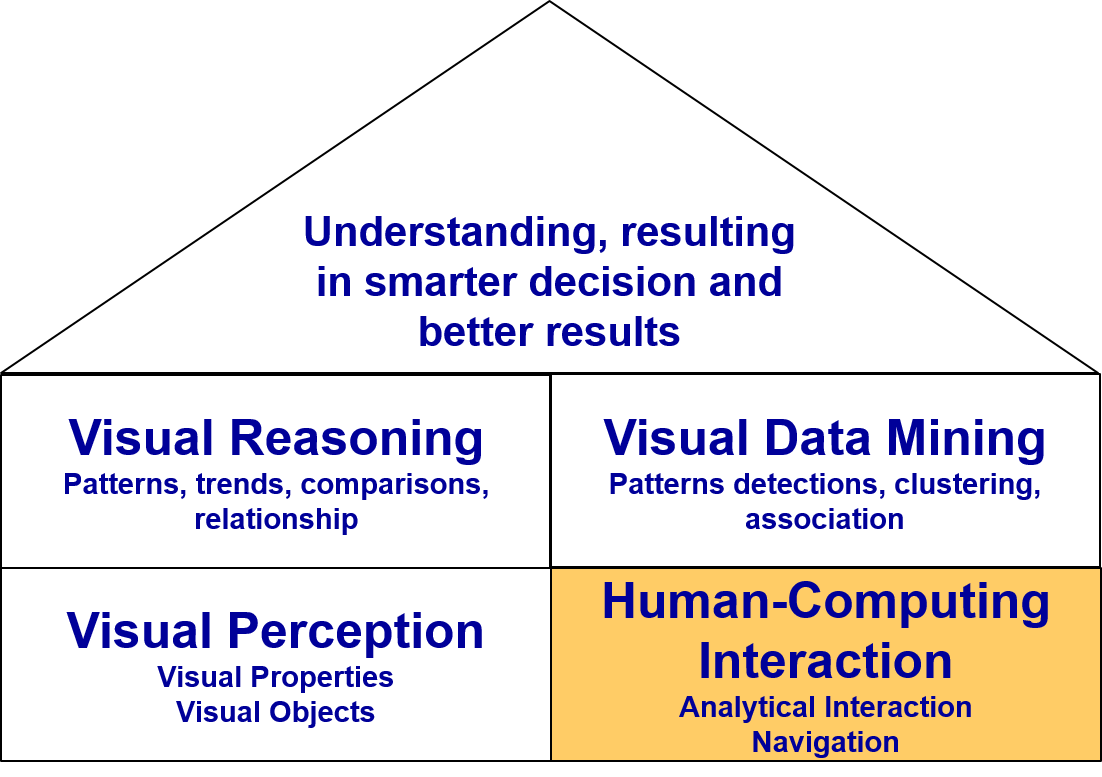
Building Block of Visual Analytics
ISSS608 Visual Analytics and Applications
Lesson 4: Interactivity in Visual Analytics
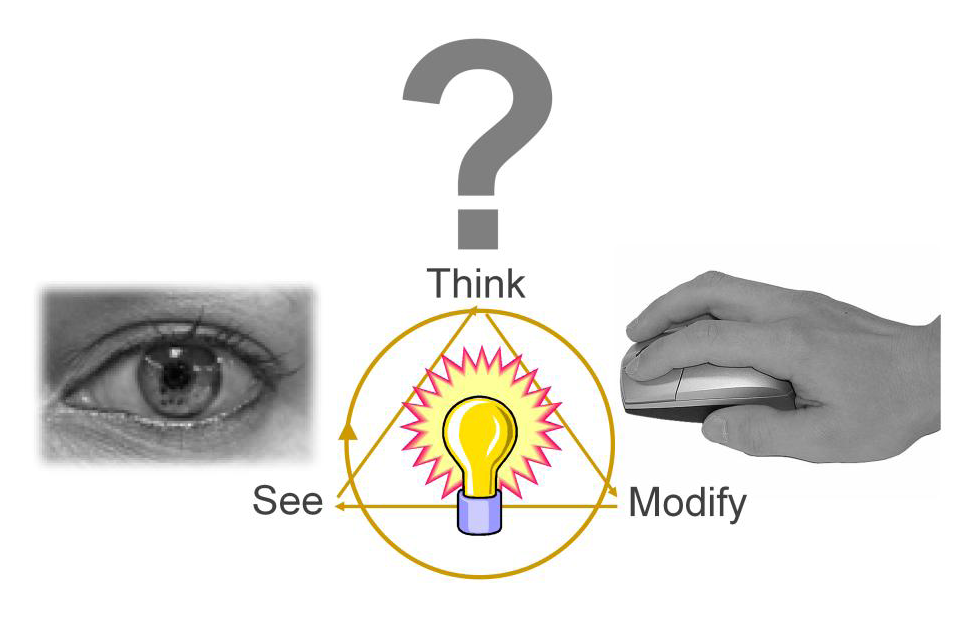
Visual Analytics Framework
ISSS608 Visual Analytics and Applications
Lesson 4: Interactivity in Visual Analytics
Interactive Analytical Best Practices
“Overview first,
zoom and filter,
then details-on-demand”
Shneiderman’s mantra:
ISSS608 Visual Analytics and Applications
Lesson 4: Interactivity in Visual Analytics
-
Simplify - good data visualization captures the essence of data - without oversimplifying.
-
Compare - we can't hold the details of our data visualizations in our memory - shift the burden of effort to our eyes.
-
Attend - the tool needs to make it easy for us to attend to the data that's really important.
-
Explore – a visualization tools not just to answer a specific question, but to explore data and discover things.
Visual Analytics Skills
ISSS608 Visual Analytics and Applications
Lesson 4: Interactivity in Visual Analytics
-
View Diversely - to be able to look at the same data from different perspectives at the same time and see how they fit together.
-
Ask why - more than knowing "what's happening", we need to know "why it's happening".
-
Be skeptical - to ask more questions, as fast as we can think of them.
-
Respond - to share our data that leads to global enlightenment.
Visual Analytics Skills
ISSS608 Visual Analytics and Applications
Lesson 4: Interactivity in Visual Analytics
7 General Categories of Interaction Techniques
- Select: mark something as interesting
- Explore: show me something else
- Reconfigure: show me a different arrangement
- Encode: show me a different representation
- Abstract/Elaborate: show me more or less detail
- Filter: show me something conditionally
- Connect: show me related items
ISSS608 Visual Analytics and Applications
Lesson 4: Interactivity in Visual Analytics
Selection Functions
-
Pointer selects a single object in a plot.
-
Drag-box selects a rectangular region in a box.
-
Brush is a generalisation of the drag-box. Once a rectangular region is define, the brush allows users to move that region across a plot and thus dynamically change the selected subset.
-
Slicer is an axis-parallel selection tool, which selects a range along an axis, where the end-point of the interval can be modified dynamically.
-
Lasso allows users to define an arbitrary contiguous shape to select data.
ISSS608 Visual Analytics and Applications
Lesson 4: Interactivity in Visual Analytics
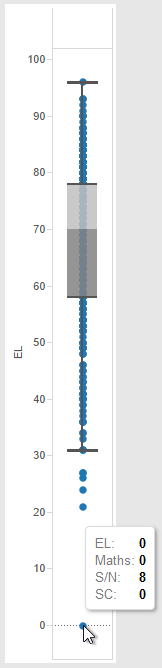
Selection: Pointer
-
Pointer selects a single object in a plot.

ISSS608 Visual Analytics and Applications
Lesson 4: Interactivity in Visual Analytics
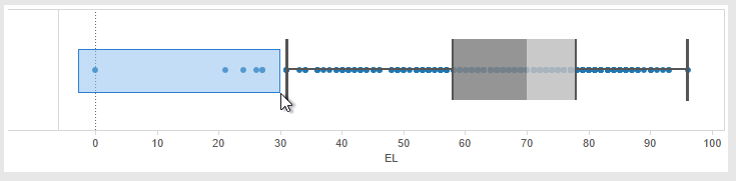
Selection: Brush
-
Selecting a group of data points.
ISSS608 Visual Analytics and Applications
Lesson 4: Interactivity in Visual Analytics
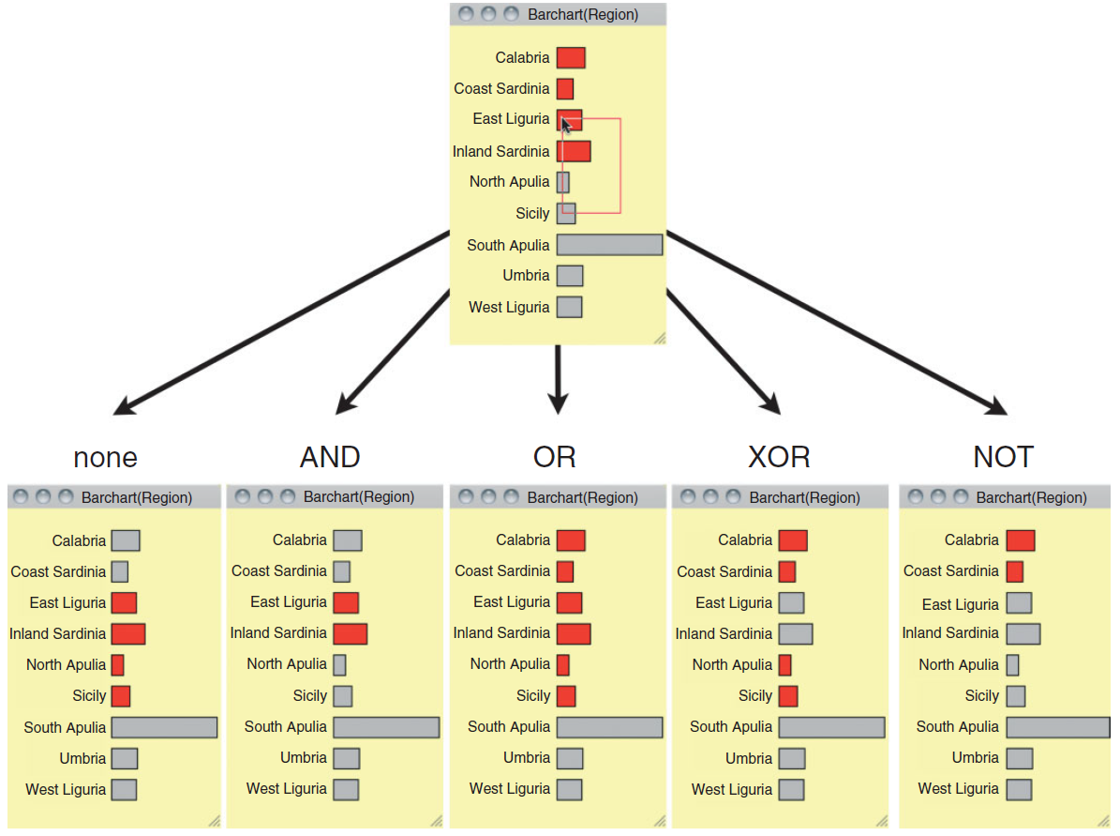
Selection Modes
-
Selecting a group of data points.
ISSS608 Visual Analytics and Applications
Lesson 4: Interactivity in Visual Analytics
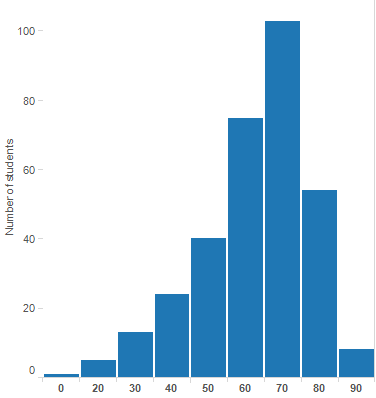
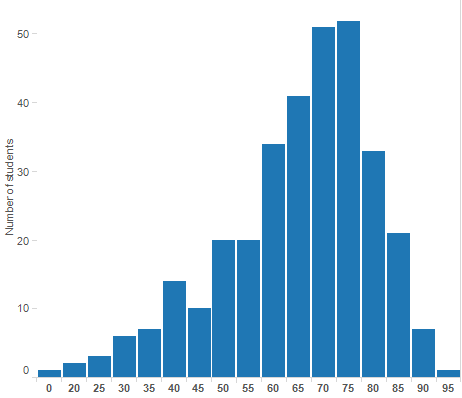
Explore
-
Change the data bin dynamically
ISSS608 Visual Analytics and Applications
Lesson 4: Interactivity in Visual Analytics
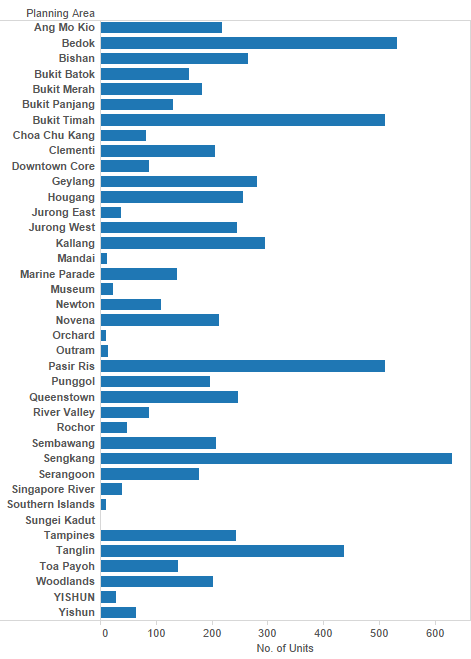
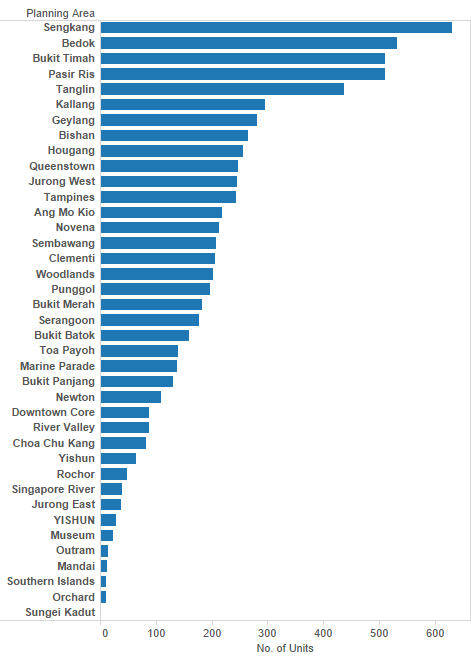
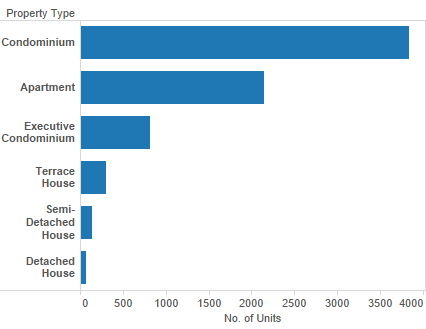
Reconfigure
-
Sorting the bars by numbers of unit sold
ISSS608 Visual Analytics and Applications
Lesson 4: Interactivity in Visual Analytics
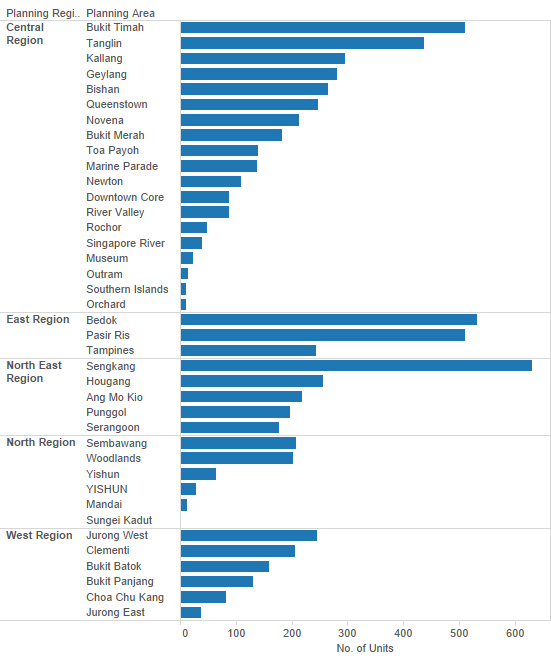
Reconfigure
-
Adding variables
ISSS608 Visual Analytics and Applications
Lesson 4: Interactivity in Visual Analytics
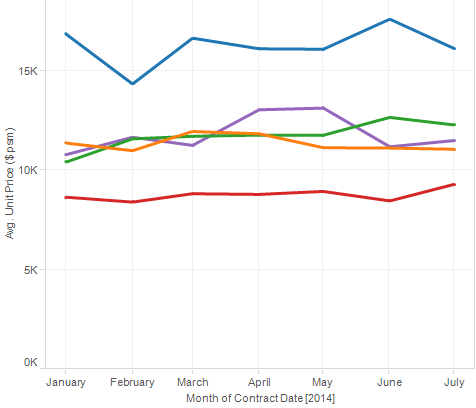
Reconfigure
- Aggregation
ISSS608 Visual Analytics and Applications
Lesson 4: Interactivity in Visual Analytics
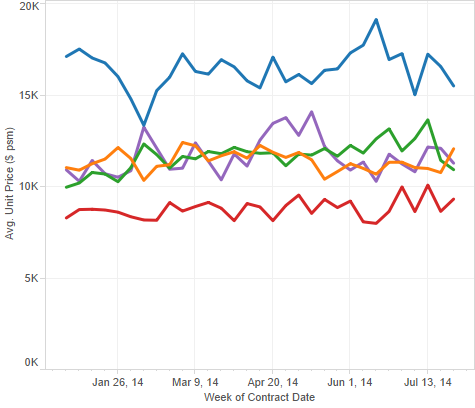
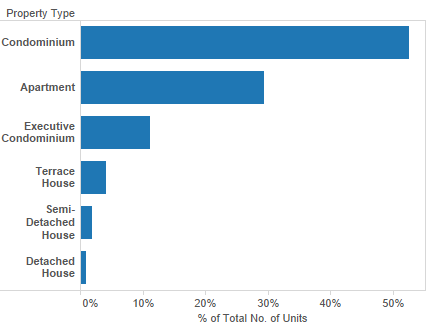
Reconfigure
-
Re-expressing
ISSS608 Visual Analytics and Applications
Lesson 4: Interactivity in Visual Analytics
Reconfigure
-
Jittering
Without jitter
With jitter
ISSS608 Visual Analytics and Applications
Lesson 4: Interactivity in Visual Analytics
Highlighting
-
Selected records are highlighted
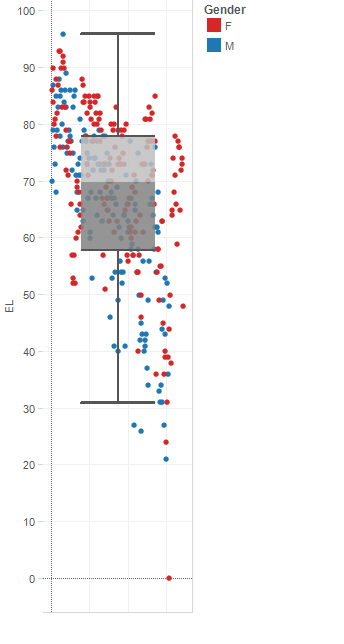
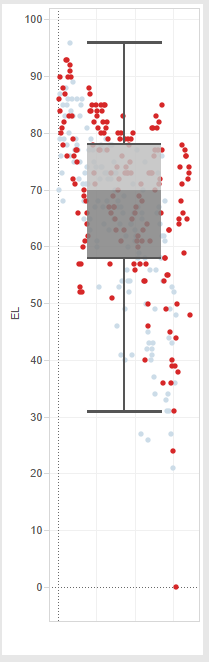
With female selected
ISSS608 Visual Analytics and Applications
Lesson 4: Interactivity in Visual Analytics
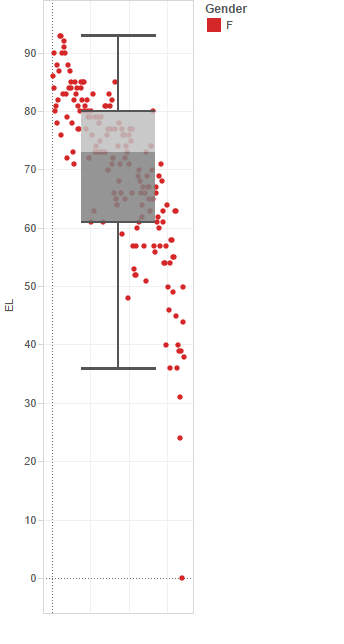
Filter
-
Non-selected records are excluded in the graph

ISSS608 Visual Analytics and Applications
Lesson 4: Interactivity in Visual Analytics
IS428 Visual Analytics for Business Intelligence
Lesson 4: Interactivity in Visual Analytics
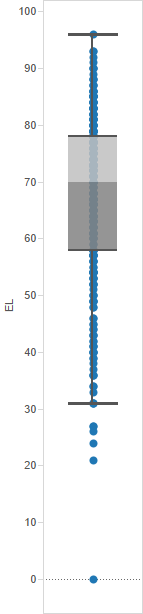
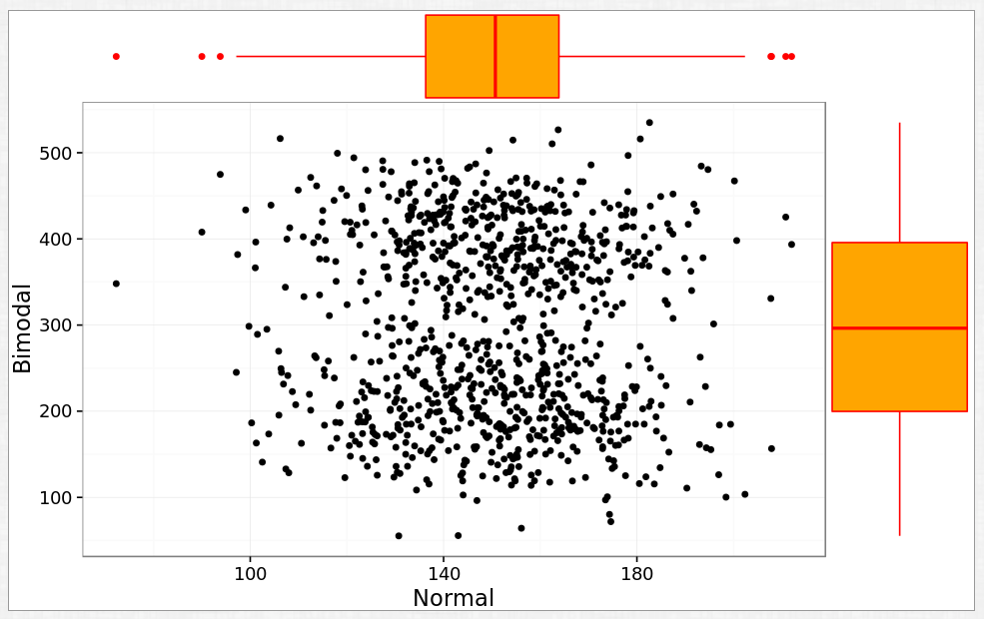
Multiple Views without interactice link
-
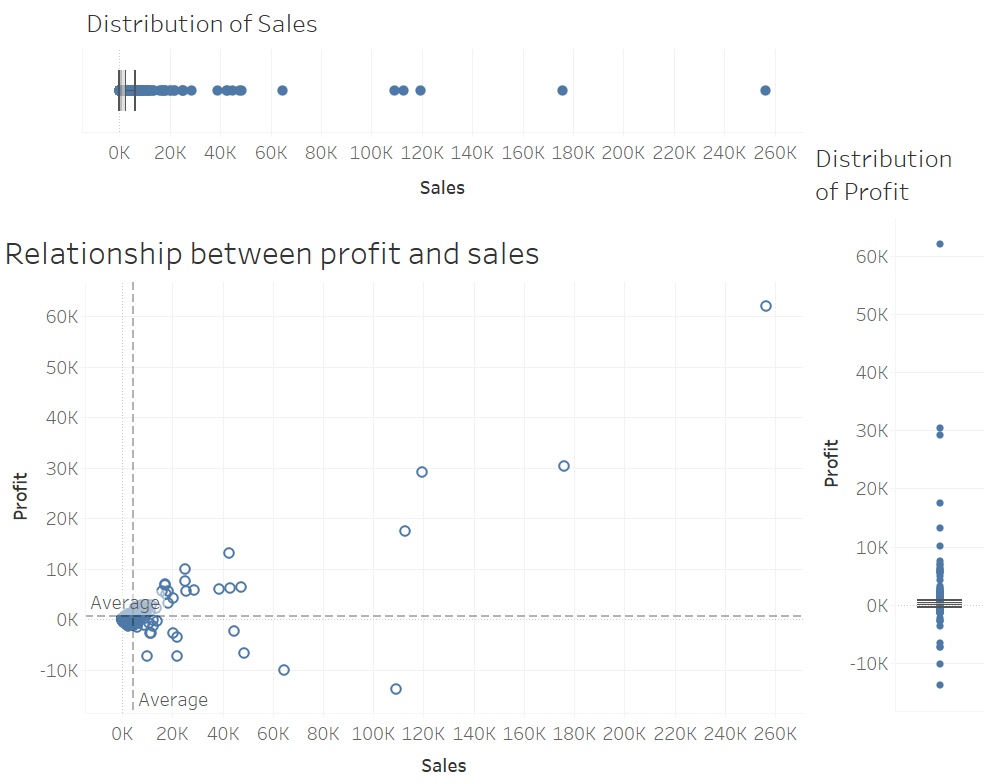
Scatterplot with marginal boxplots
IS428 Visual Analytics for Business Intelligence
Lesson 4: Interactivity in Visual Analytics
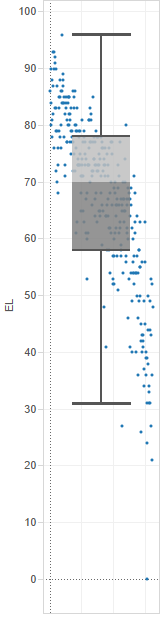
Connection: Linked Multiple Views
-
Scatterplot with marginal boxplots
Interactive Visual Analytics Design Model
Reference: Roth, R.E. (2012) “Cartographic Interaction Primitive: Framework and Synthesis”. The Cartographic Journal, Vol. 49, No. 4 pp. 376-395.
ISSS608 Visual Analytics and Applications
Lesson 4: Interactivity in Visual Analytics
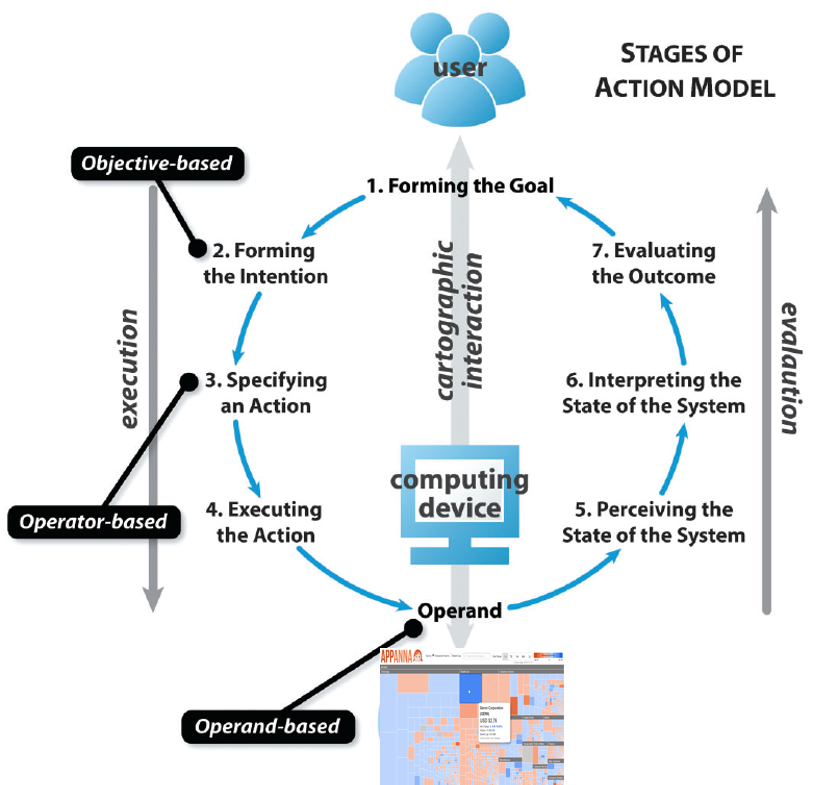
Interactive Visual Analytics Design Model
Reference: Roth, R.E. (2012) “Cartographic Interaction Primitive: Framework and Synthesis”. The Cartographic Journal, Vol. 49, No. 4 pp. 376-395.
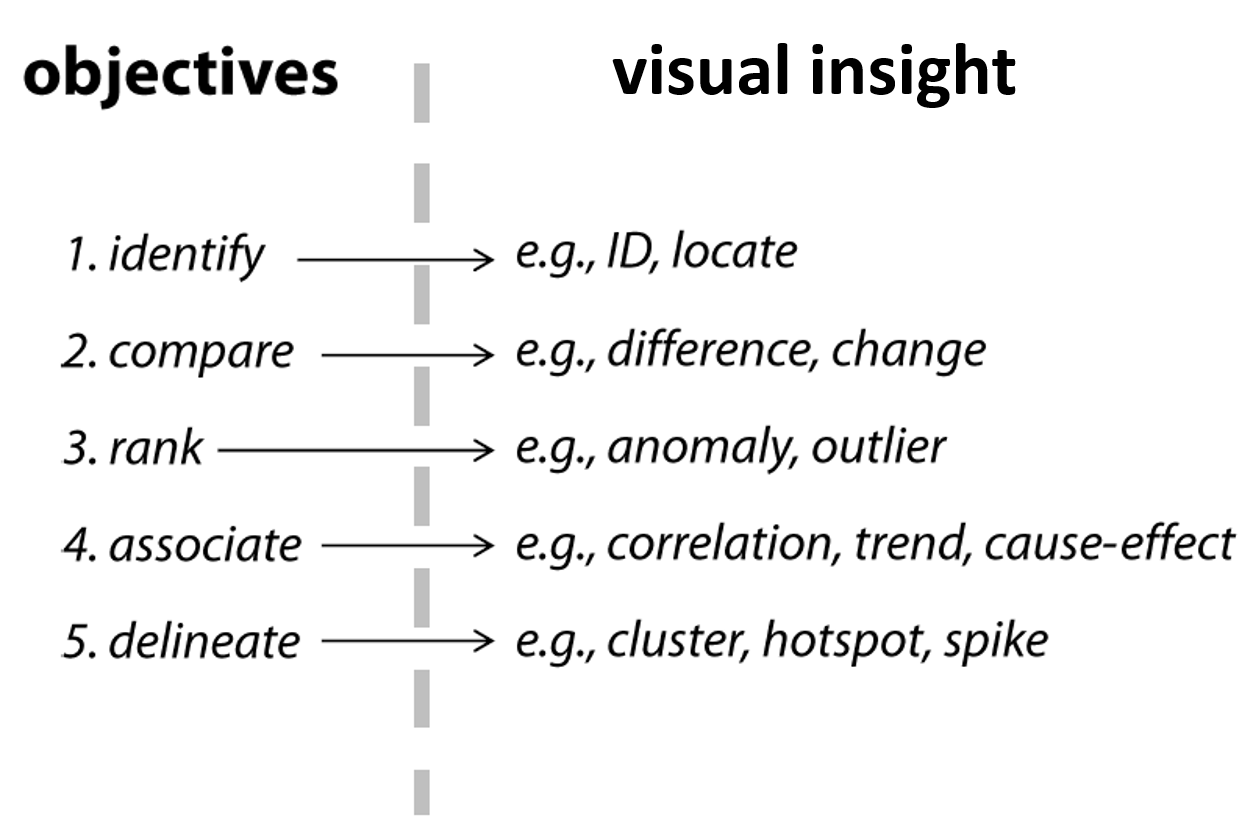
- Visual Analytics Objective Primitives
ISSS608 Visual Analytics and Applications
Lesson 4: Interactivity in Visual Analytics
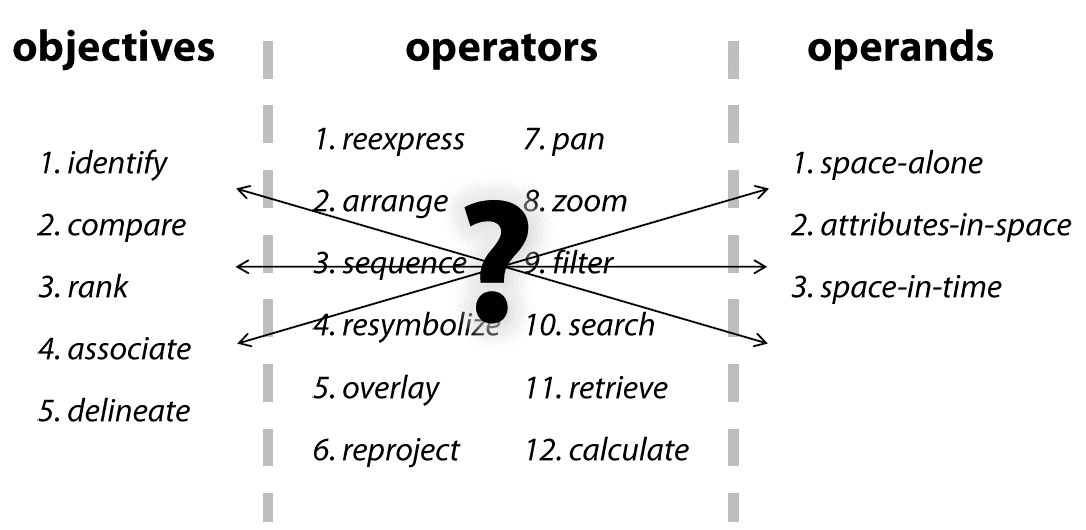
Interactive Visual Analytics Design Model
Reference: Roth, R.E. (2012) “Cartographic Interaction Primitive: Framework and Synthesis”. The Cartographic Journal, Vol. 49, No. 4 pp. 376-395.
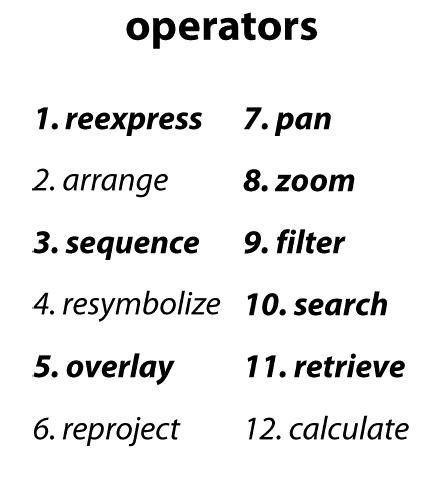
- Interactive Analytics Operator Primitives
ISSS608 Visual Analytics and Applications
Lesson 4: Interactivity in Visual Analytics
Interactive Visual Analytics Design Model
Reference: Roth, R.E. (2012) “Cartographic Interaction Primitive: Framework and Synthesis”. The Cartographic Journal, Vol. 49, No. 4 pp. 376-395.
- The syntactic of interaction primitives
ISSS608 Visual Analytics and Applications
Lesson 4: Interactivity in Visual Analyticss
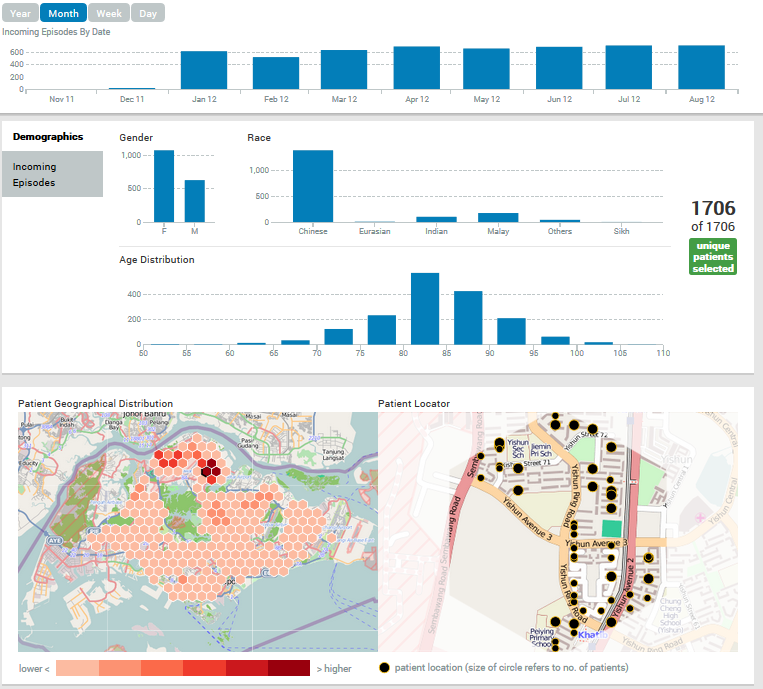
Interactive Visual Analytics Application I
-
Visually-driven Patient Record Dashboard
ISSS608 Visual Analytics and Applications
Lesson 4: Interactivity in Visual Analytics
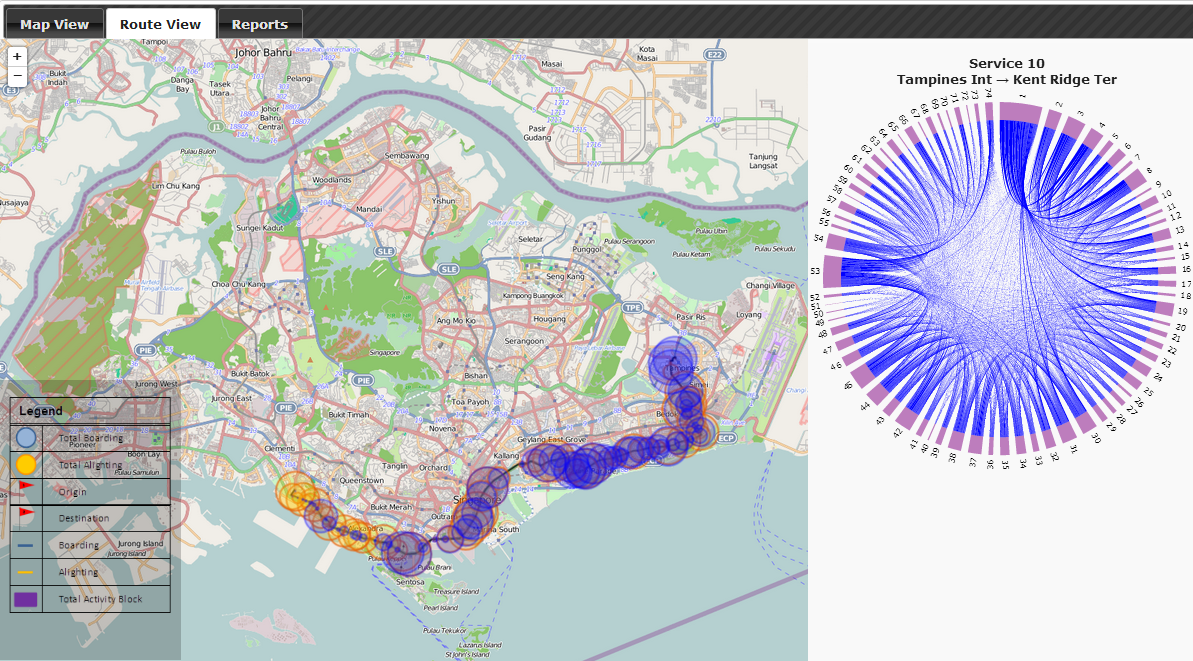
Interactive Visual Analytics Application II
-
TPAS: Transport Passengers Analysis System
ISSS608 Visual Analytics and Applications
Lesson 4: Interactivity in Visual Analytics
Animation in Visual Analytics
-
To facilitating perception of changes when transitioning between related data graphics
-
Do not confine to time-series data only
-
Motion is highly effective at attracting attention
-
Animation facilitates object constancy for changing objects
-
Animated behaviours can give rise to perceptions of causality and intentionality, communicating cause-and-effect relationships and establishing narrative
-
Animation can be emotionally engaging, engendering increased interest or enjoyment
ISSS608 Visual Analytics and Applications
Lesson 4: Interactivity in Visual Analytics
There is also ChartJunk in Animated Data Graphics
ISSS608 Visual Analytics and Applications
Lesson 4: Interactivity in Visual Analytics
Appropriate used of animation
ISSS608 Visual Analytics and Applications
Lesson 4: Interactivity in Visual Analytics
Principles of Animation
- Congruence principle states that “the structure and content of the external representation should correspond to the desired and content of the internal representation.
- Apprehension principle states that “the structure and content of the external representation should be readily and accurately perceived and comprehended.
Reference: Heer, J and Robertson G. (2007) Animated Transitions in Statistical data Graphics, IEEE Transactions on Visualization and Computer Graphics, Vol. 13, No. 6, 1240-1247
ISSS608 Visual Analytics and Applications
Lesson 4: Interactivity in Visual Analytics
Animation Design Considerations: Congruence
-
Maintain valid data graphics during transitions
-
Use consistent semantic-syntactic mappings
-
Respect semantic correspondence
-
Avoid ambiguity
Reference: Heer, J and Robertson G. (2007) Animated Transitions in Statistical data Graphics, IEEE Transactions on Visualization and Computer Graphics, Vol. 13, No. 6, 1240-1247
ISSS608 Visual Analytics and Applications
Lesson 4: Interactivity in Visual Analytics
Animation Design Considerations: Apprehension
-
Group similar transitions
-
Minimise occlusion
-
Maximise predictability
-
Use simple transitions
-
Use staging for complex transitions
-
Make transitions as long as needed, but no longer
Reference: Heer, J and Robertson G. (2007) Animated Transitions in Statistical data Graphics, IEEE Transactions on Visualization and Computer Graphics, Vol. 13, No. 6, 1240-1247
ISSS608 Visual Analytics and Applications
Lesson 4: Interactivity in Visual Analytics
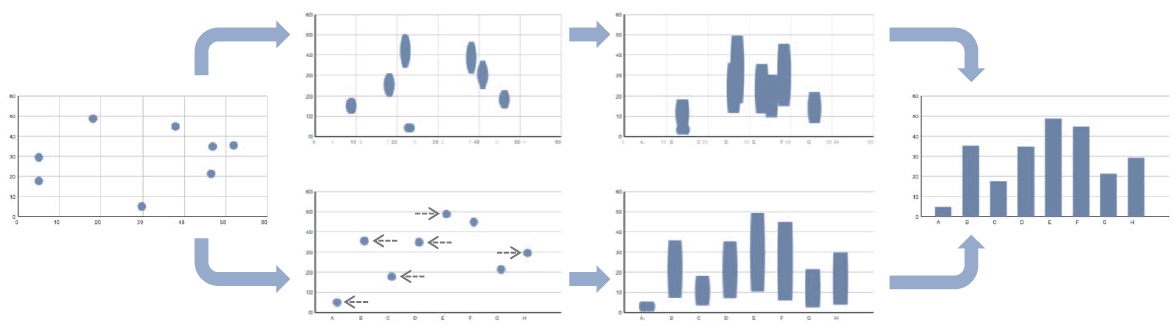
Animating from a Scatter Plot to a Bar Chart
-
The top path directly interpolates between the starting and ending states.
-
The bottom path is staged: the first stage moves points to their x-coordinates and updates the x-axis, the second stage morphs the points into bars.
Reference: Heer, J and Robertson G. (2007) Animated Transitions in Statistical data Graphics, IEEE Transactions on Visualization and Computer Graphics, Vol. 13, No. 6, 1240-1247
ISSS608 Visual Analytics and Applications
Lesson 4: Interactivity in Visual Analytics
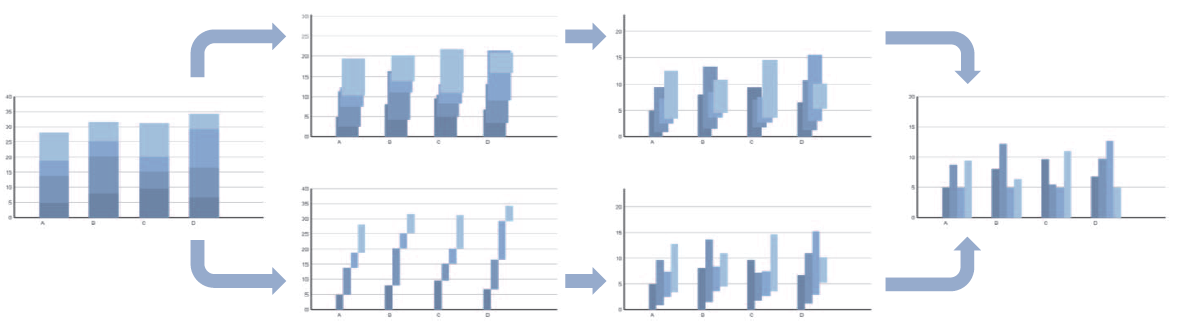
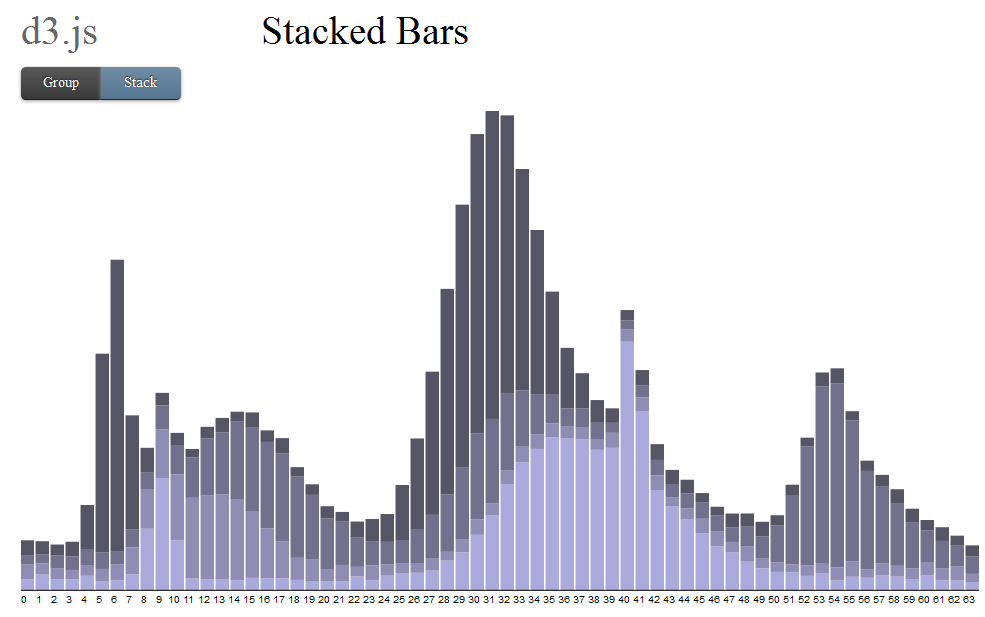
Animating from Stacked Bars to Group Bars
-
The top path directly interpolates between the starting and ending states.
-
The bottom path is staged: the first stage changes the widths and x-coordinates of bars, the second stage drops the bars down to the base line.
Reference: Heer, J and Robertson G. (2007) Animated Transitions in Statistical data Graphics, IEEE Transactions on Visualization and Computer Graphics, Vol. 13, No. 6, 1240-1247
ISSS608 Visual Analytics and Applications
Lesson 4: Interactivity in Visual Analytics
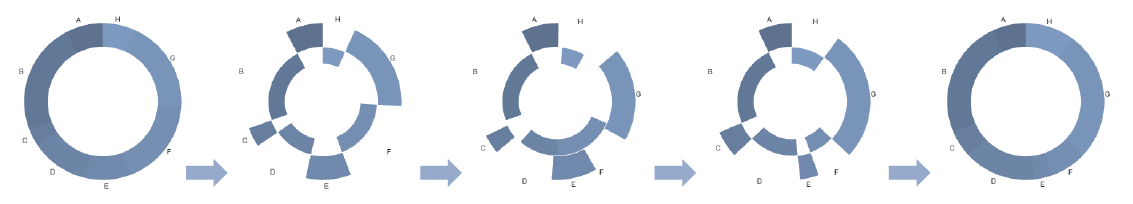
A Multi-stage Animation of Changing values in a Donut Chart
- Stage 1: Wedges split into two rings
- Stage 2: Wedges translate to be centered on their final position
- Stage 3: Wedges then update their values, changing size
- Stage 4: Wedges reunite into a single ring
Reference: Heer, J and Robertson G. (2007) Animated Transitions in Statistical data Graphics, IEEE Transactions on Visualization and Computer Graphics, Vol. 13, No. 6, 1240-1247
ISSS608 Visual Analytics and Applications
Lesson 4: Interactivity in Visual Analytics
A simple animated chart
ISSS608 Visual Analytics and Applications
Lesson 4: Interactivity in Visual Analytics
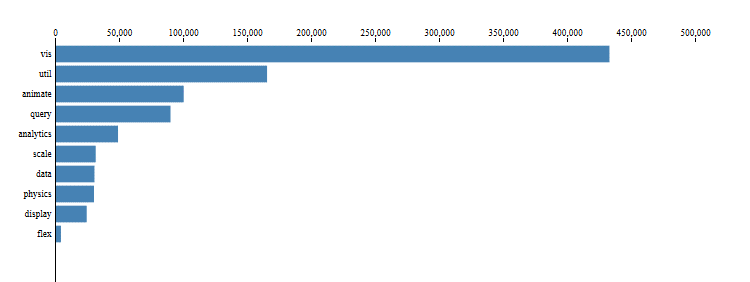
Animated hierarchical bar chart
ISSS608 Visual Analytics and Applications
Lesson 4: Interactivity in Visual Analytics
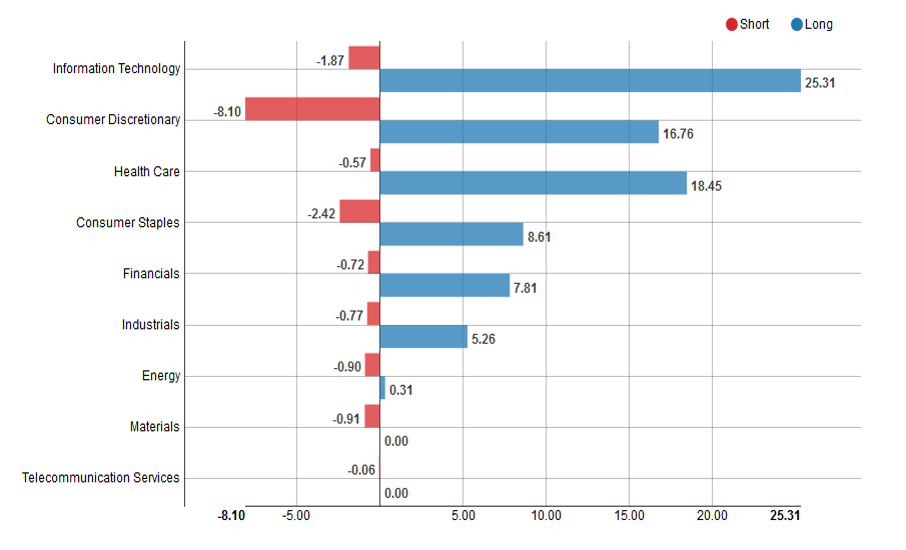
Animate Horizontal Multi-Bar Chart
ISSS608 Visual Analytics and Applications
Lesson 4: Interactivity in Visual Analytics
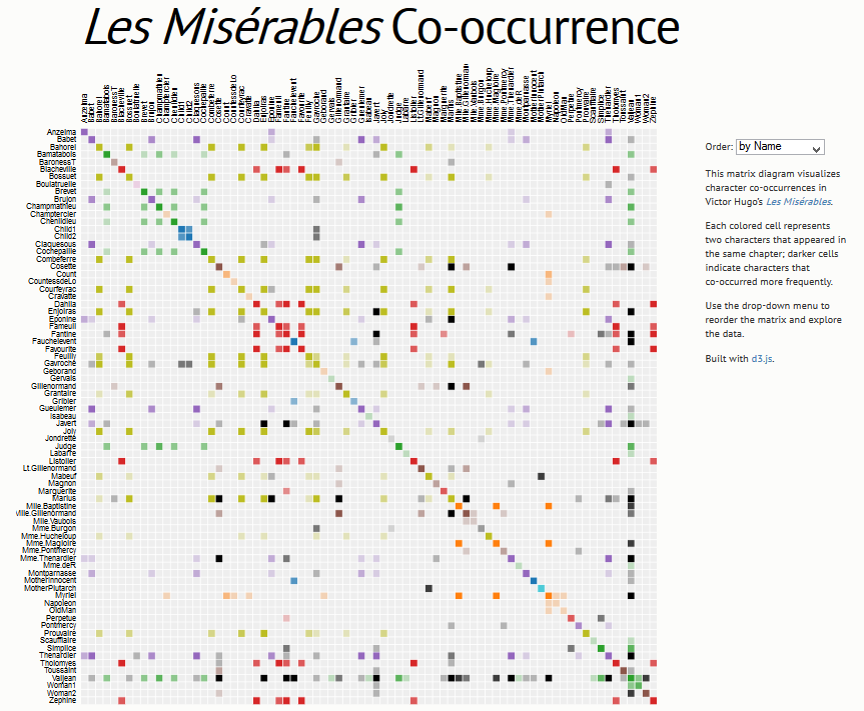
Animated Co-occurrence matrix
ISSS608 Visual Analytics and Applications
Lesson 4: Interactivity in Visual Analytics
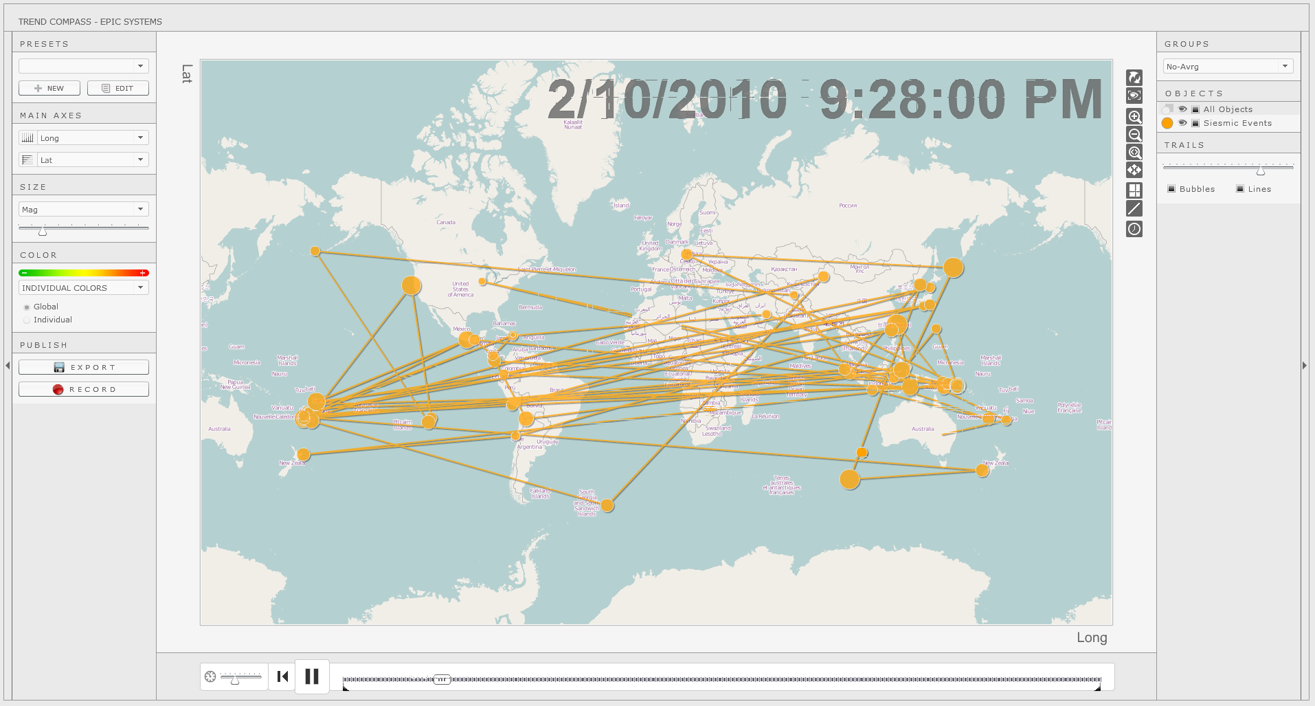
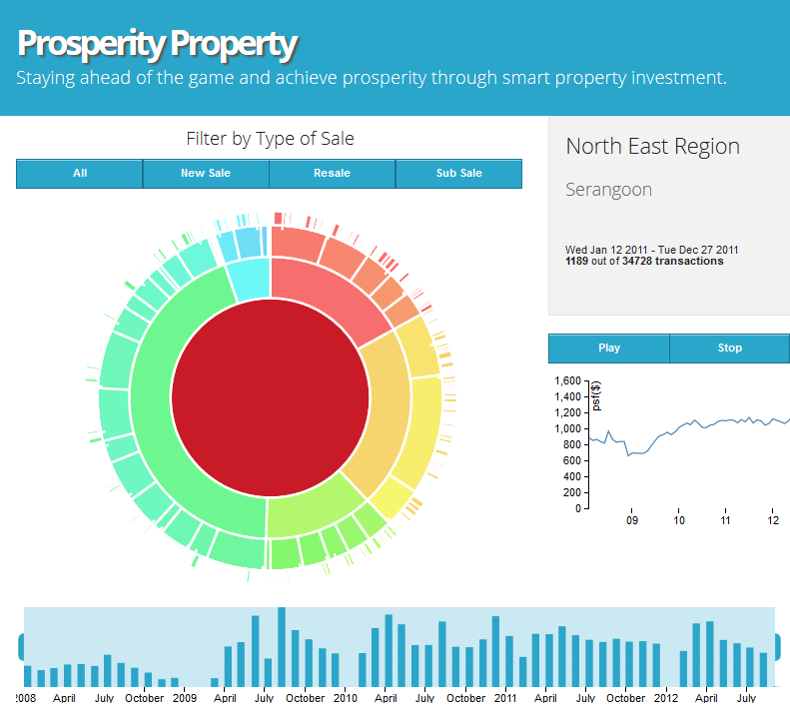
Animated Visual Analytics Application
ISSS608 Visual Analytics and Applications
Lesson 4: Interactivity in Visual Analytics
An animated dashboard
IS428 Visual Analytics for Business Intelligence
Lesson 4: Interactivity in Visual Analytics
ISSS608-Lesson04
By Kam Tin Seong


