The Restaurant Scene and Efficacy of Food Inspections in Boston
Ty Mulholland

Executive Summary
- Question: How do restaurant inspections affect the climate, stability and makeup of the restaurant scene in Boston?
- Utilized several datasets including:
- Boston Health Department food inspections
- Yelp restaurant data
- Boston Census Tracts
- Food inspections data from sister cities (Austin, San Francisco, Seattle)
*Or as long as the statue of limitations, whichever is shorter
Key Findings
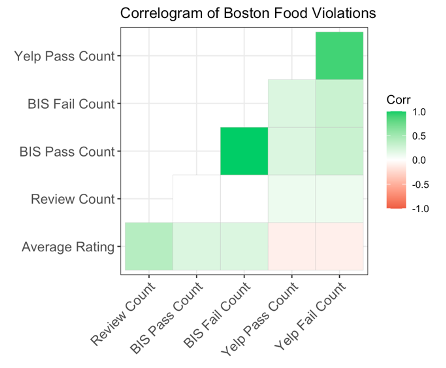
- There is ultimately no correlation between how many failed inspections a Boston restaurant has and it’s ratings by customers.
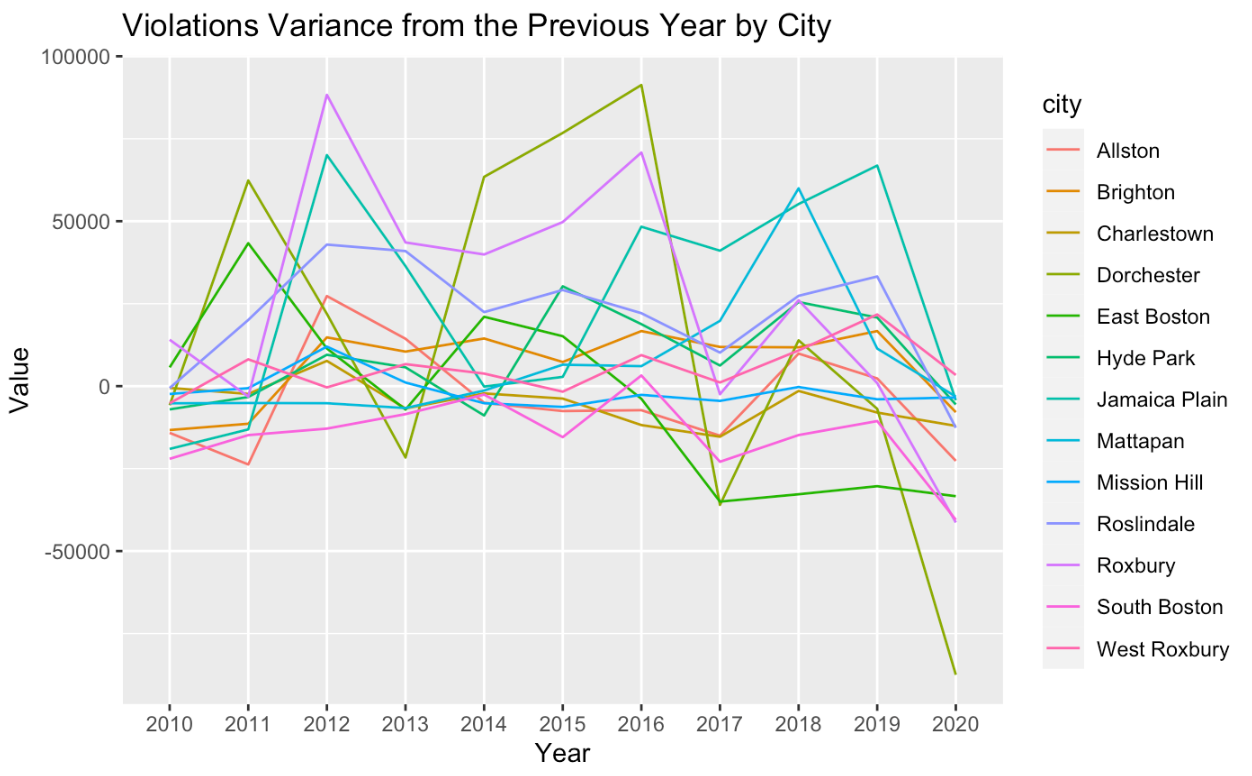
- There were proportionate failed inspections to passed inspections for each neighborhood in Boston.
-
Higher Rated Restaurants tend to have fewer failed inspections.
- The Lyons Group owns the most restaurants in Boston at 28 by 2020.

Key Findings
-
The top restaurants for food inspection failures according to the Food Inspection dataset represent chain restaurants: McDonald’s (1221), Subway (1198), Dunkin Donuts (1104), Burger King (495).
-
The top Level 1 offenders are: McDonald’s (1540), Subway (1473), The Real Deal (1122).
-
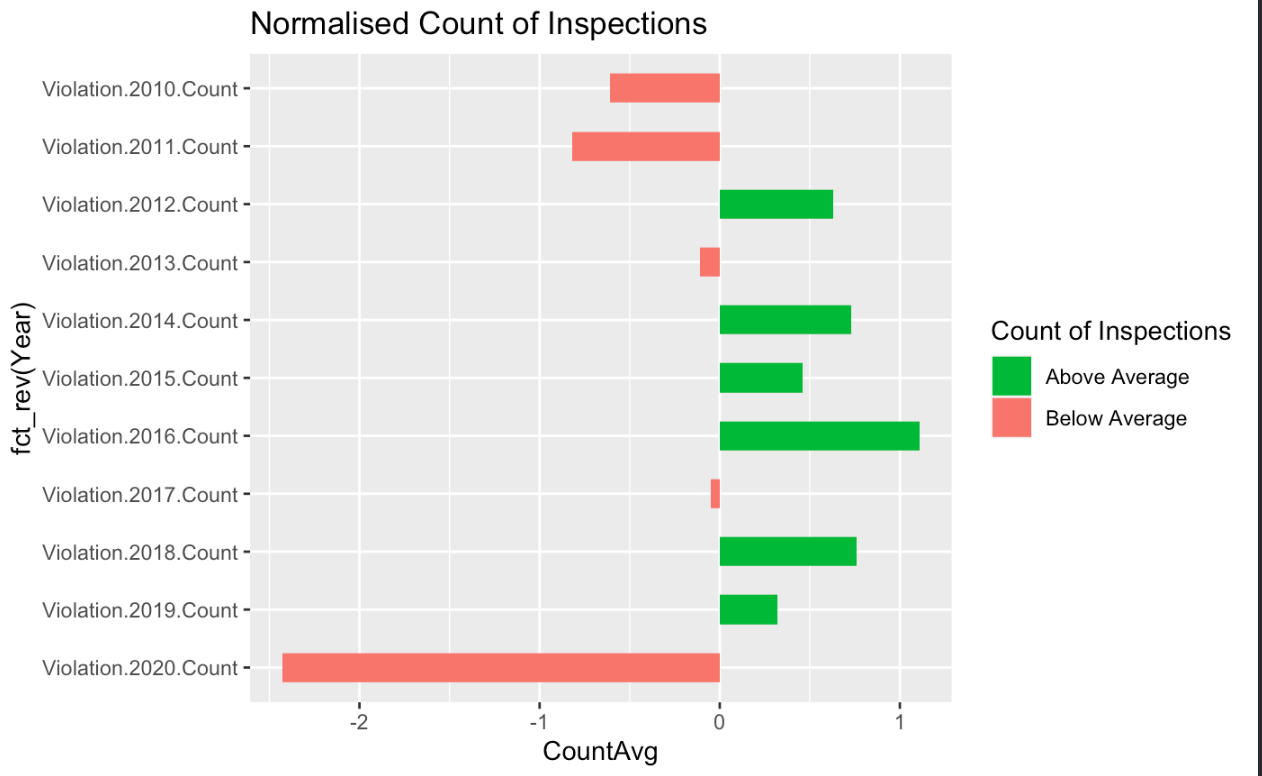
Restaurant inspections dropped dramatically in 2020
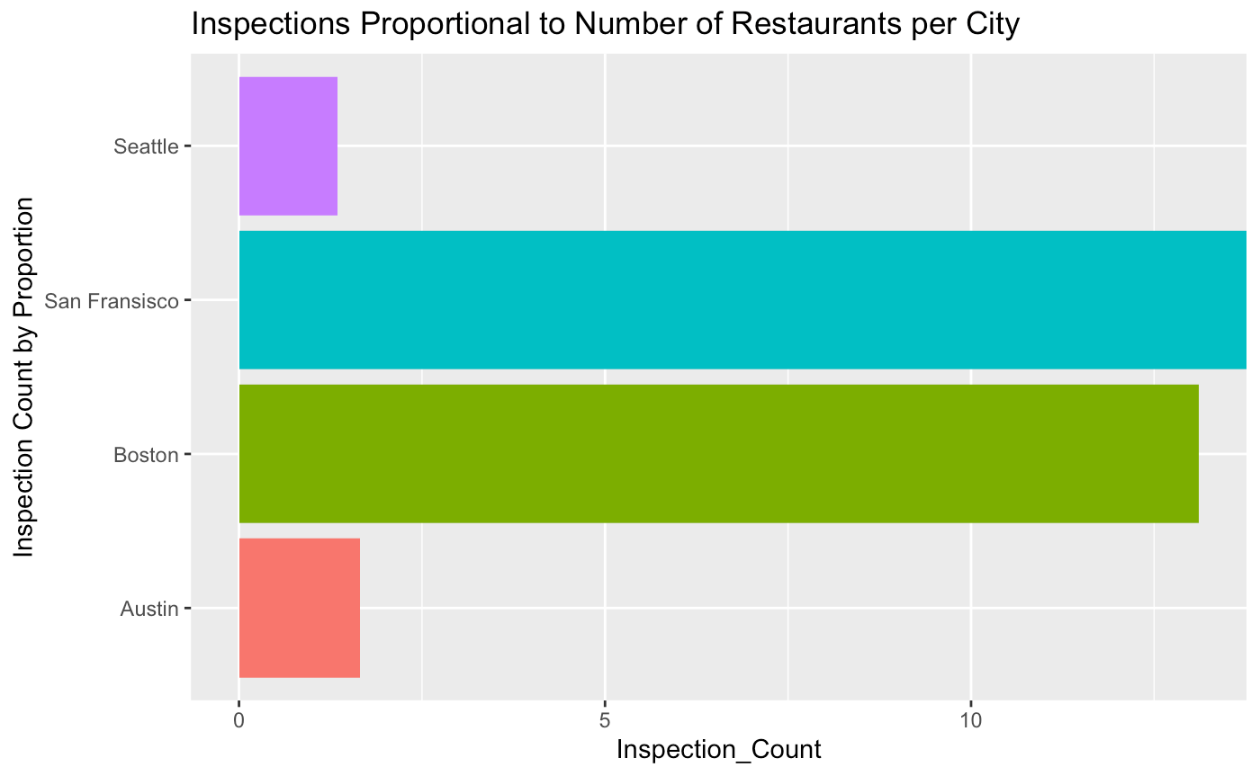
- Boston has the second most overall inspections per year compared to Austin, San Francisco, and Seattle.

Restaurant Scene and Inspections
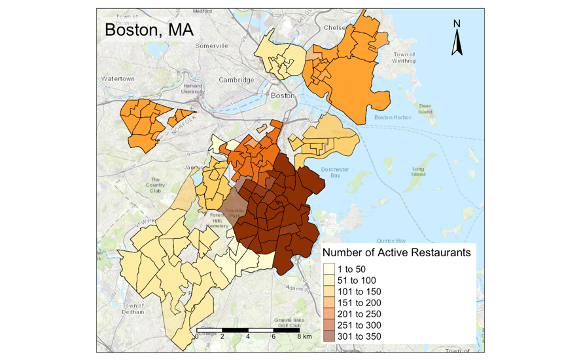
- The data suggests there is roughly 1800 food establishments in Boston with the most being in Dorchester
- Boston Health Department issued 298,023 violations between 2010 and 2020
- Boston had the second most inspections with San Francisco being first
Restaurant Scene and Inspections
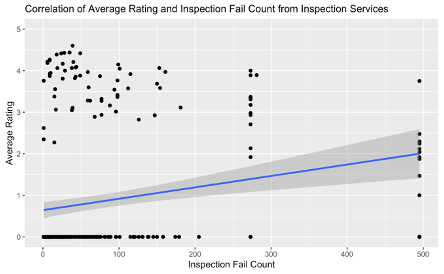
Examined inspection result versus the rating (Yelp 1-5 star) to see if there was any correlation
- Data showed little to no correlation that inspection result affects the rating of a restaurant
Data also indicated that inspectors were fairly likely to give an equal amount of passed inspections as failed inspections.
Other Findings
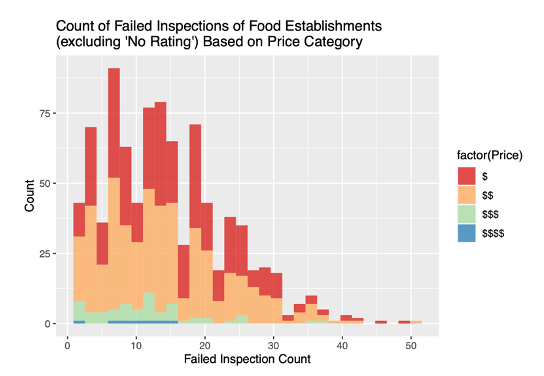
- Restaurants with higher pricing tended to have lower failed inspections. (~11% of the market were priced high/$$$ or expensive/$$$$
- Based on neighborhood, it takes an average of 2 years for a restaurant to shift the trajectory of inspections
Other Findings
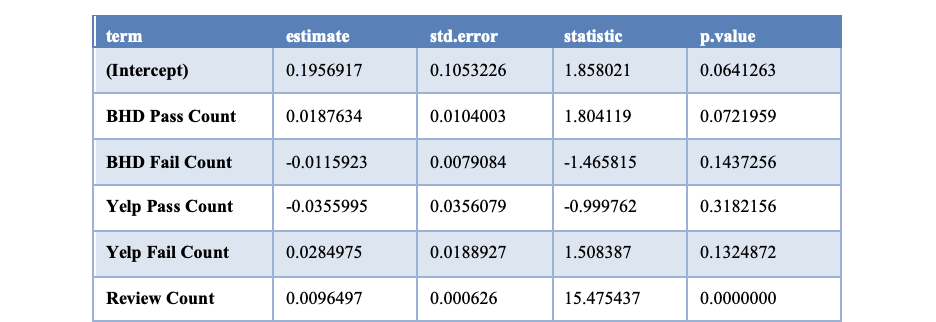
There was a direct correlation between the number of reviews and the rating
- 2020 marked a massive decline in inspections likely due to COVID
- When calculating a desirability score to more properly determine whether a restaurant deserved a high rating, the data suggested that only 20 restaurants meet a 'desirable'
(failure rate < 70% + rating > 3.4 + review count > =50)
Conclusion
- Overall there is not enough evidence to suggest that inspection results have impact on a restaurants rating
- There is evidence to show that more expensive restaurants receive better inspection results
- When translating a more holistic rating, very few restaurants actually meet the criteria
Ty Mulholland
ty@tymulholland.com
@tymulholland

THANK YOU!
Copy of Copy of deck
By Ty Mulholland


