Using grafana with VLC
Observability tooling for long-running analysis
Alexandre Janniaux - Juin 2025
Type of debugging
Or printf, and build understanding of what might be the root cause.
1
Reproduce and use a debugger
Build understanding in code via a scenario while testing an hypothesis.
2
Reproduce in a regression test
Try to find any root cause because there is no ideas of why it fails yet.
3
Write a CSV serializer in logs


Trace API in VLC [1]
[1]: https://code.videolan.org/videolan/vlc/-/merge_requests/365
vlc_tracer_Trace(tracer,
                 VLC_TRACE("type", "DEMUX"),
                 VLC_TRACE("id", "input"),
                 VLC_TRACE_TICK_NS("buffering", -i_late),
VLC_TRACE_END);-
From Nicolas Le Quec, 5 juillet 2021
-
Tracer modules can be implemented
-
Core API to forward tracer to VLC Objects
-
JSON tracer implementation
vlc-pa HTML
house-made timeseries visualizer reading JSON traces
vlc-pa
Python mathplotlib to visualize json traces
- More systematic than copy-pasting logs in libreoffice
- Common tools and presentation
- Pandas integration, more advanced flaw research
Benefits
Pain points
- Off-line captures of the points
- Huge amount of data to proceed
- Tool maintenance and missing features
Re-implement the traces
CFO
Realtime traces
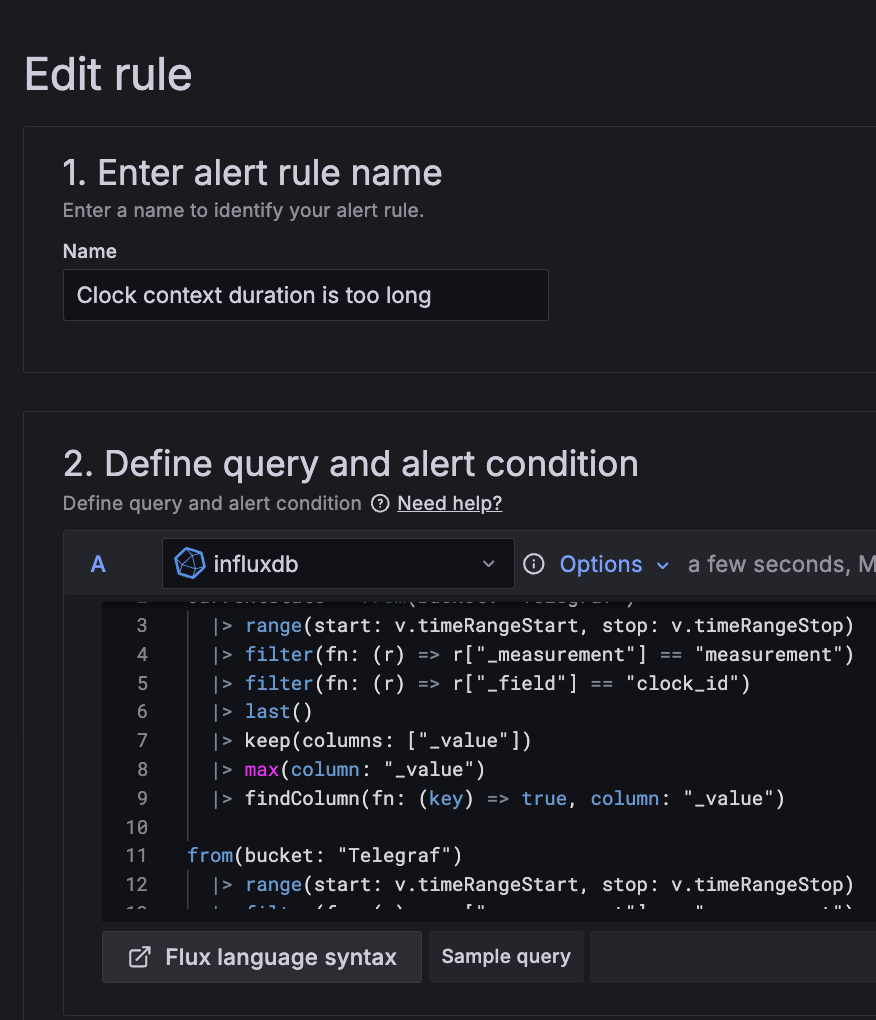
Dashboard completeness
Tools / alerts integration
Telegraf
Time series aggregator
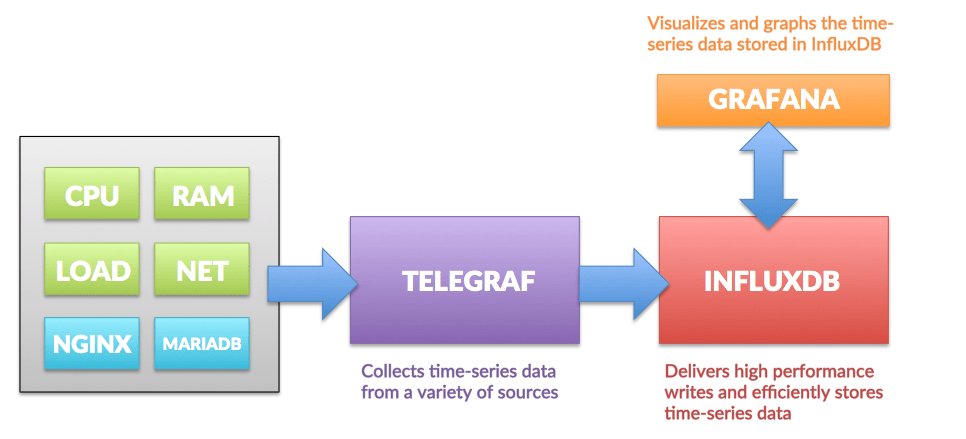

Influxdb
time series database, handling tags and metrics
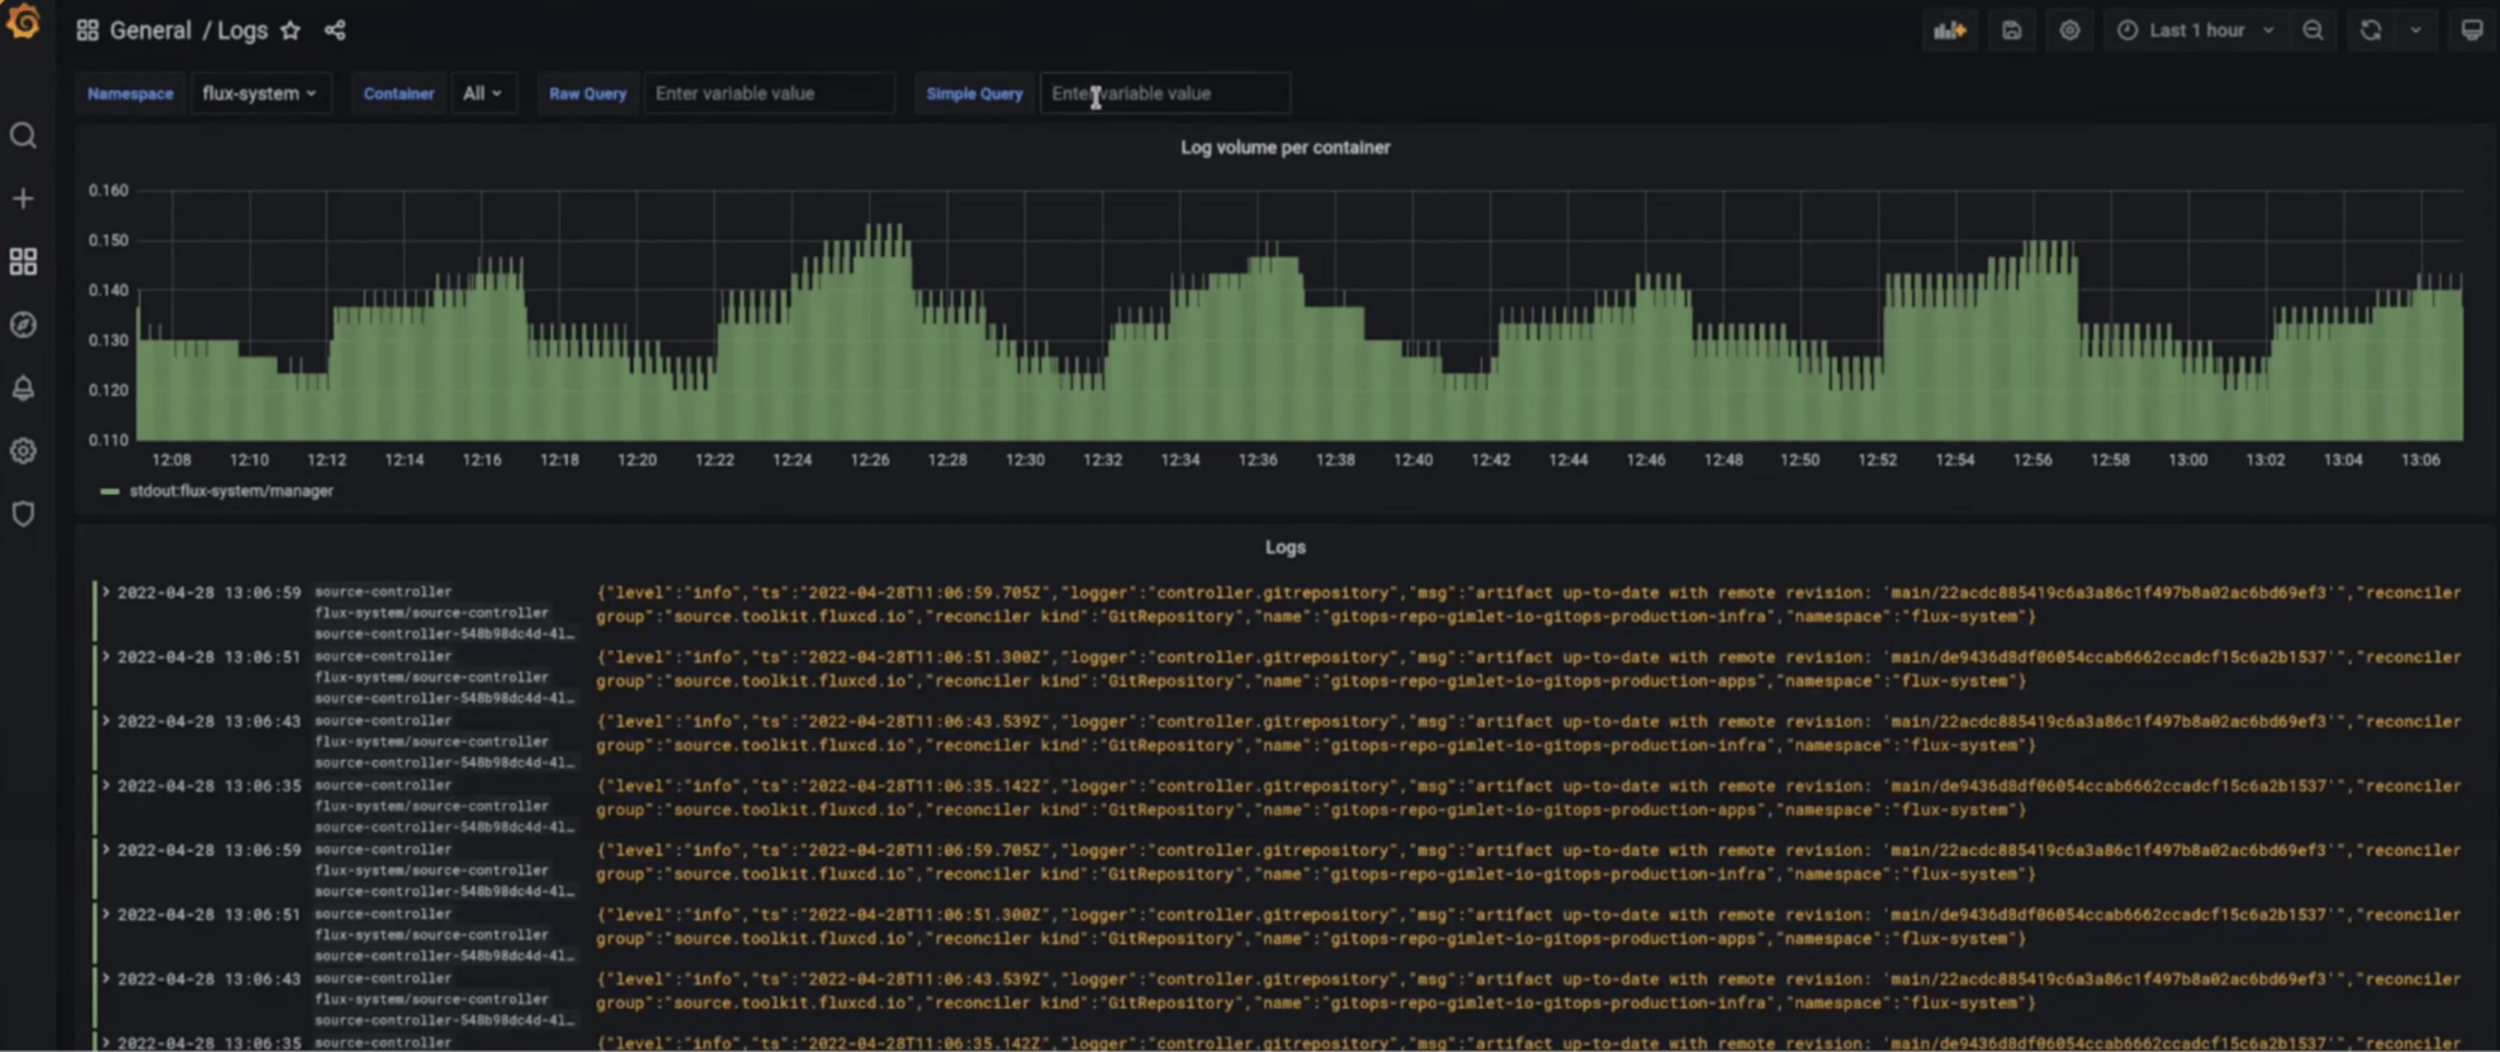
Loki
Log aggregator and metadata indexer
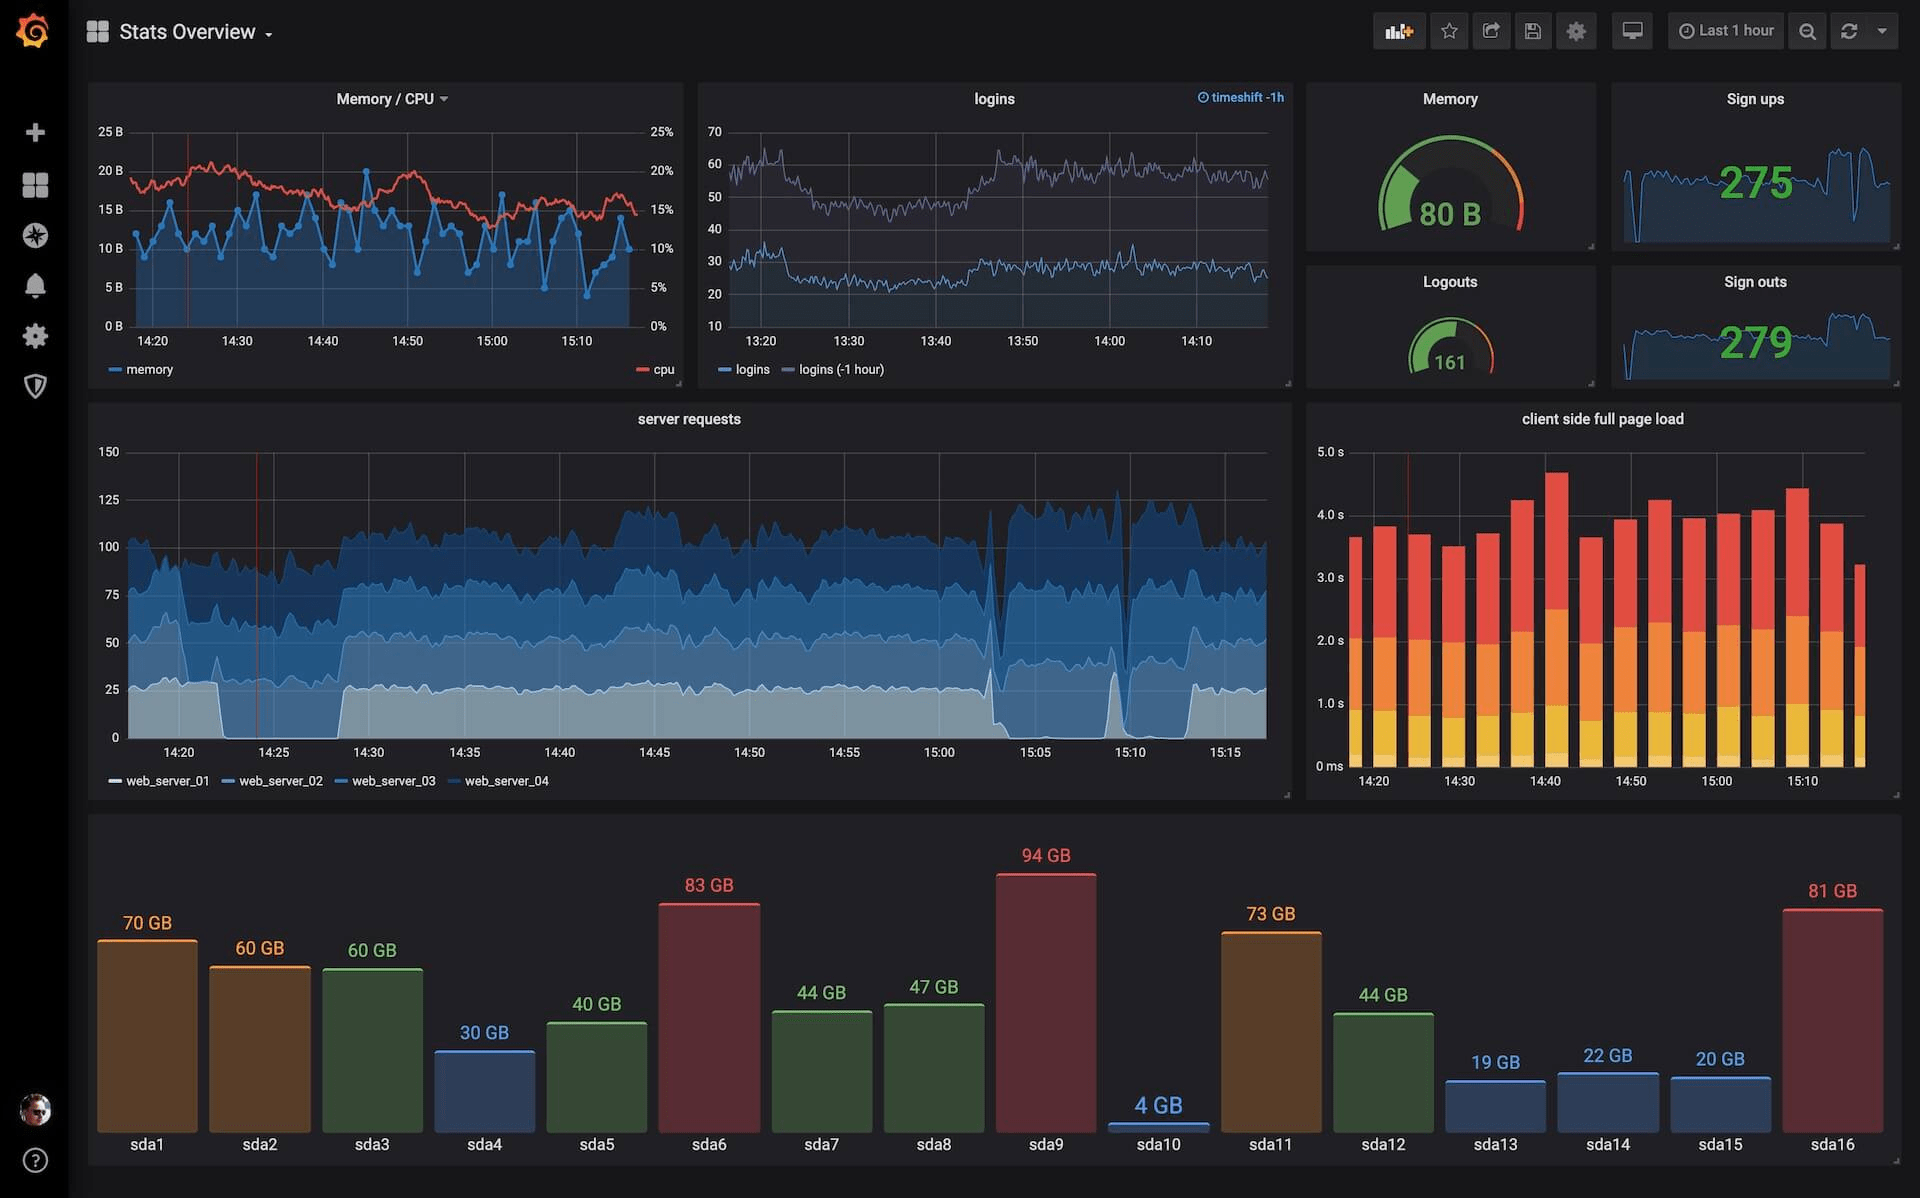
Grafana
sysadmin tool to monitor server nodes
Docker compose
code.v.o/Garf/vlc-influxdb
docker compose up
firefox http://localhost:3000/
export VLC_TELEGRAF_ENDPOINT="tcp://localhost:8094"
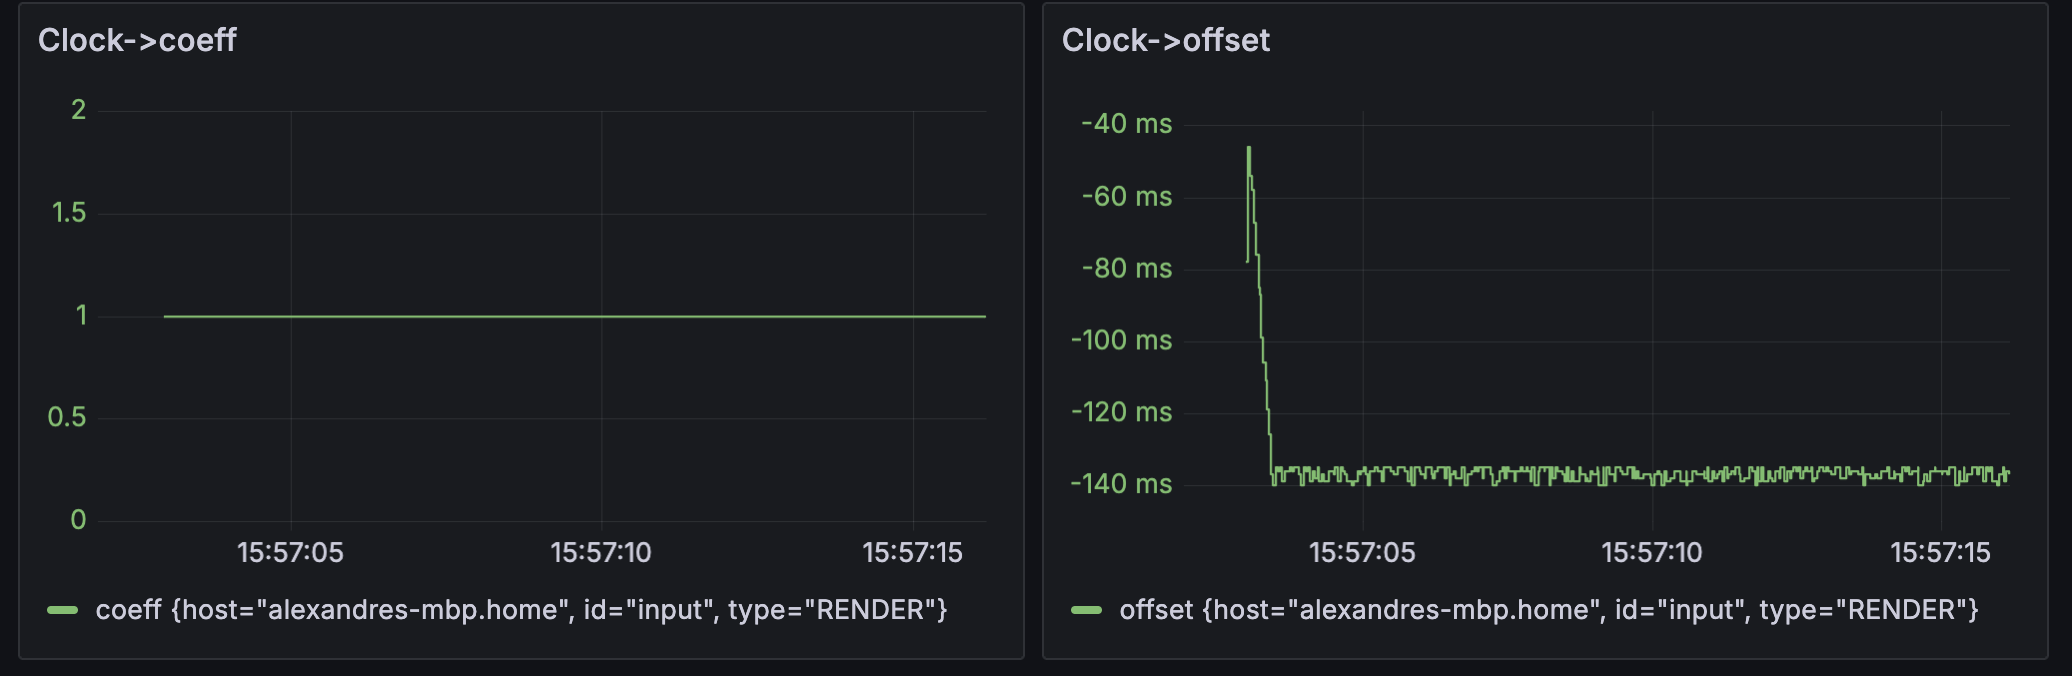
vlc --tracer=telegrafClock interpolation
Clock interpolate with
y = coeff * t + offset
This tracks the two parameters over time.
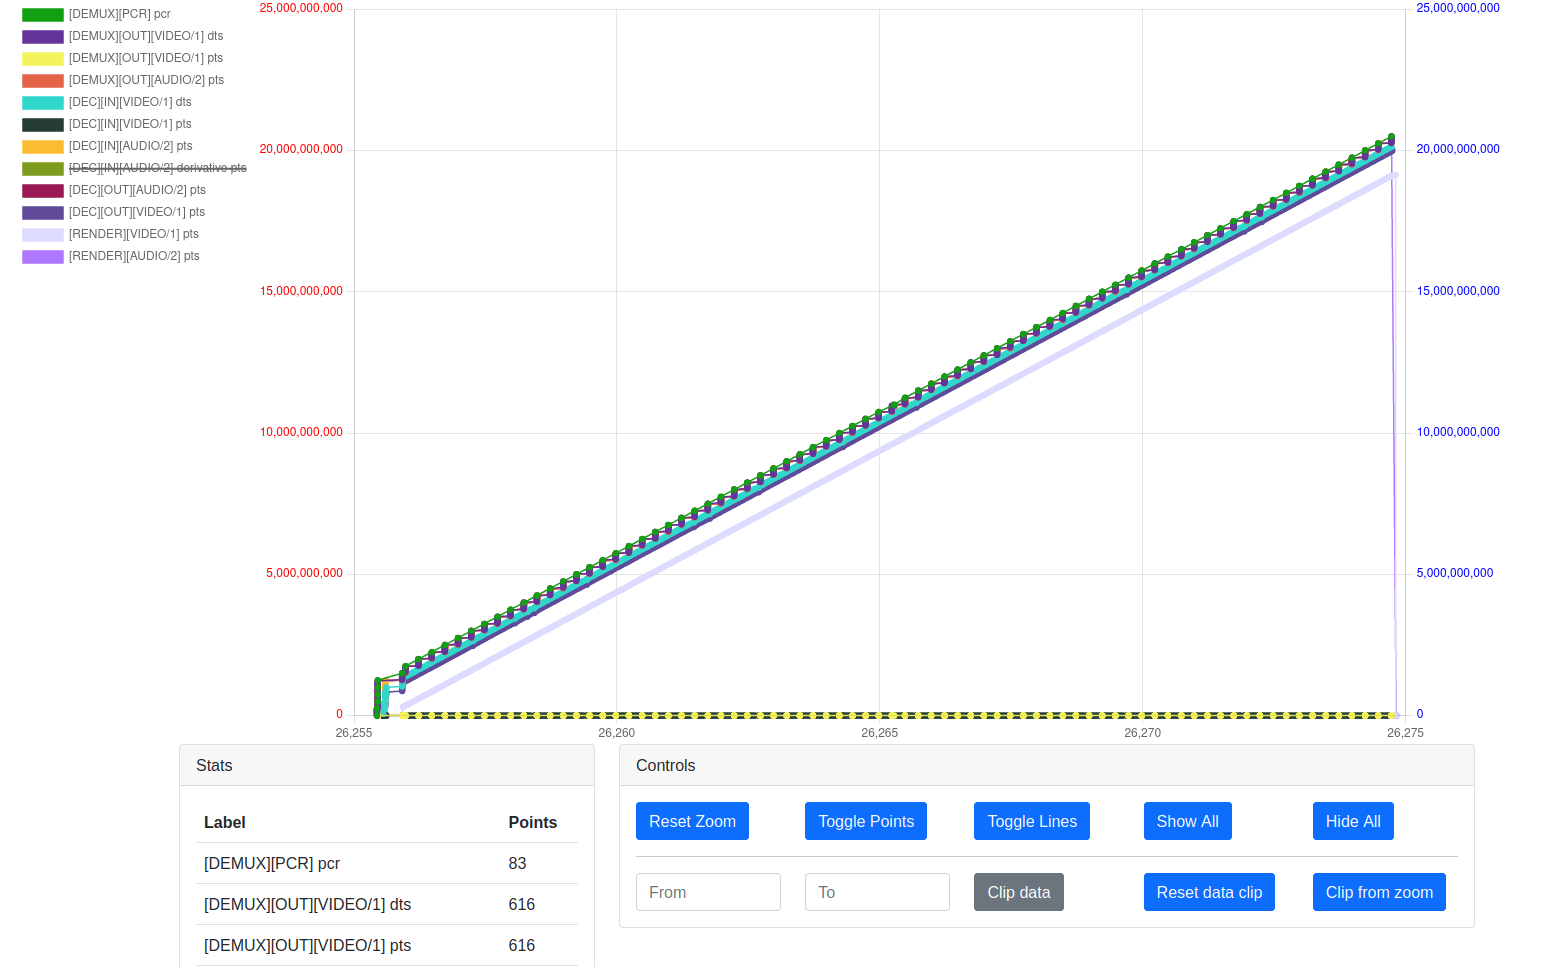
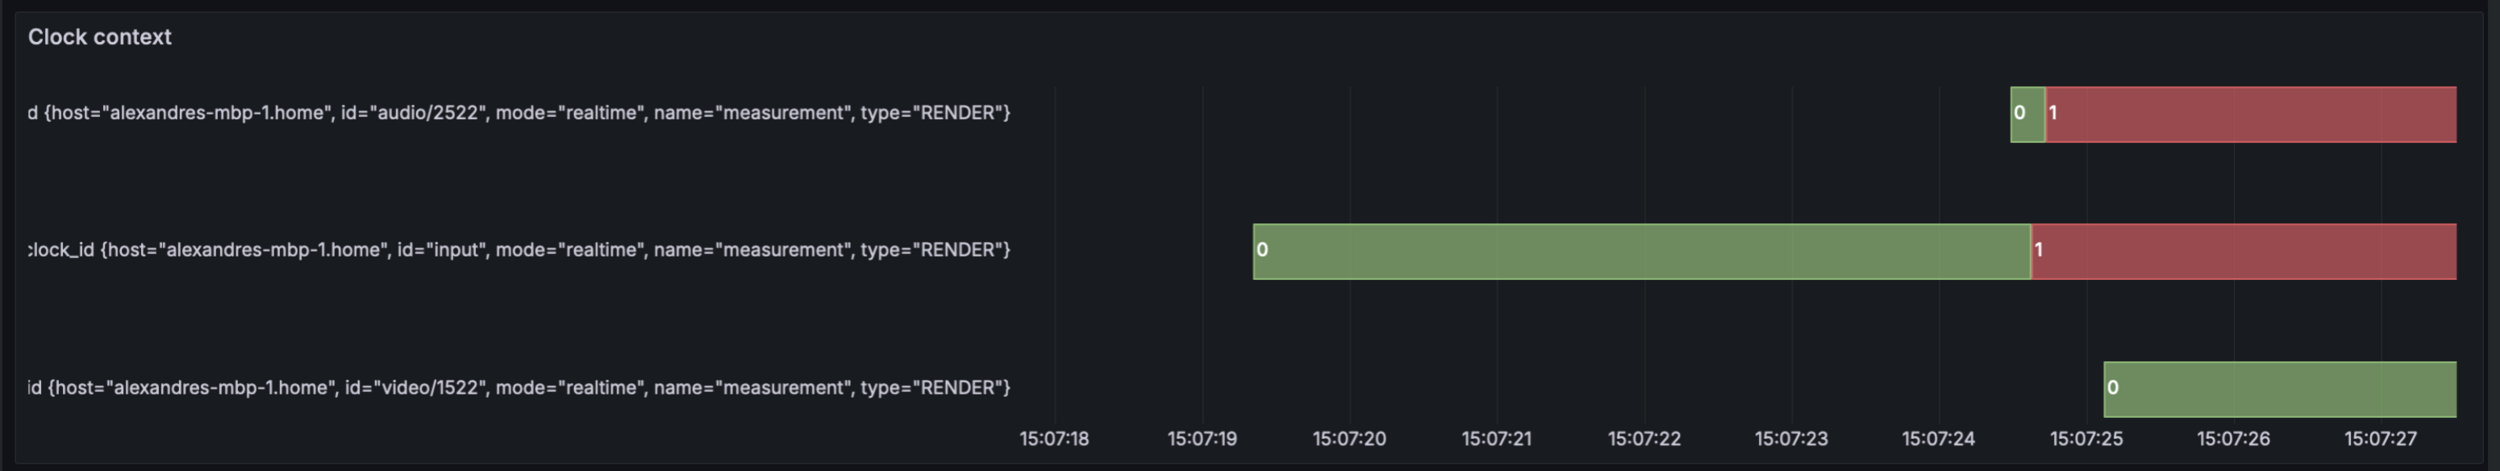
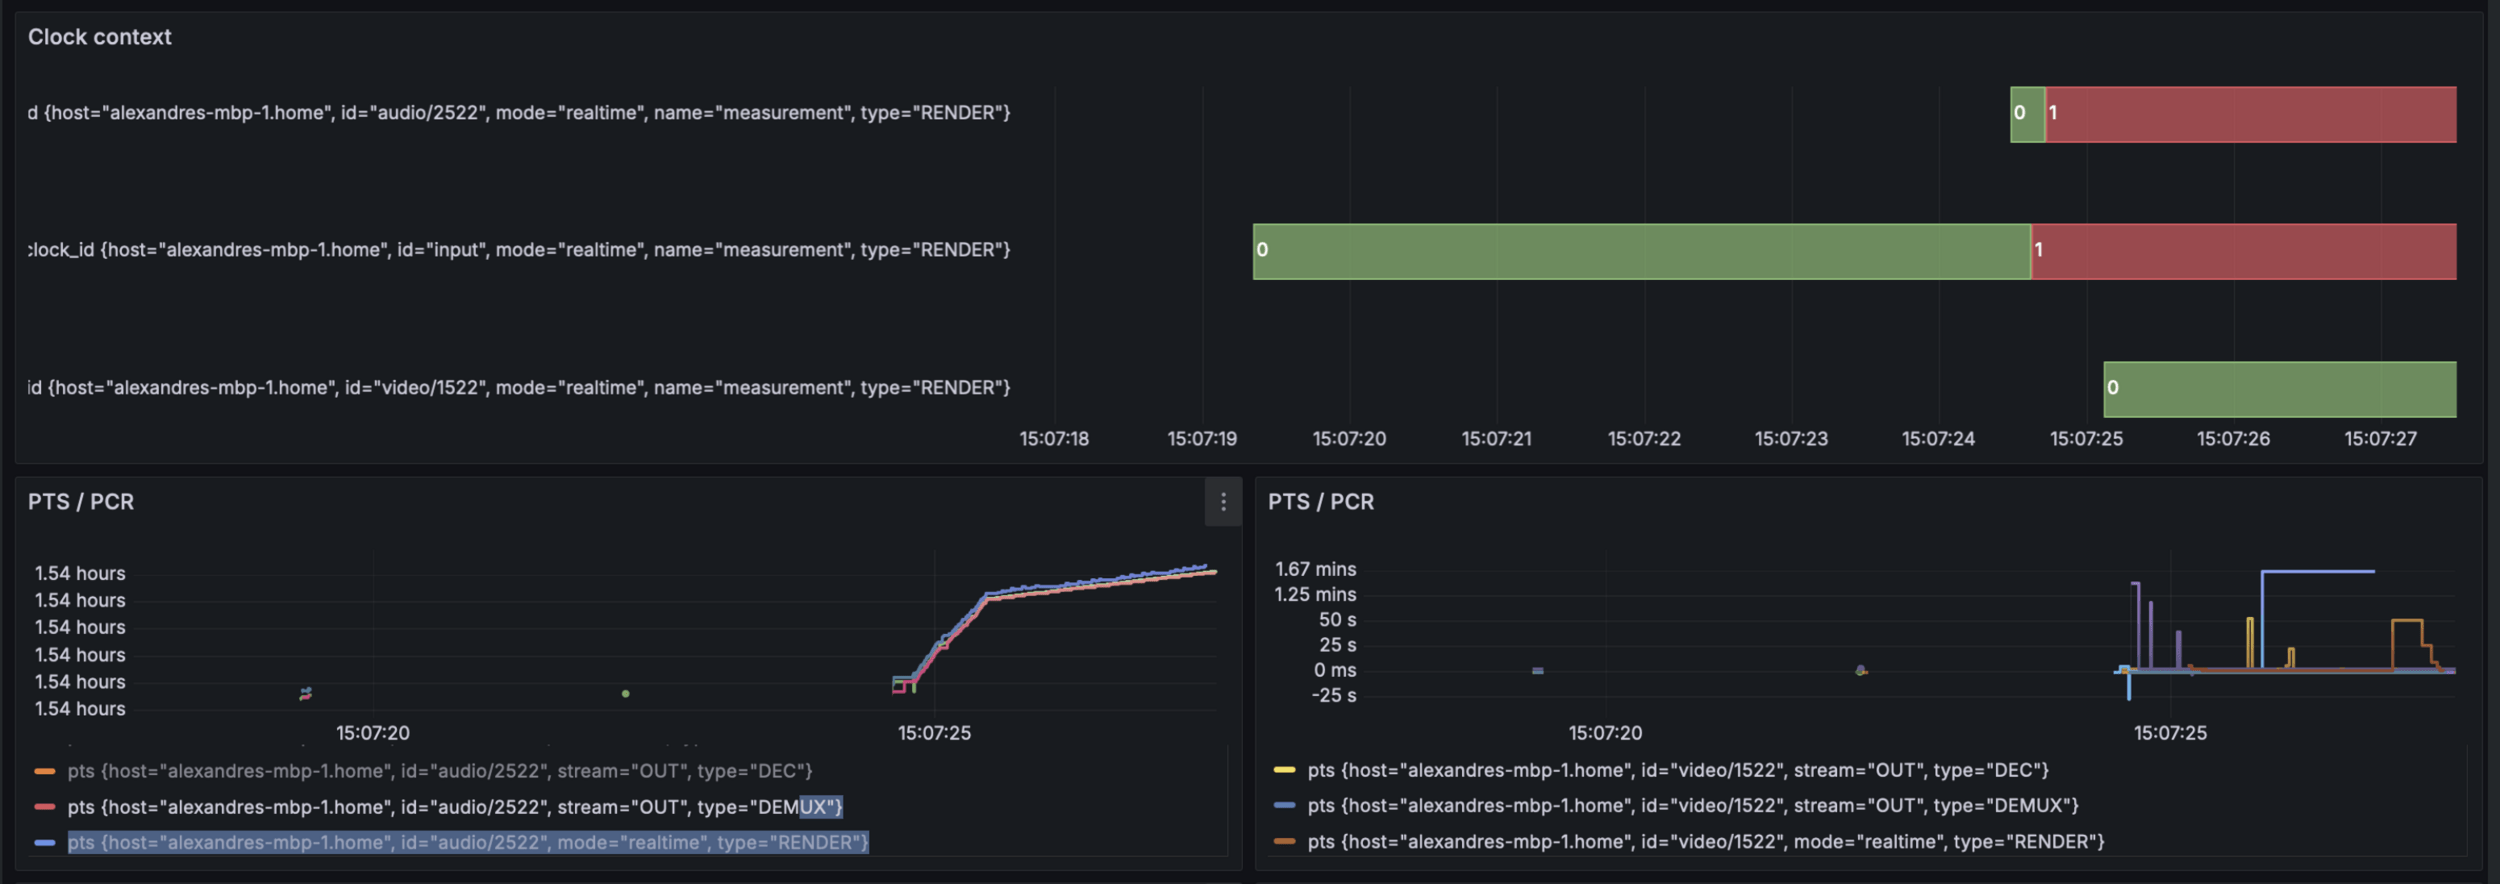
Clock context
Analyze asynchronous issues in the clock design.
Each line is a track or input.
Each number matches with a given clock context.
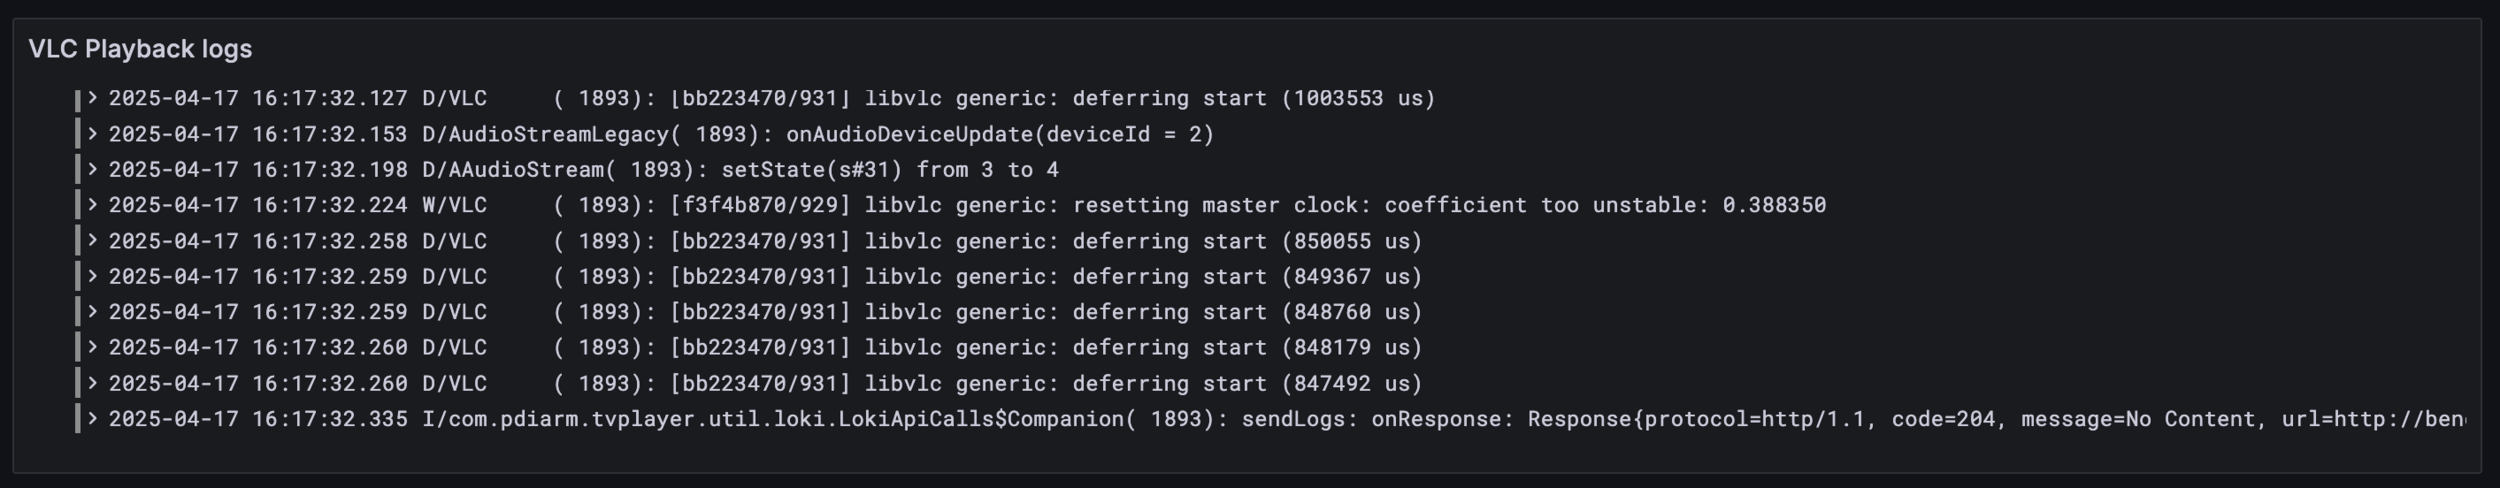
Log integration
Logging is synchronized with the selected time window.
Provide additional event feedback on what happened.
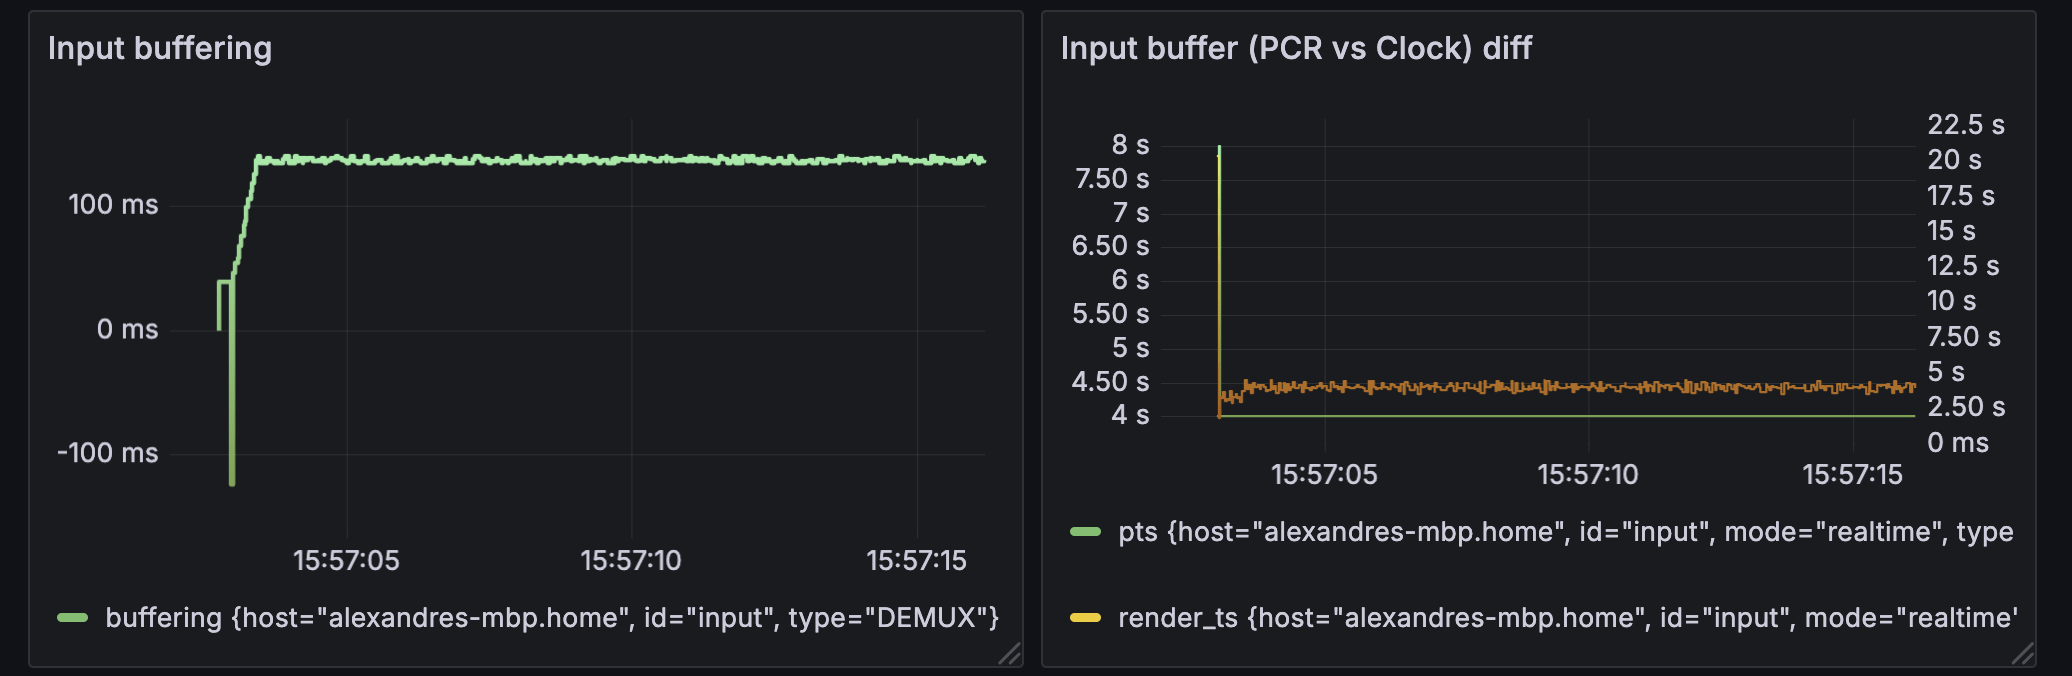
Input buffer
Input buffering metrics shows internal state of the input clock.
Highlights fluttering in the input, and long-run input drift issue.
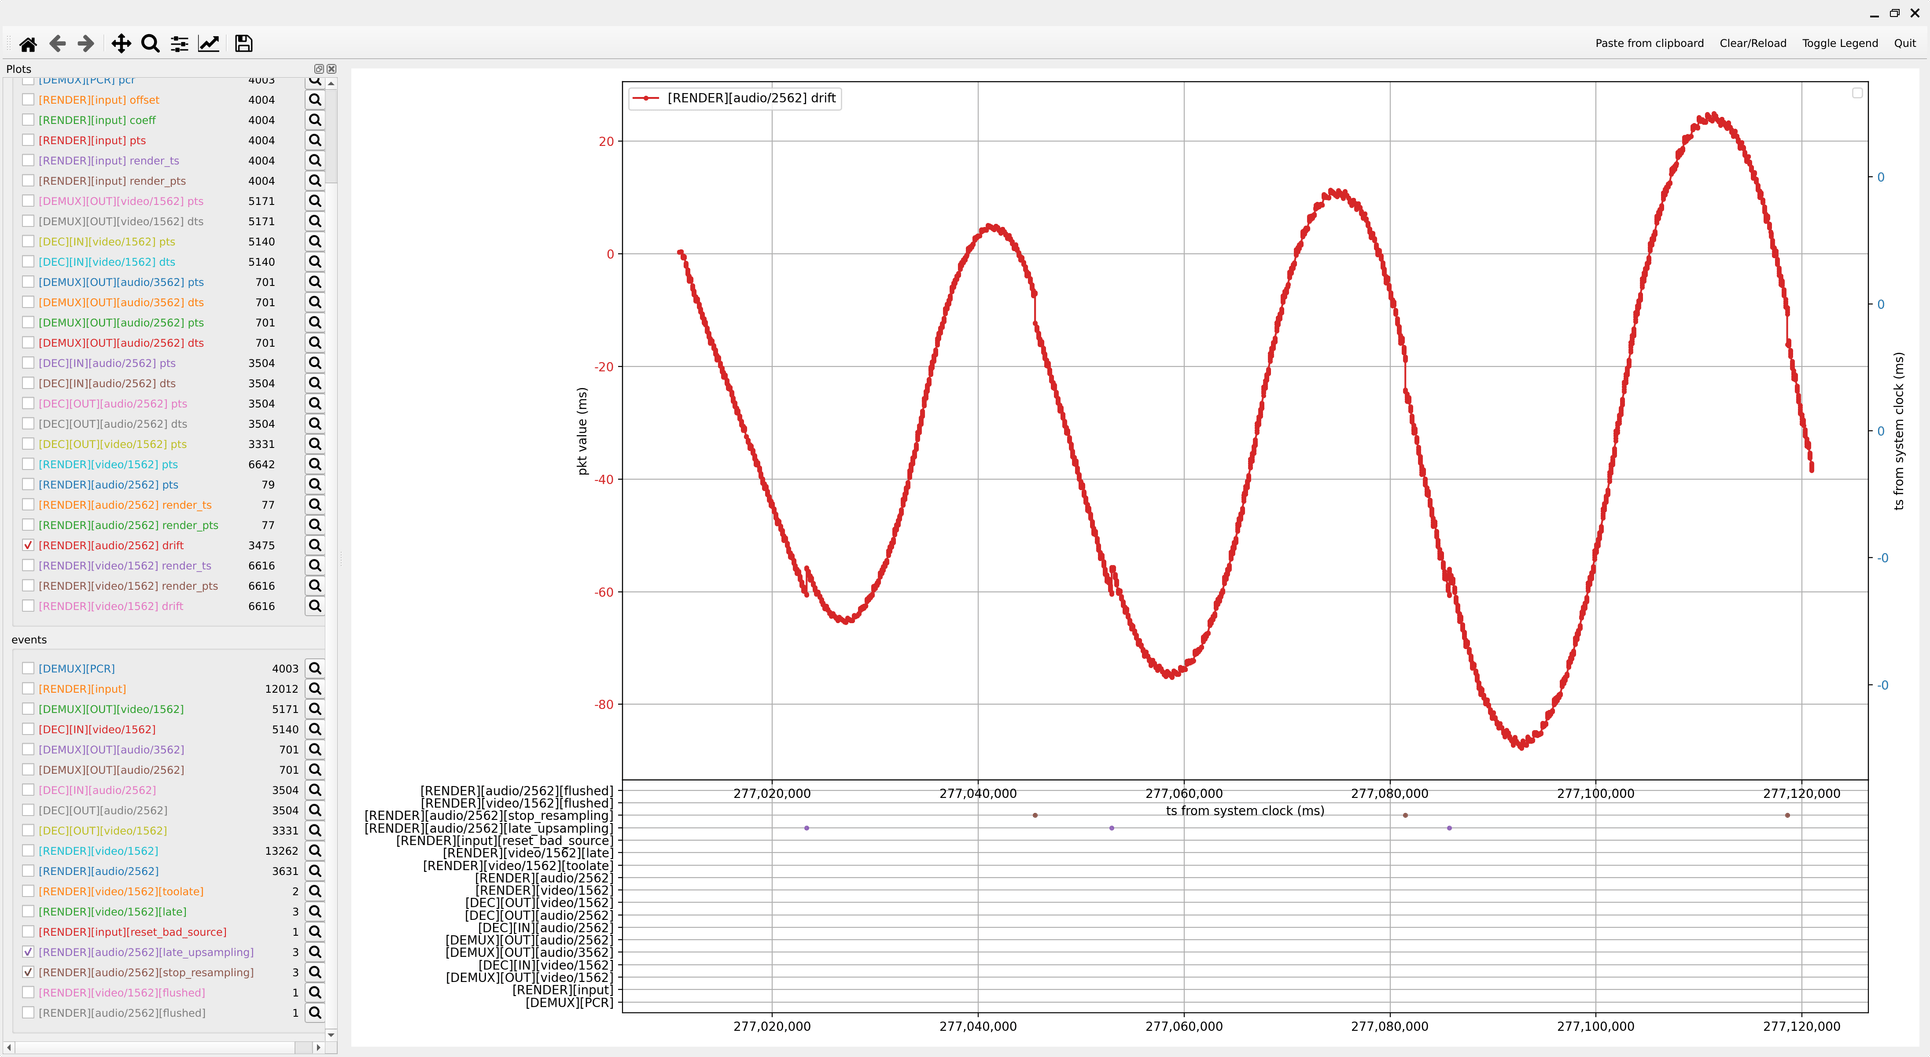
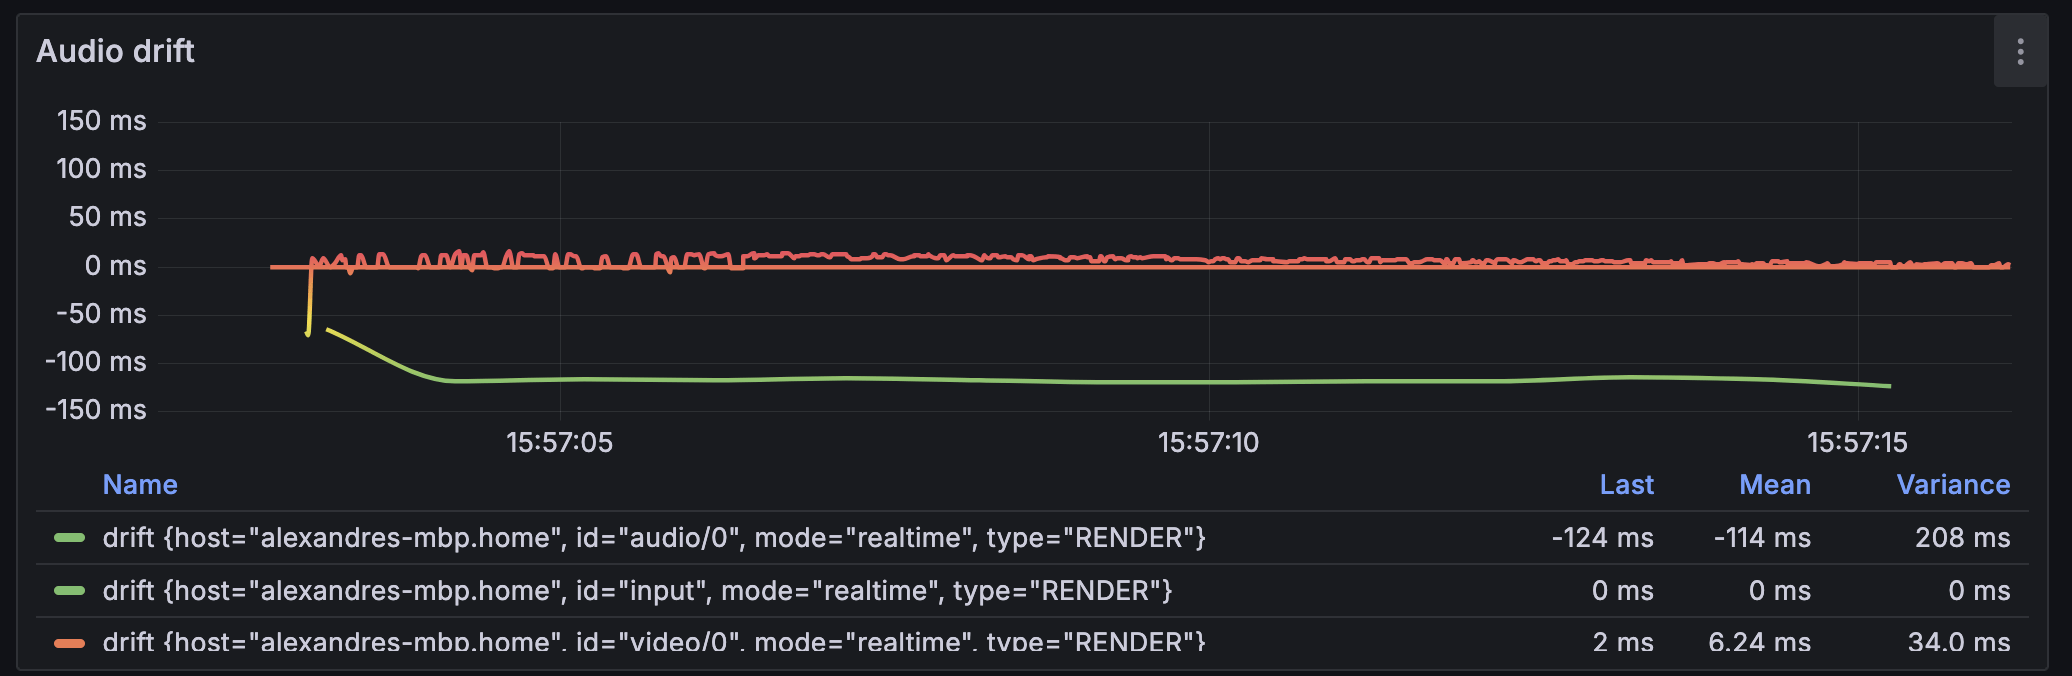
Audio drift
Reports the "drift" value for each clock/track whenever they get updated.
Tracks avsync issue, long-run drift, resampling, etc...
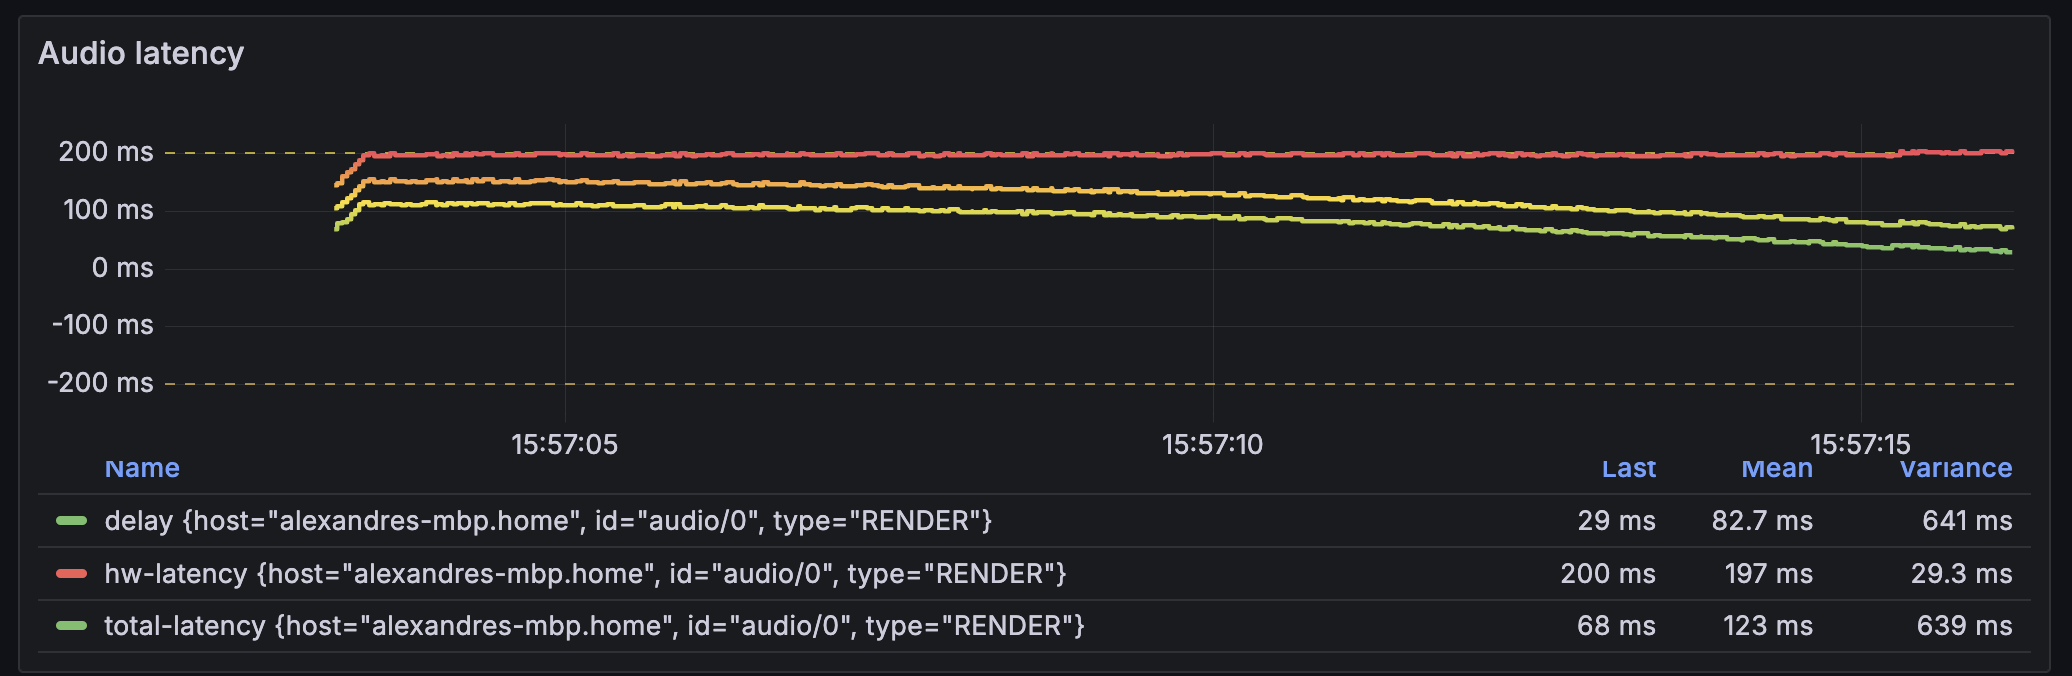
Audio latency
Tracks the reporting of audio latency, specifically for coreaudio here.
Useful in testing variation of output devices and its consequences.
Audio buffer
Tracks how much buffer if available in the audio output, after audio_Play().
When underrun happens, shows how much was missing on the right.
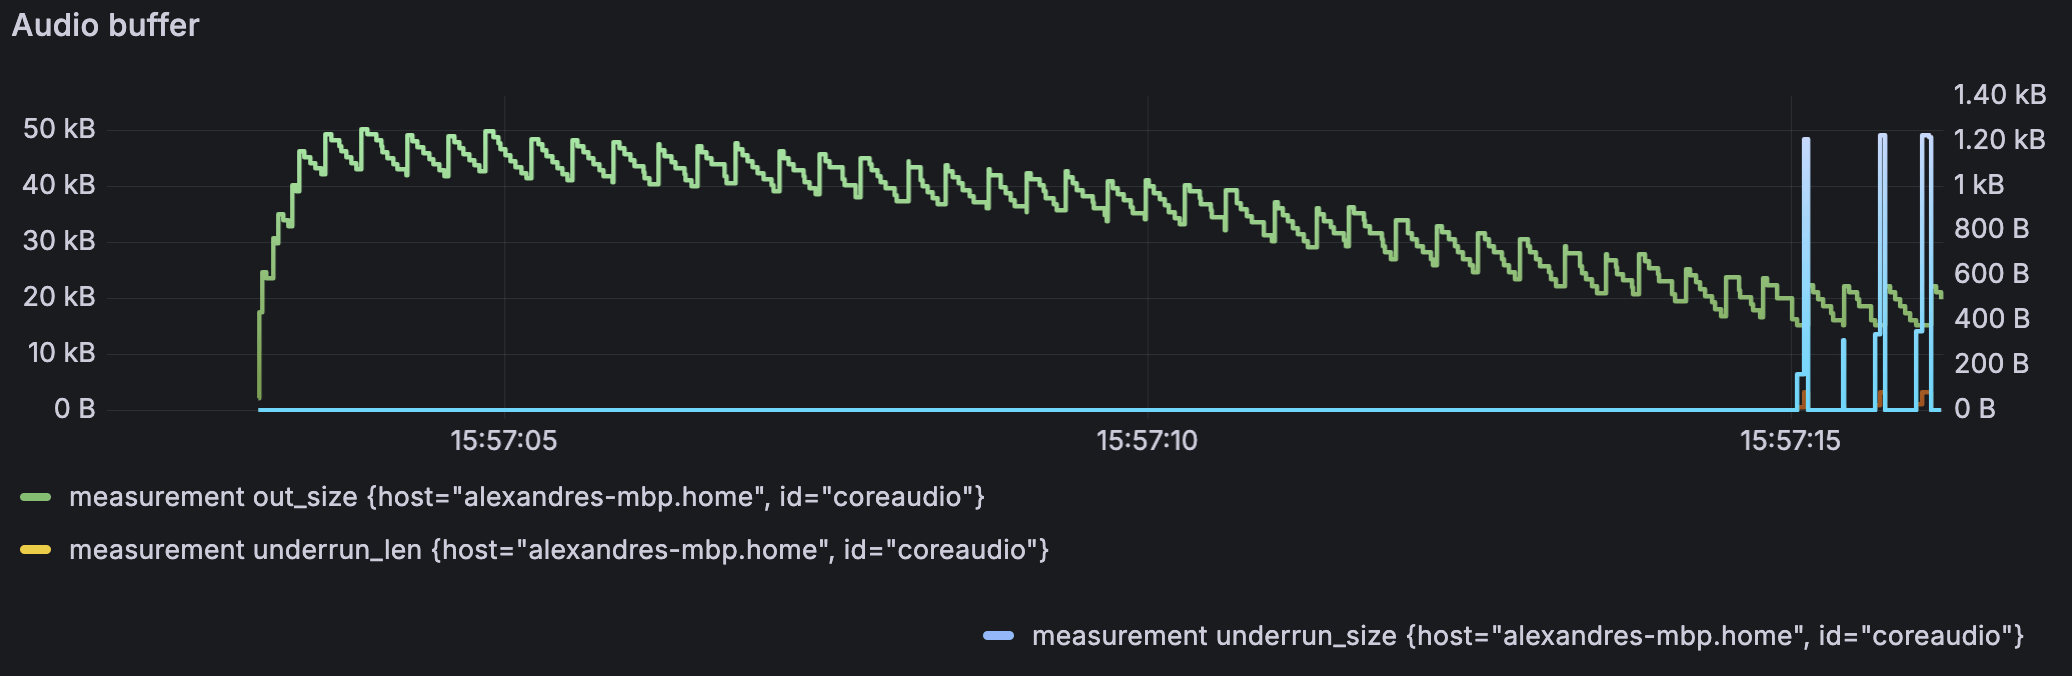
Audio buffer
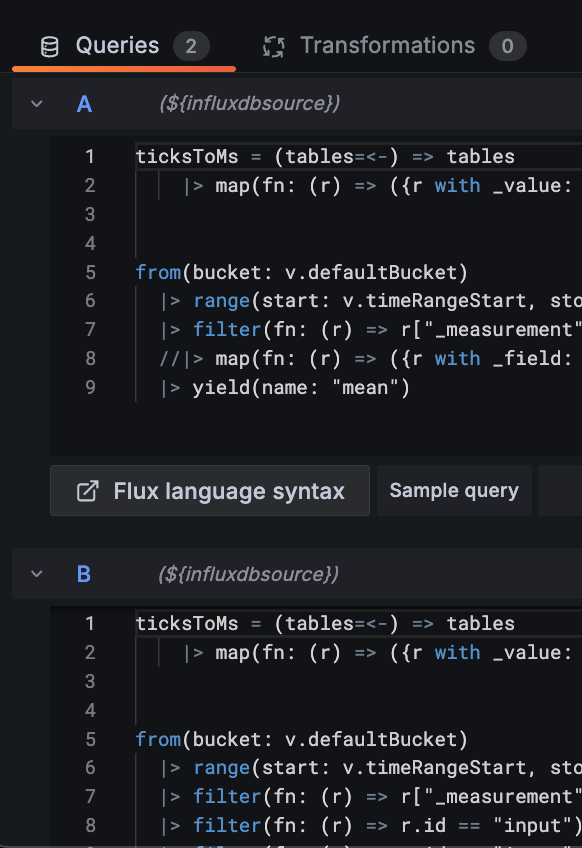
from(bucket: v.defaultBucket)
|> range(start: v.timeRangeStart, stop: v.timeRangeStop)
|> filter(fn: (r) => r["_measurement"] == "measurement" and r.id == "coreaudio")
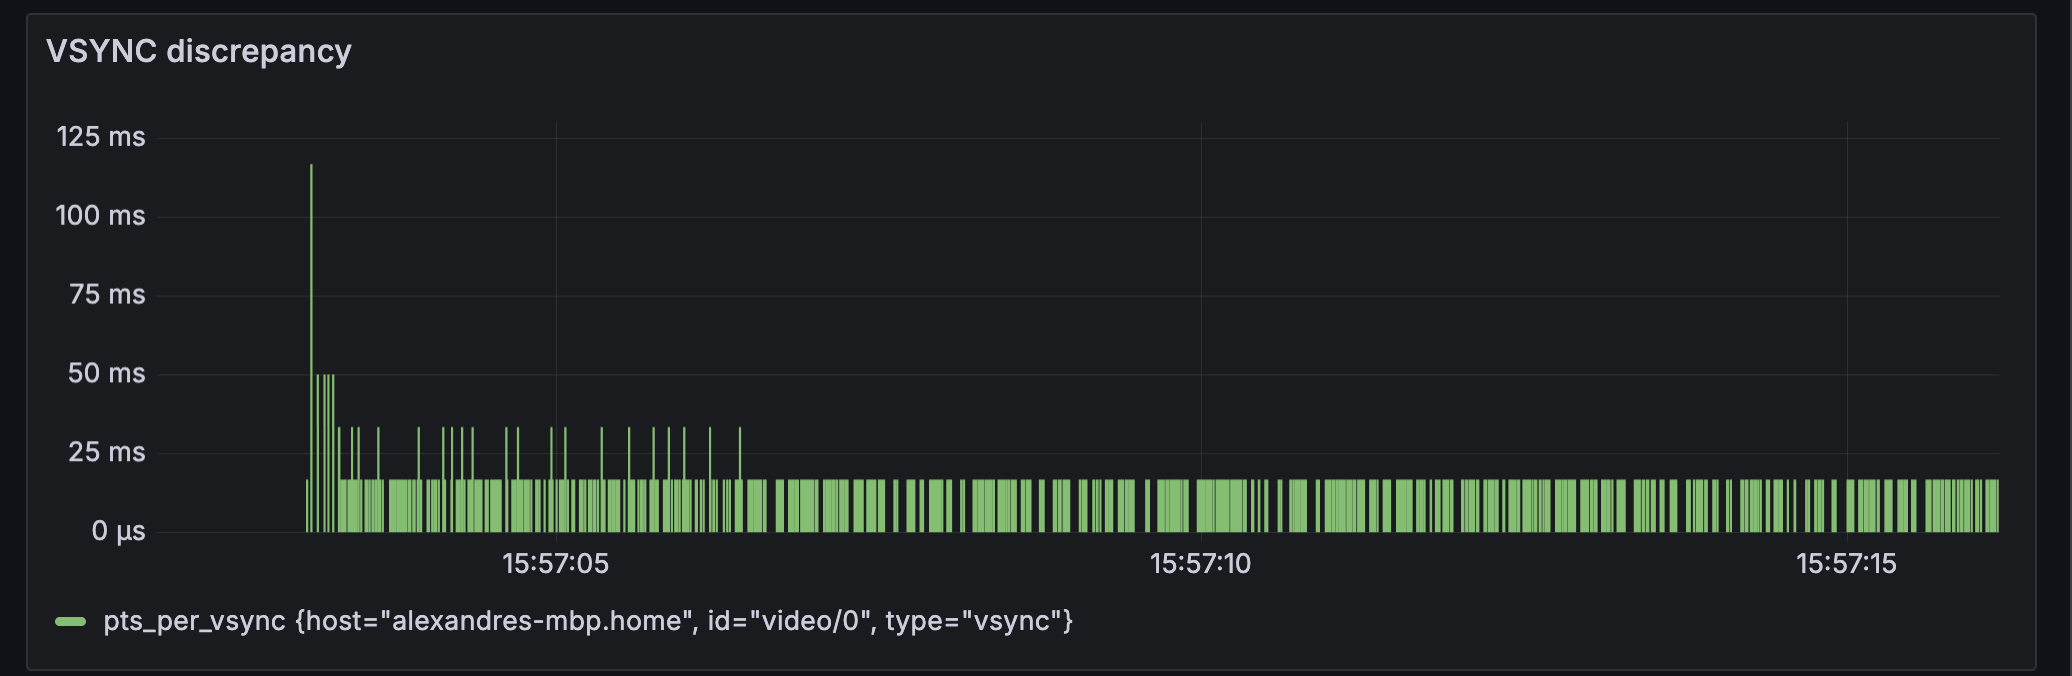
|> yield(name: "mean")VSYNC discrepancy
Analyze irregularities in the reporting of VSYNC (SK branch).
Gives hints about frame drops and is compatible with alerts.
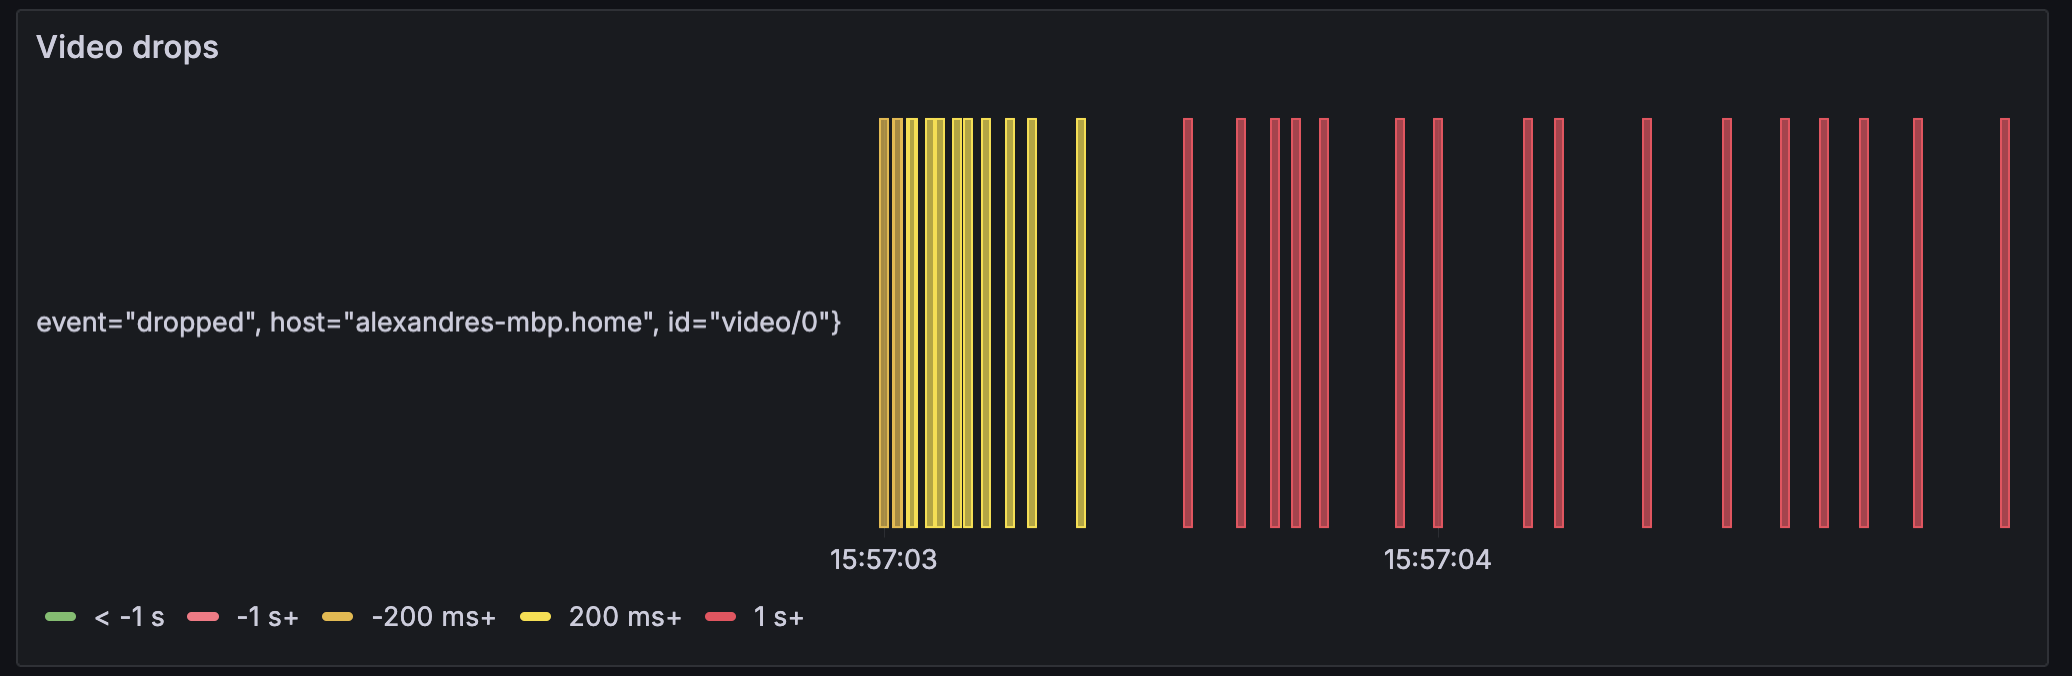
Video drops
Shows a bar when a frame is drop and set the colour/values to how much it was late.
Examples of bugs
When do you need this ?
Your mileage may vary.
– Famous quote
Fast channel zapping (SK)
Symptoms:
- PCR gap, ES_OUT_RESET_PCR()
- Re-buffering at beginning
- Triggers clock context bug /o\
Fast channel zapping (SK)
Symptoms:
- Playback way to late/early
- Playback, then resampling,
then silence
Fast channel zapping (SK)
Symptoms:
- Lipsync issue, audio and video out of sync multiple secs
- Clock confidently report drift
value is 0ms drift /o\
Decoder out of sync (PDI)
Symptoms:
- Video playback getting slower
- Audio playback gets out of sync quickly
DEMO TIME
Maybe
Using grafana with VLC
By unidan