Optimizing the transport network of a large metropolitan area to improve citizen accessibility
Participant:
-
Zaika Vladyslav
Supervisor:
-
Nicolas Nisse
Santiago, Chili
Full access to Santiago city data:
- transportation system
- education system
- health system
- other metrics
Tasks
Process
raw data
Improve
accessibility
- reduce amounts
- fix errors
- readable view
- propose improvements
- calculate new locations
Challenges
Data analysis:
- big amounts of data;
- improve computations;
- correct the data;
Algorithmic:
- analyse existing solutions;
- propose own way;
630k nodes and 210k edges in raw
Related Work
1. Bus Control Strategy Application: Case Study of Santiago Transit System (Pedro Lizana, Juan Carlos Muñoz, Ricardo Giesen, 2014)
2. More Passengers and Reduced Costs—The Optimization of the Berlin Public Transport Network (Tom Reinhold, A. T. Kearney GmbH, 2008)
3. Evaluation and optimization of urban public transportation networks (Christoph E. Mandl, 2003)
4. Optimization of Bus Route Planning in Urban Commuter Networks (Steven I-Jy Chien, Branislav V. Dimitrijevic, 2003)
Assigned Tasks
1. Formalize raw data. ✓
2. Crate good structures. ✓
3. Fix errors in data. ✓
4. Test them on map.
5. Make research on topic.
6. Check existing solutions.
7. Propose improvements.
8. Test results.
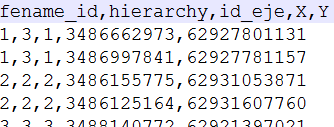
OLD Structures
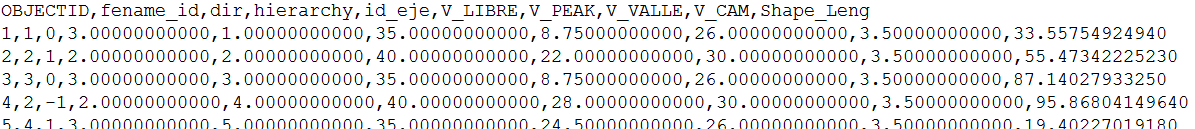
EDGES
POINTS
- access complexity
- wrong data format
- no direct relations
NEW Structures
Point representation:
class Point(object):
def __init__(self, id=0, x=0, y=0, edge_id=0, cell=0):
self.id = id
self.x = int(x)
self.y = int(y)
self.edge_id = int(edge_id)
self.cell = int(cell)
def __hash__(self):
return hash((self.x,self.y))
Edge representation:
<Point, Point>
✓ hash maps for points and edges
✓ clean data representations
✓ easy to access
✓ easy to update
Data Errors
Near points errors
Intersection errors
Near segment errors
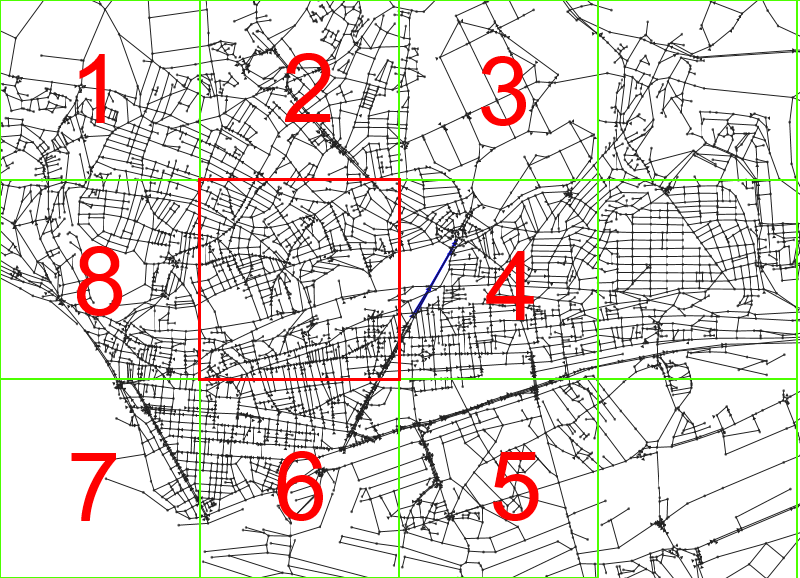
Map Segmentation
We divide map into sectors
Near Points Error
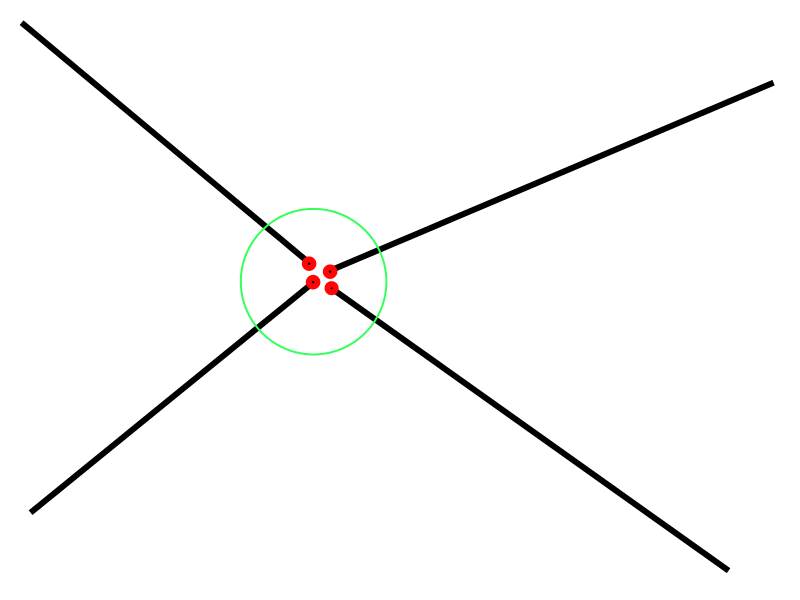
- Wrong GPS coords
- Human factor
- Bug in program
Creates multiple points in places, where it should be only one
Near Points Error
For each segment in our map:
- select all the neighbor segments;
- create possible pairs of nodes;
- check relation(same hierarchy and street);
- calculate euclidean distance;
We fix 213,012 near points errors!
Reduce total number of nodes.
Intersections Error
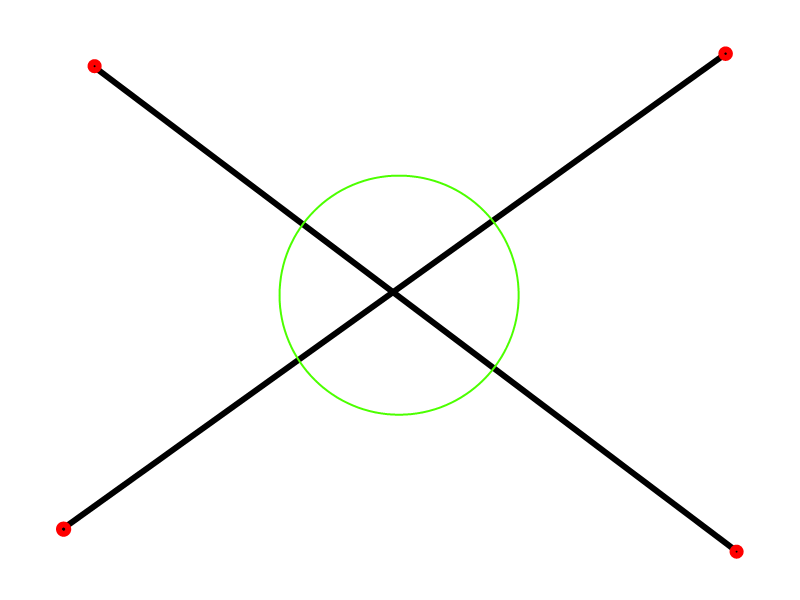
- Wrong GPS coords
- Human factor
- Bug in program
Forgot to create node in crossroads
Intersections Error
For each segment in our map:
- select all the neighbor segments;
- create all possible edge combinations;
- check relation(same hierarchy);
- check intersection presence;
We fix near 2k intersections.
Intersections error fix makes our map more clean
Near Segments Error
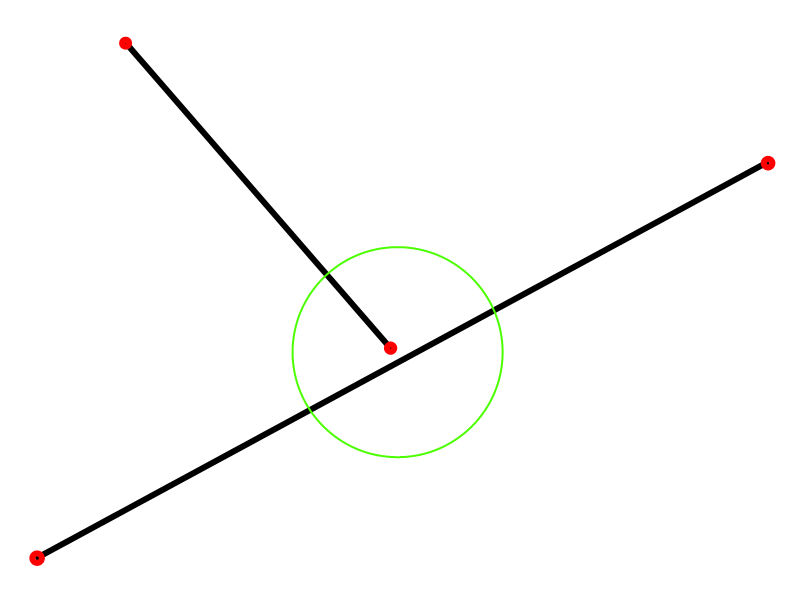
- Wrong GPS coords
- Human factor
- Bug in program
Forgot to connect two streets
Near Segments Error
For each segment in our map:
- select all the neighbor segments;
- create pairs edge - point;
- check relation(same hierarchy);
- check if point is close enough to the edge;
Fix only 27 error situations!
Finalize data relations.
Results
- has clean structures;
- 1/3 of reduced data;
- has straight object connections;
From 628,342 nodes in raw data:
- we fix >200k near point errors;
- we fix ~2k of intersections errors;
- we fix ~ 30 near segments errors;
Finally we get a graph on 415,321 nodes, that:
SAGE in Game
Big graph = big problems
SAGEMath packet is a solution!
- variety of graph functions
- easy to integrate
- strong algorithms implementation
Integrate Santiago Graph -> SageMath
What We Want to Do
1. Finish SAGE tests.
2. Test "static" shortest path algorithms on graph.
3. Propose algorithm improvements.
4. Develop "dynamic" algorithm( taking into account transport, education, health systems).
5. Test new code on Santiago graph.
6. Make conclusions.
Conclusion
1. Learn how other people solve this problem
2. Clean and formalize graph data
3. Integrate SAGE package with Santiago Graph
Thank you
vlad@nowinfinity.com.au
Internship presentation
By Vladyslav Zaika
Internship presentation
Optimizing the transport network of a large metropolitan area to improve citizen accessibility