


Viktor Petukhov
PhD student at the University of Copenhagen
Viktor Petukhov , Peter Kharchenko
1,2
2,3
Harvard Stem Cell Institute
https://bit.ly/2WRTWg5
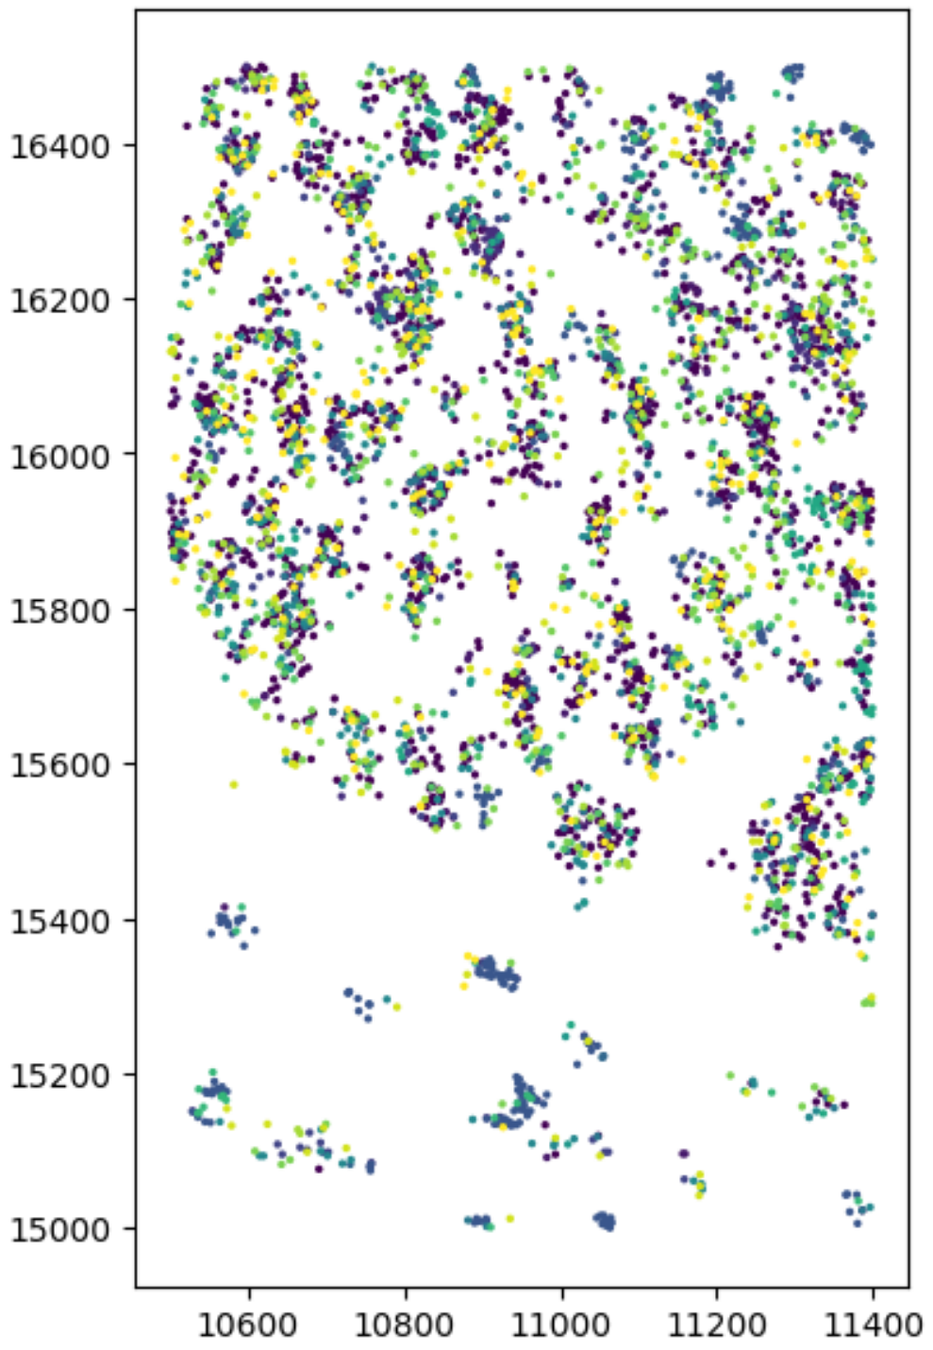
pciSeq
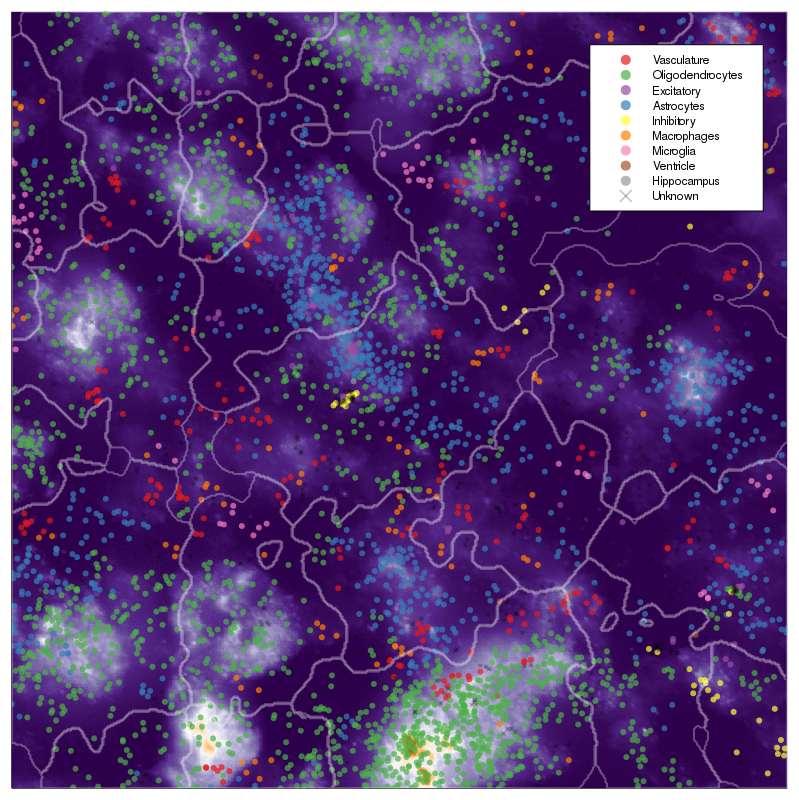
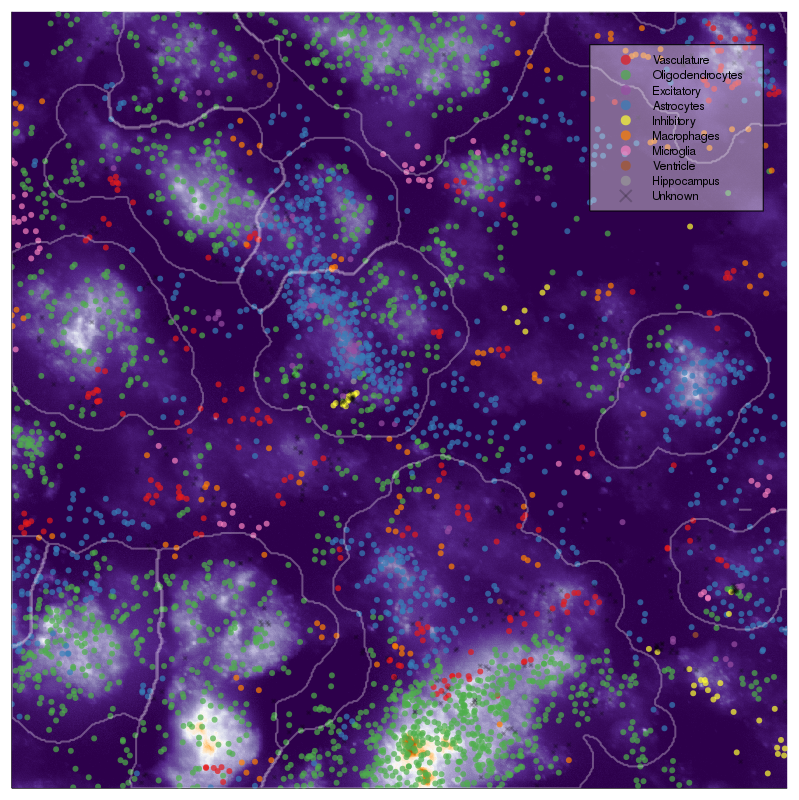
MERFISH
1. X. Qian, K.D. Harris, T. Hauling, D. Nicoloutsopoulos, A.M. Manchado, N. Skene, J. Hjerling-Leffler, M. Nilsson, bioRxiv 2018, 431957276097
2. Moffitt, J. R. et al. Molecular, spatial and functional single-cell profiling of the hypothalamic preoptic region. Science 362 (2018)
[1]
[2]
6
7
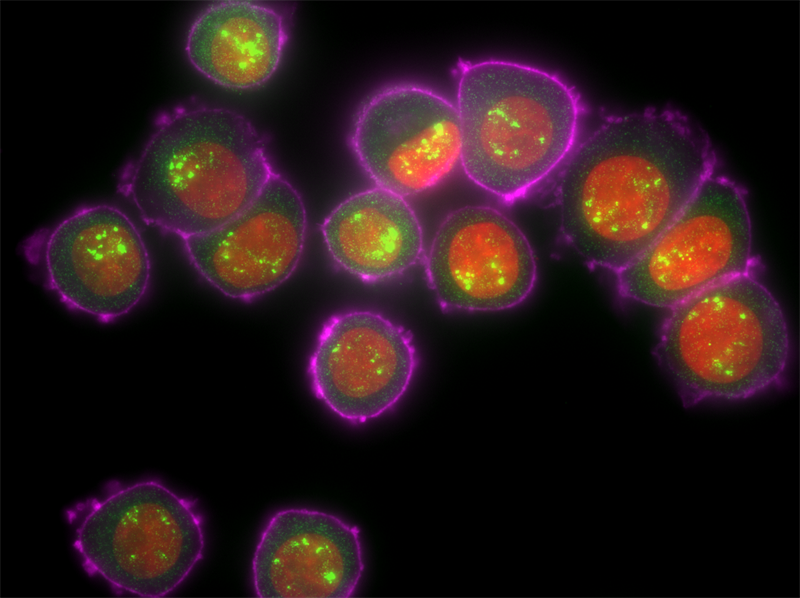
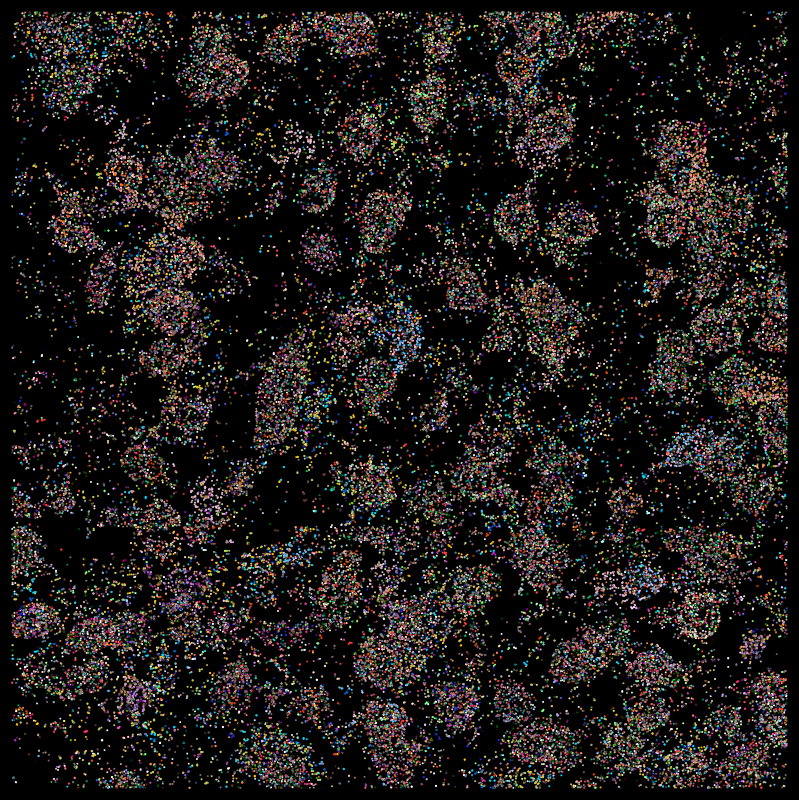
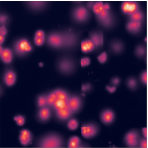
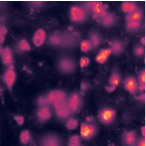
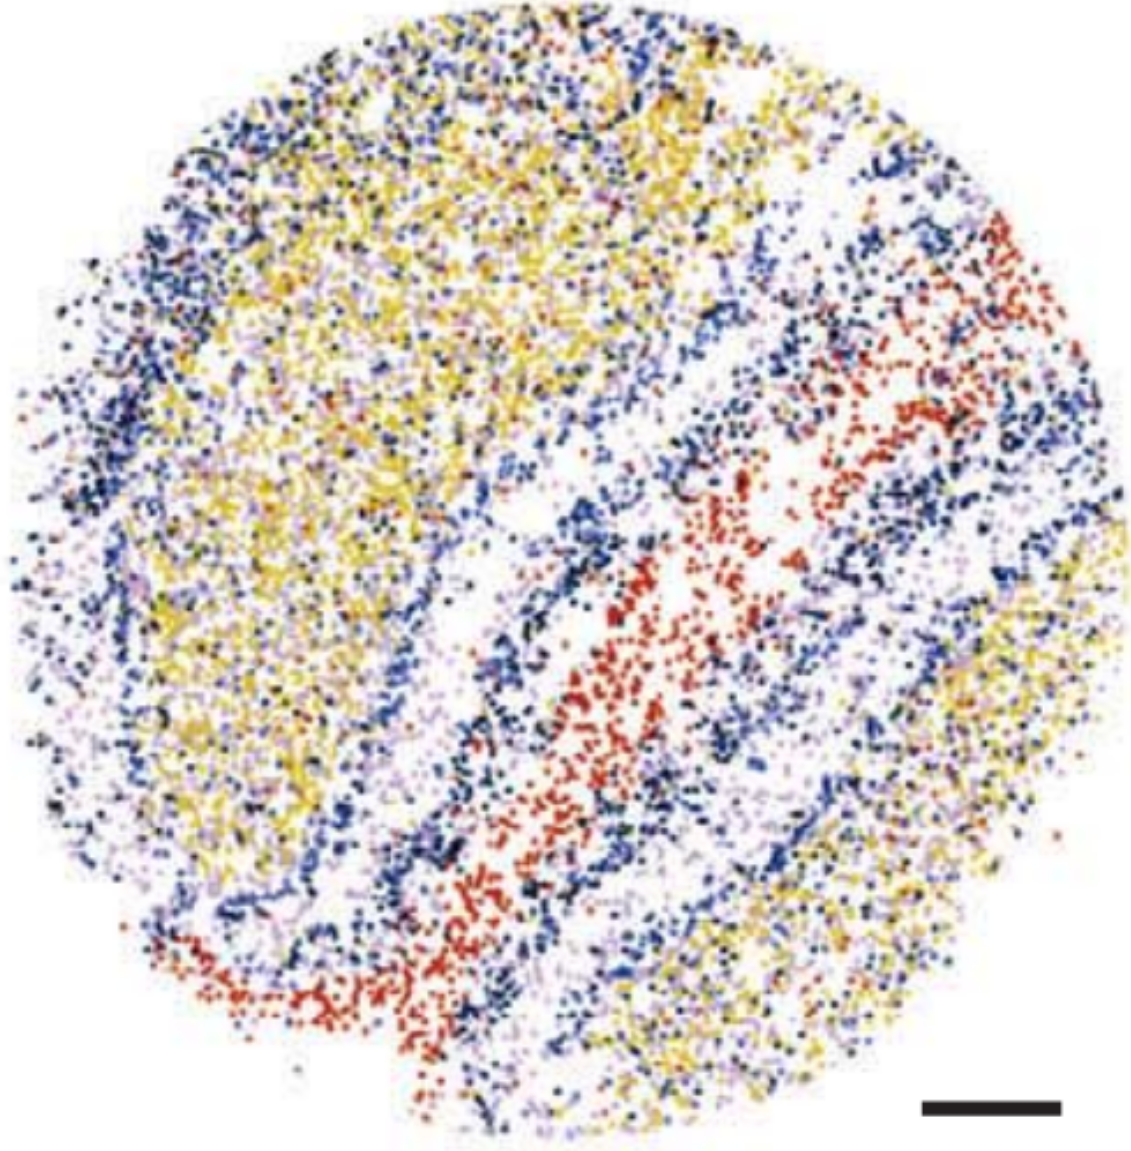
Molecules
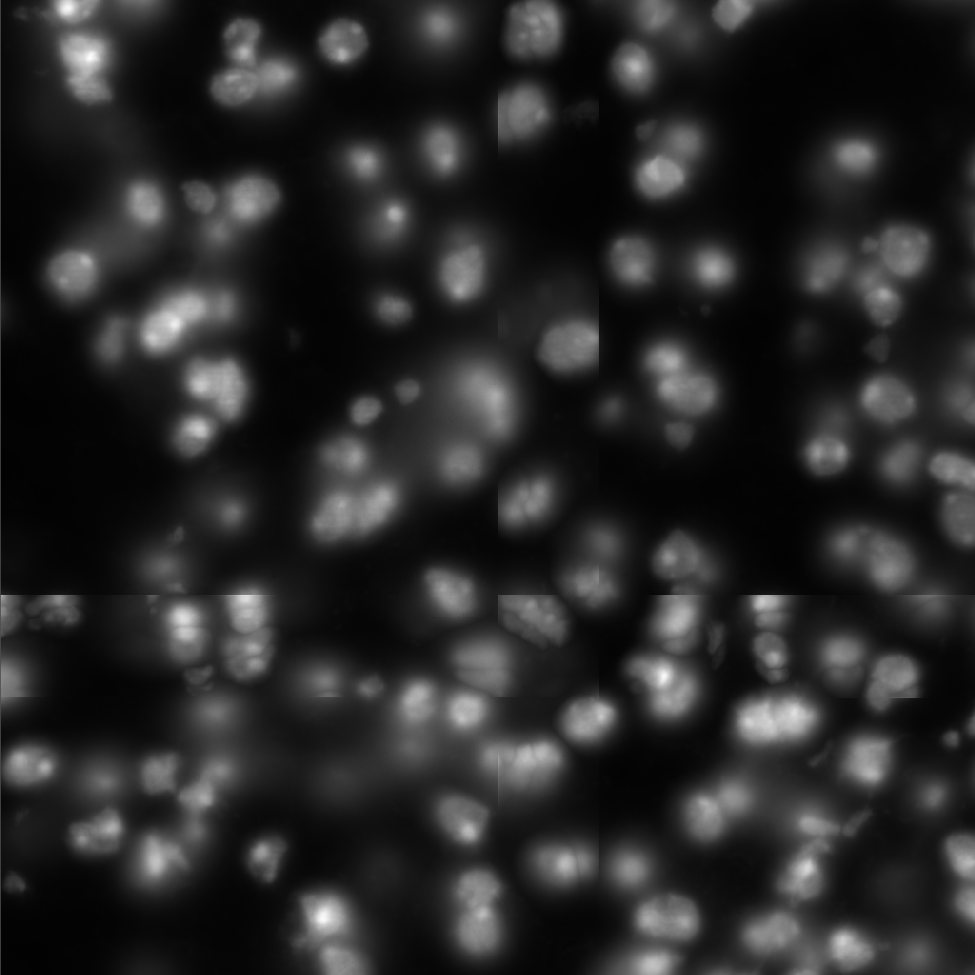
DAPI
*Moffitt, J. R. et al. Molecular, spatial and functional single-cell profiling of the hypothalamic preoptic region. Science 362 (2018)
*Moffitt, J. R. et al. Molecular, spatial and functional single-cell profiling of the hypothalamic preoptic region. Science 362 (2018)
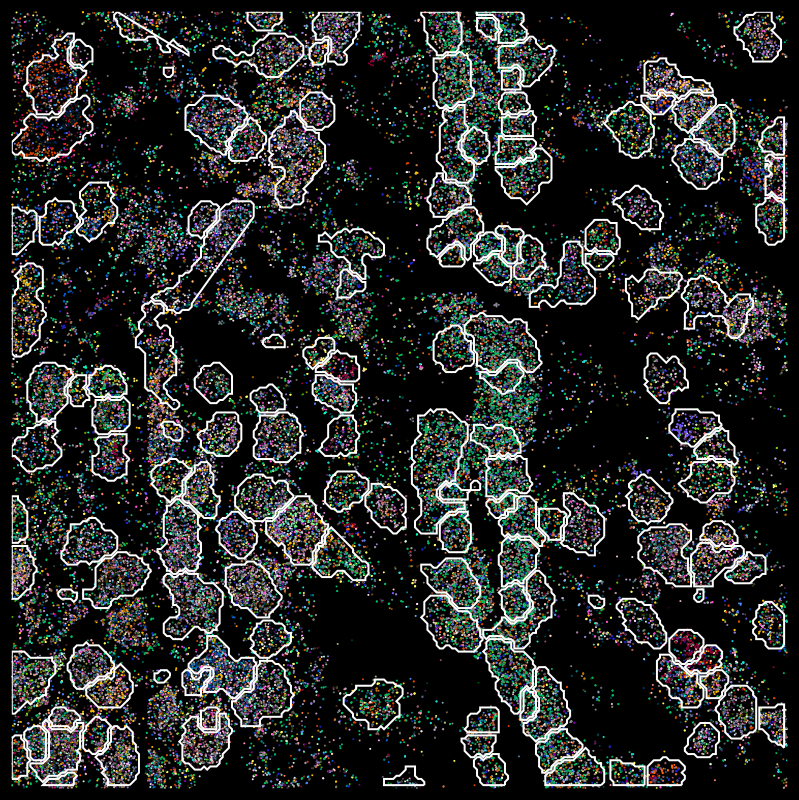
MERFISH
[1]
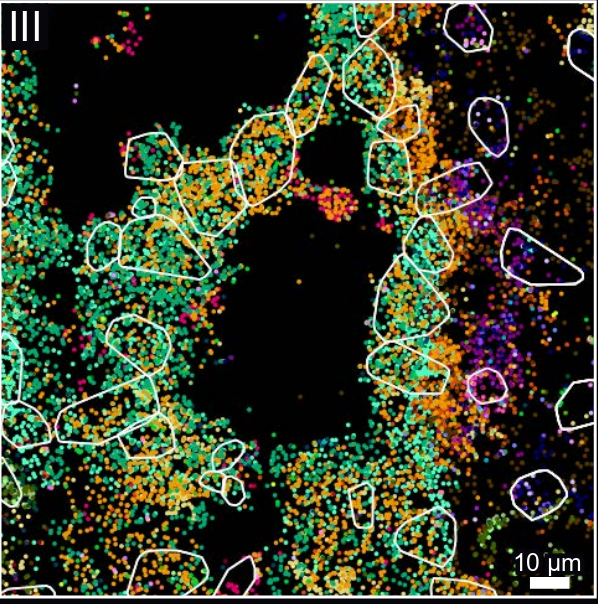
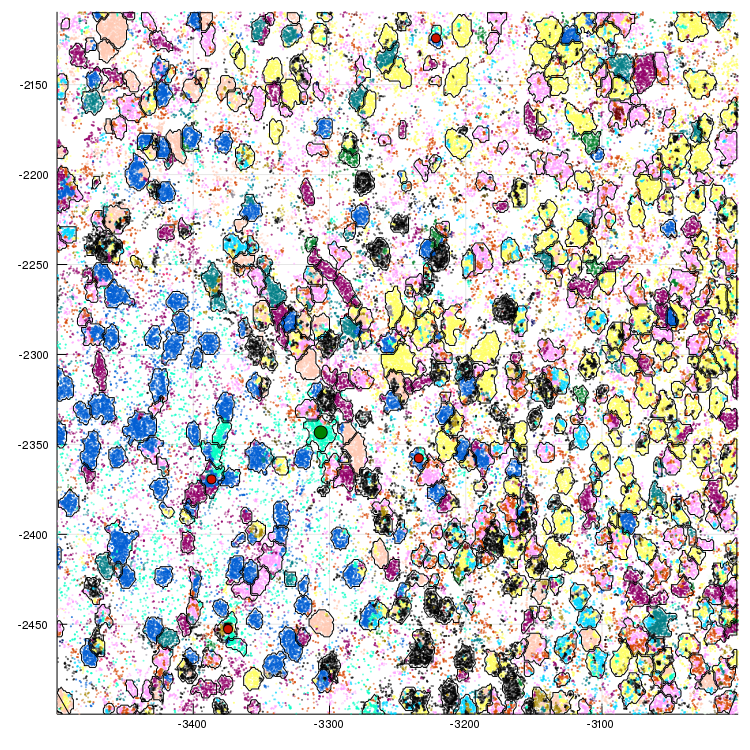
osm-FISH
[2]
1. Moffitt, J. R. et al. Molecular, spatial and functional single-cell profiling of the hypothalamic preoptic region. Science 362 (2018)
2. Simone Codeluppi, Lars E. Borm, Amit Zeisel, Gioele La Manno, Josina A. van Lunteren, Camilla I. Svensson & Sten Linnarsson. Nature Methods 15, 932–935 (2018)
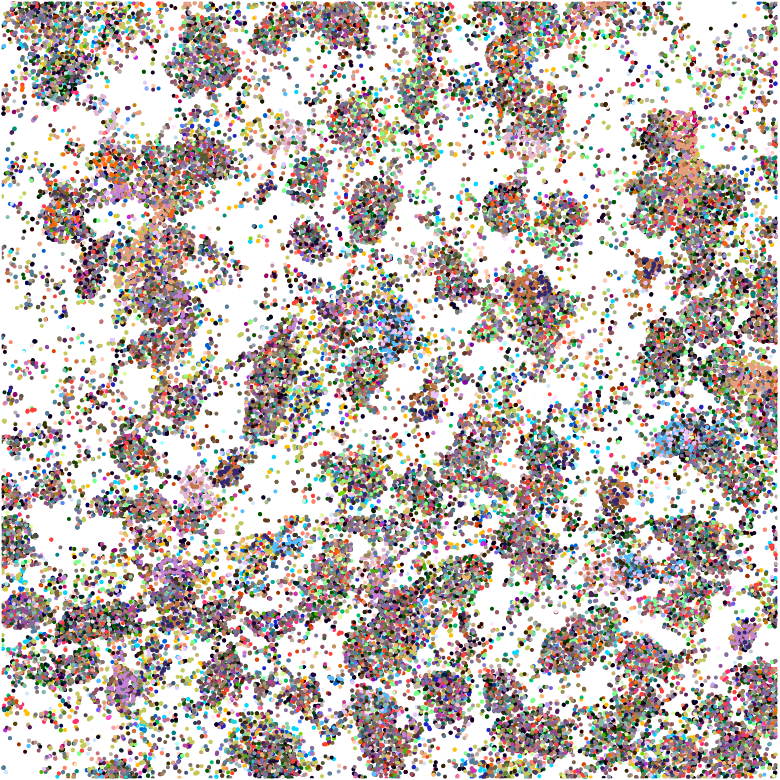
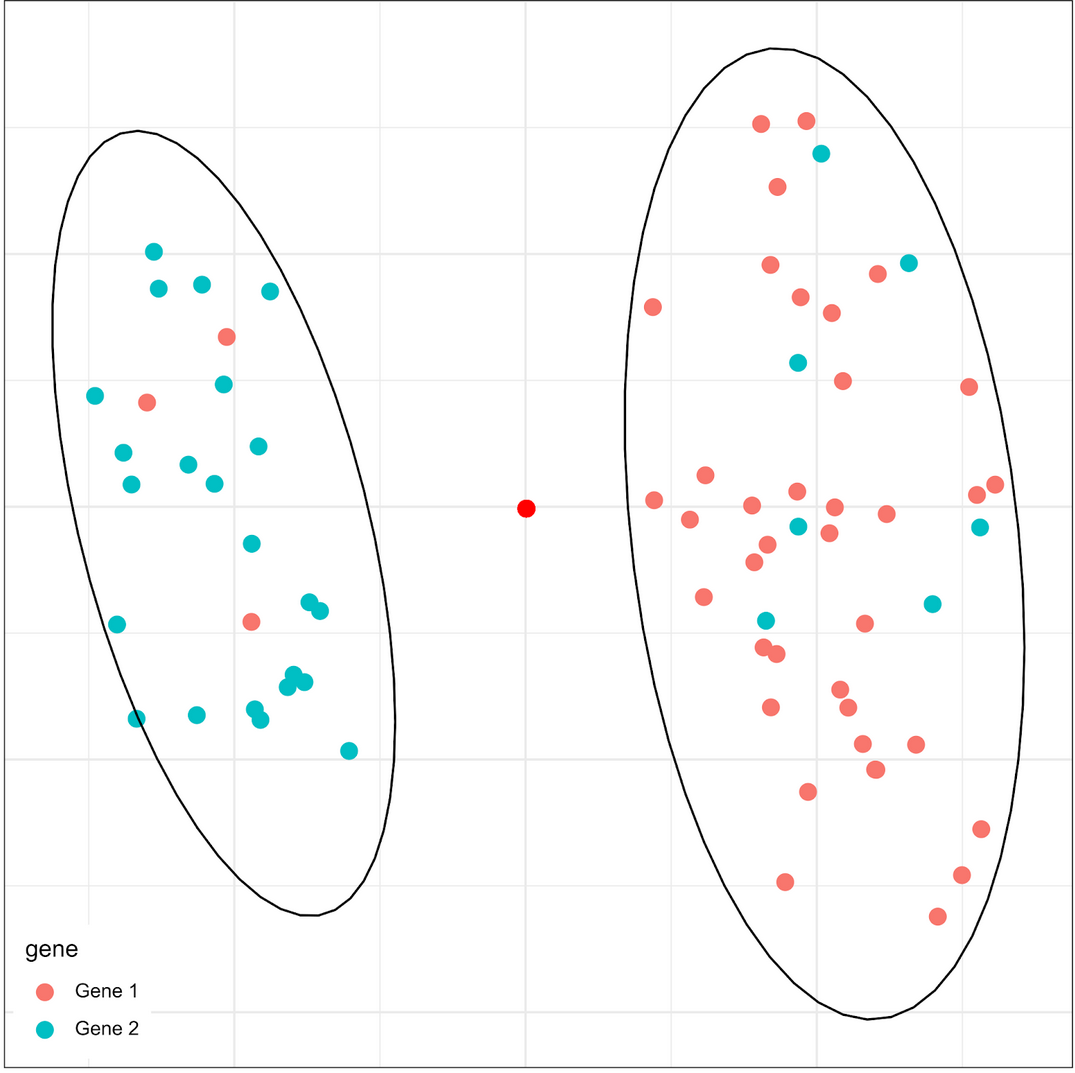
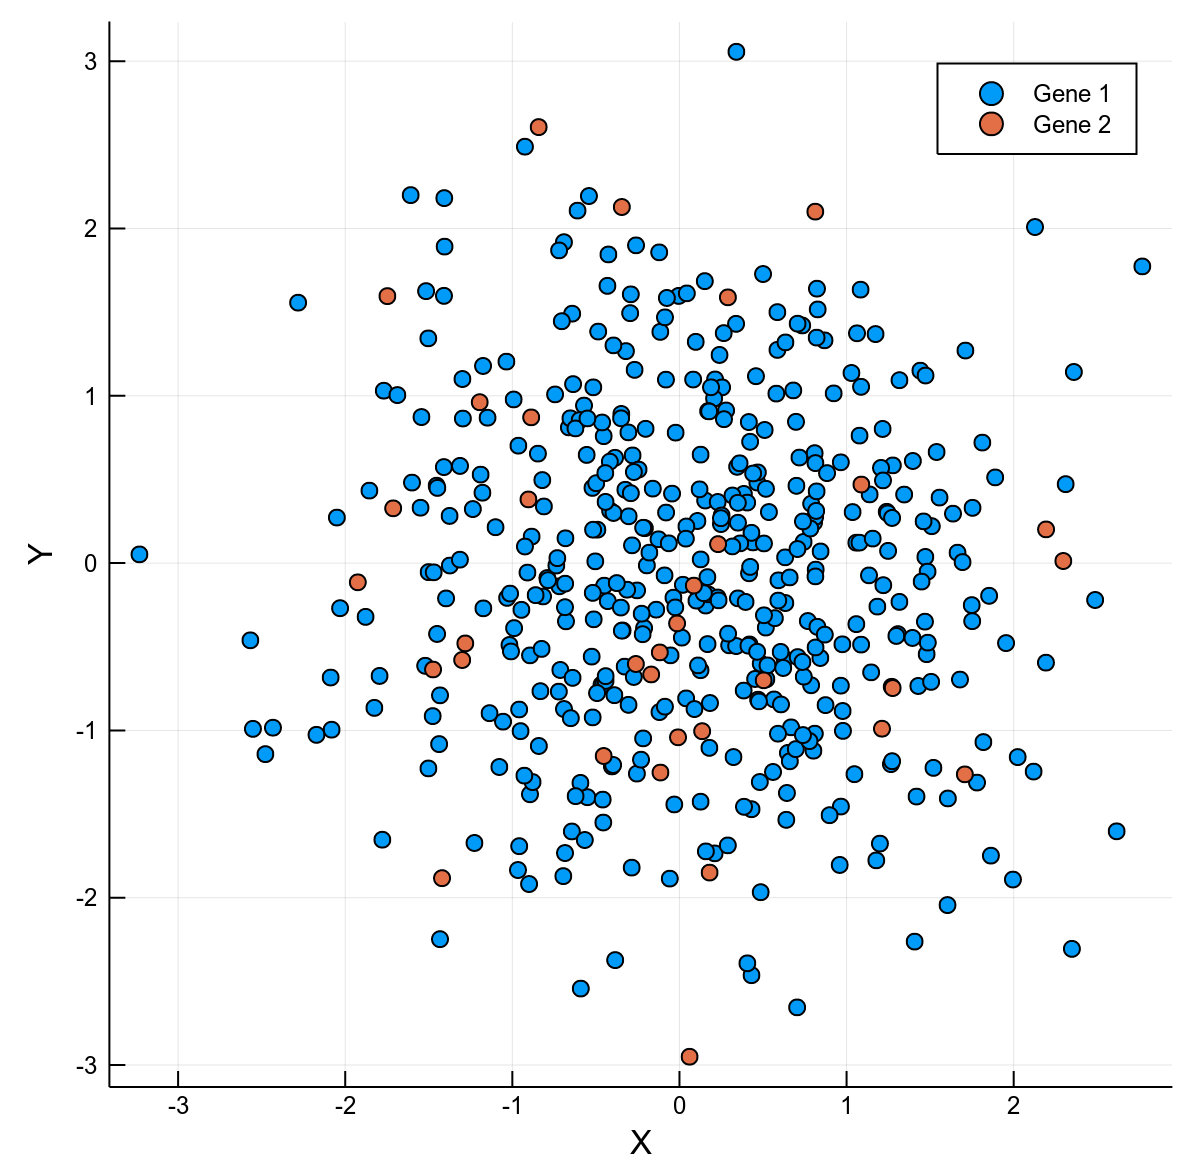
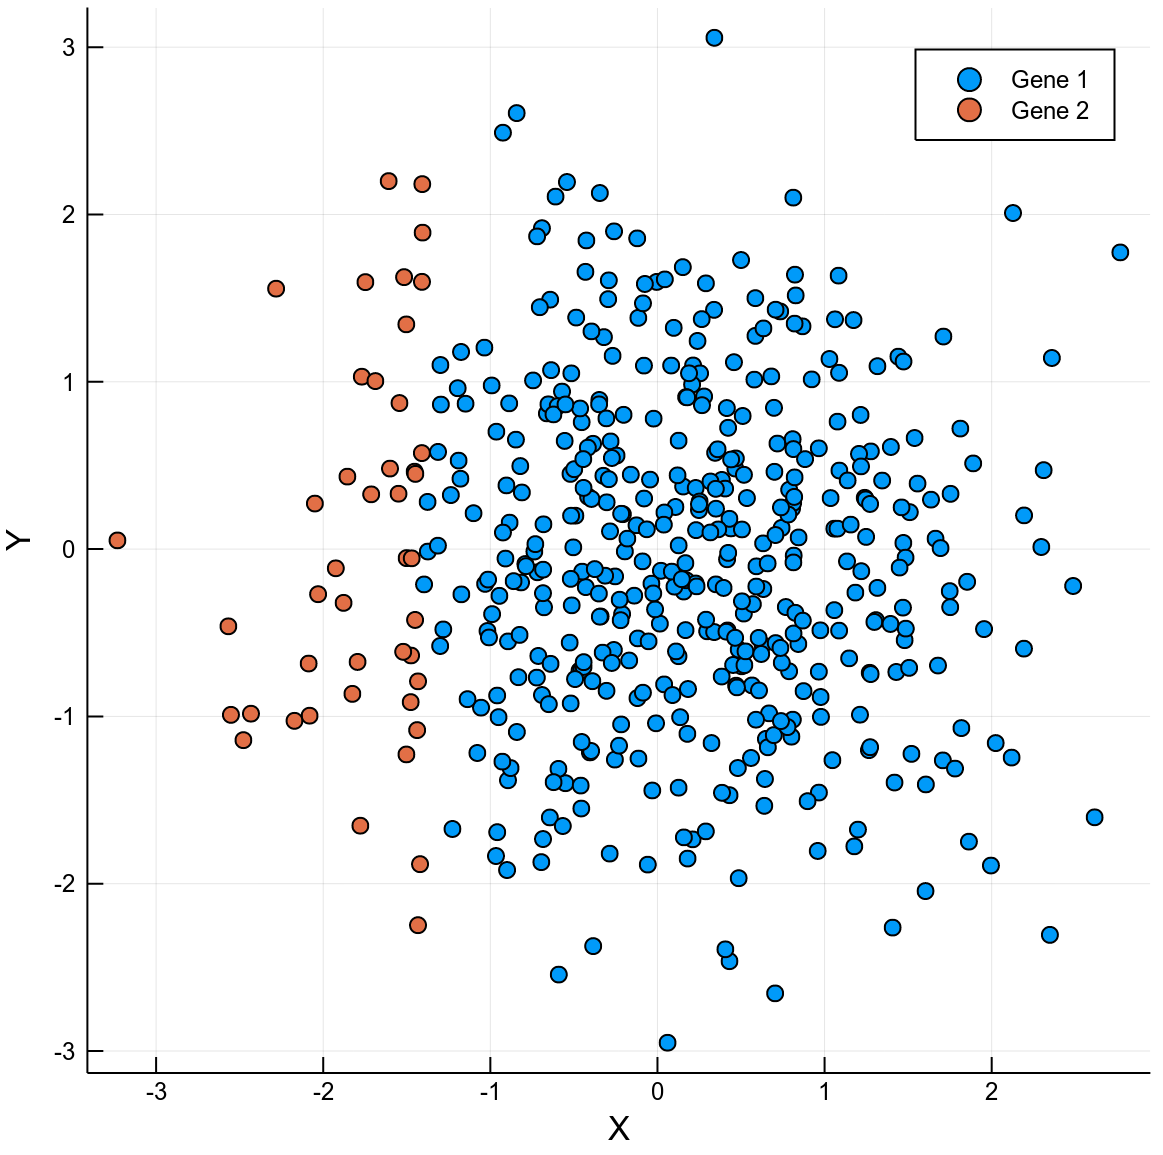
Gene coloring
X
Y
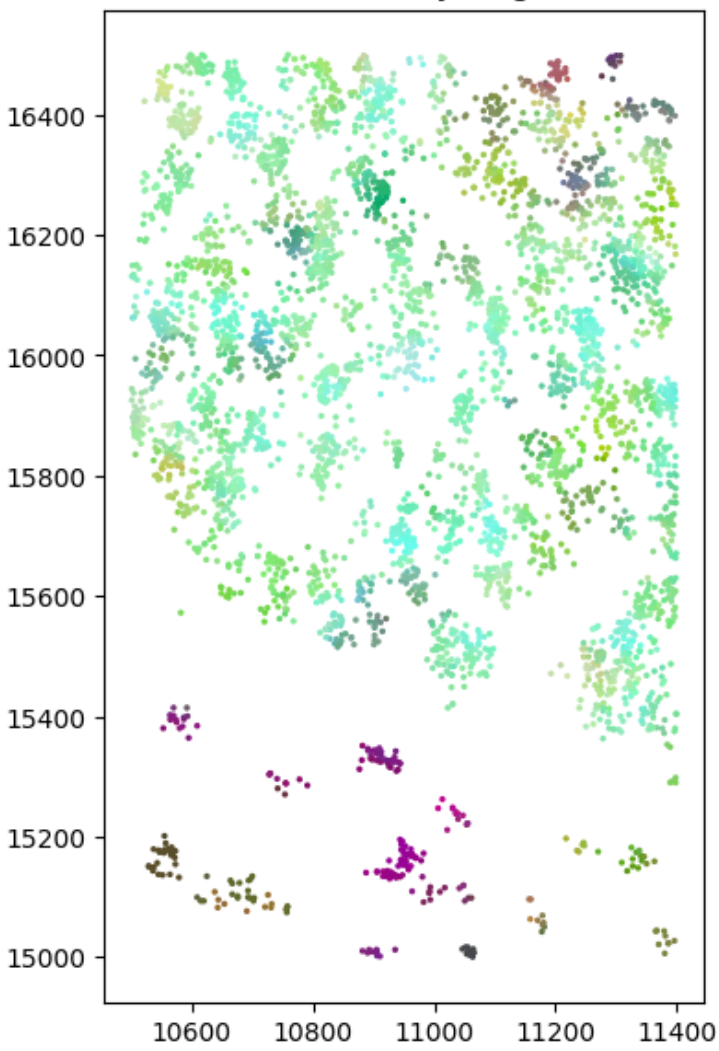
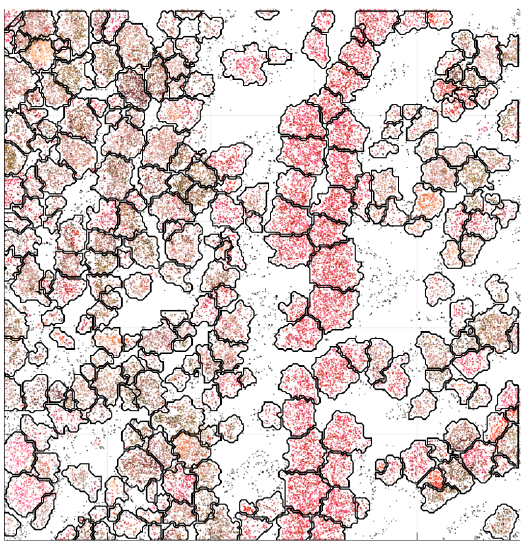
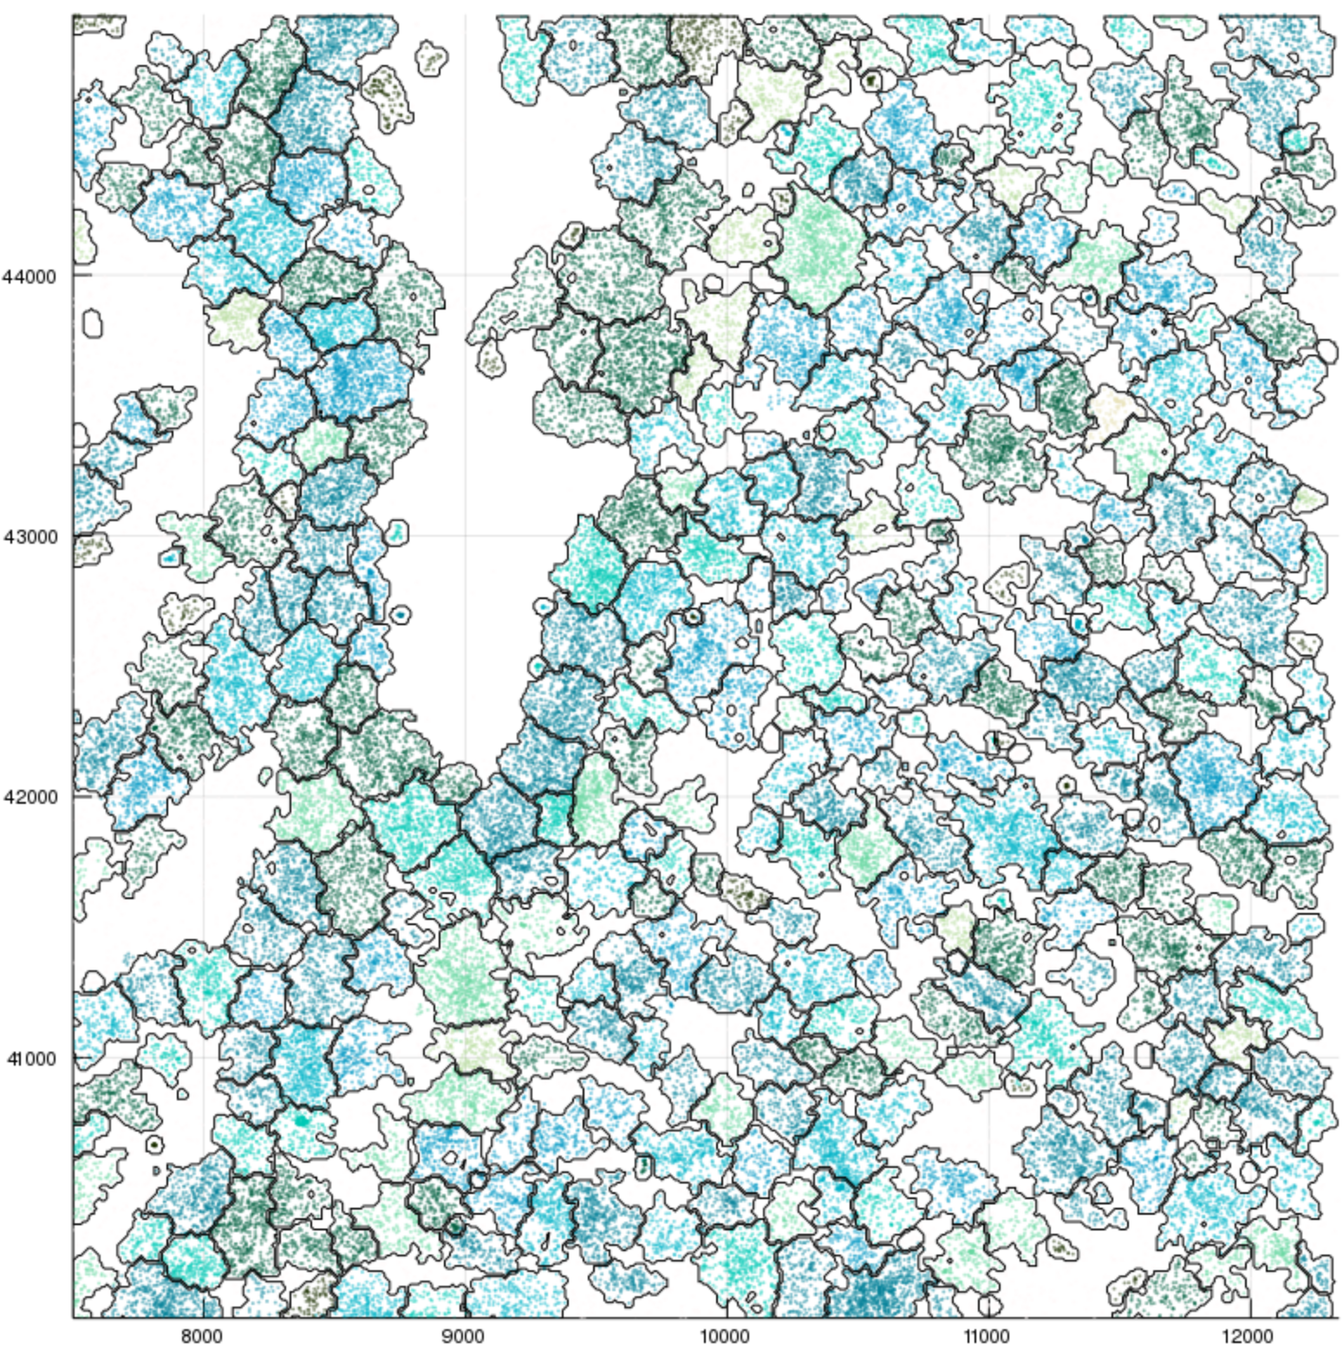
Local expression coloring
X
Y
k nearest neighbors
| Gene 1 | ... | Gene K |
|---|---|---|
| N1 | ... | N_K |
Local expression vector LE
Embed to 3d CIELAB colorspace
| X | Y | Gene |
|---|---|---|
| ... | ... | ... |
Expected
cell size
Transcript data
DAPI
Poly-A
staining
__
Optional
Gene 1: 20%
Gene 2: 80%
Gene 1: 80%
Gene 2: 20%
What's the source?
| X | Y | Gene |
|---|---|---|
| ... | ... | ... |
We know
Cell as a distribution
Non-conjugate, but has good parametrization
(mean and std instead of #degrees of freedom for Inverse Gamma)
Doesn't work yet
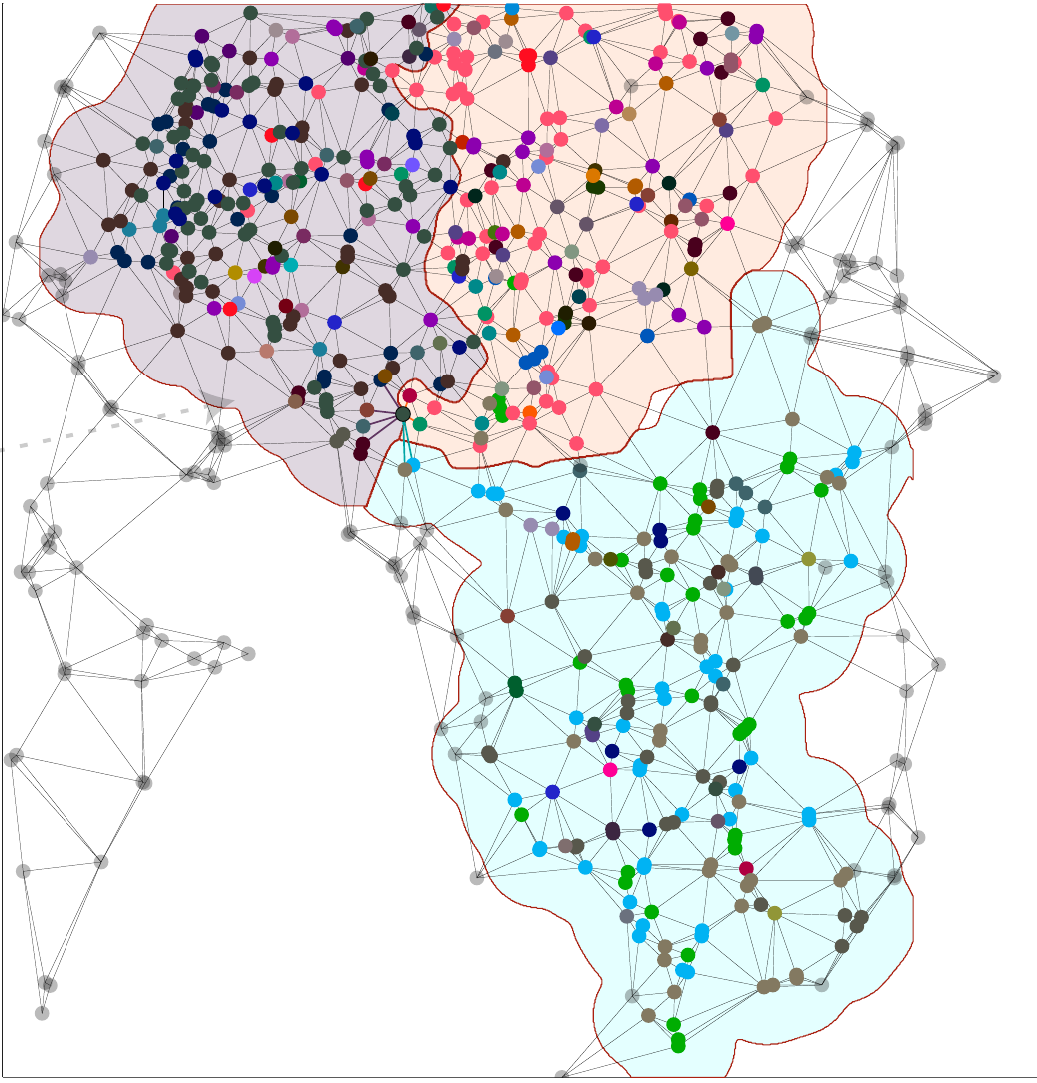
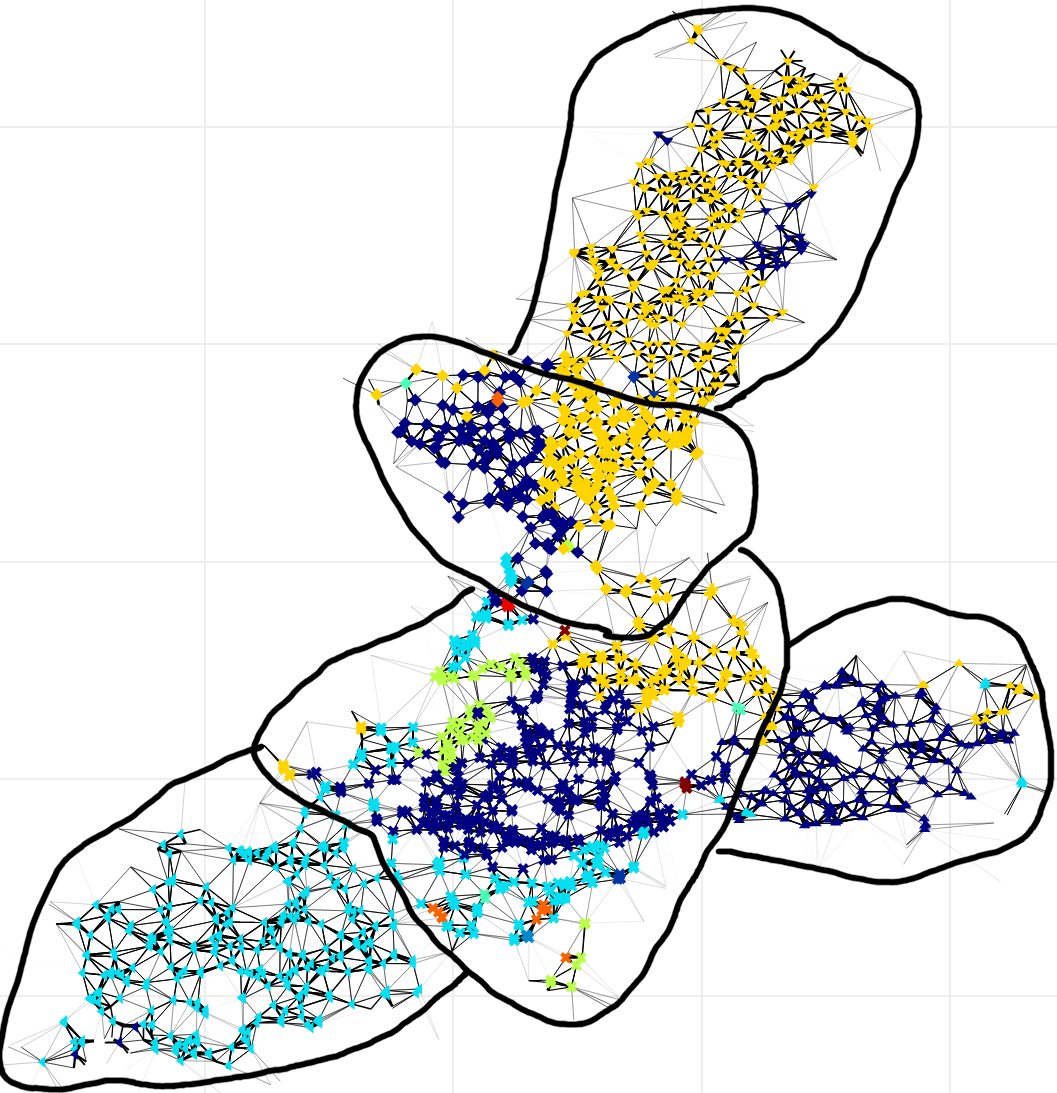
Molecules as a random field
X
Y
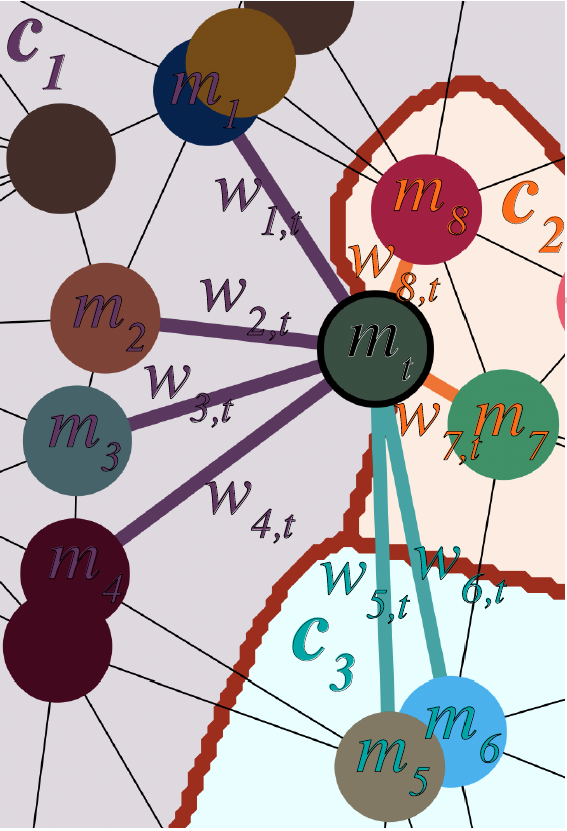
Triangulation
edge weight
local expression
E-step:
Distribution for S-step:
*3 and 4 are probably the same
Local gene composition
Cell type
| Protocol | Baysor | Staining |
|---|---|---|
| osm-FISH | 10059 | 4572 |
| Allen sm-FISH | 4435 | 2525 |
| MERFISH (subset) |
9279 | 6119 |
| pciSeq | 2547 | 3413 |
Number of segmented cells
%of assigned molecules
| Protocol | Baysor | Staining |
|---|---|---|
| osm-FISH | 87.4 | 44.1 |
| Allen sm-FISH | 79.6 | 61.6 |
| MERFISH (subset) |
75.5 | 47.4 |
| pciSeq | 25.7 | 25.8 |
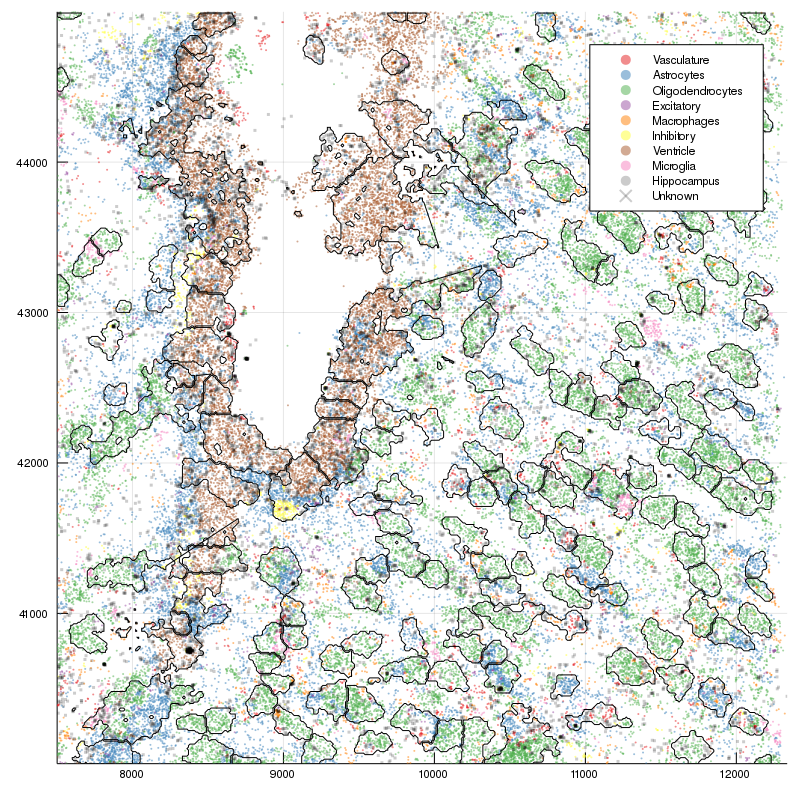
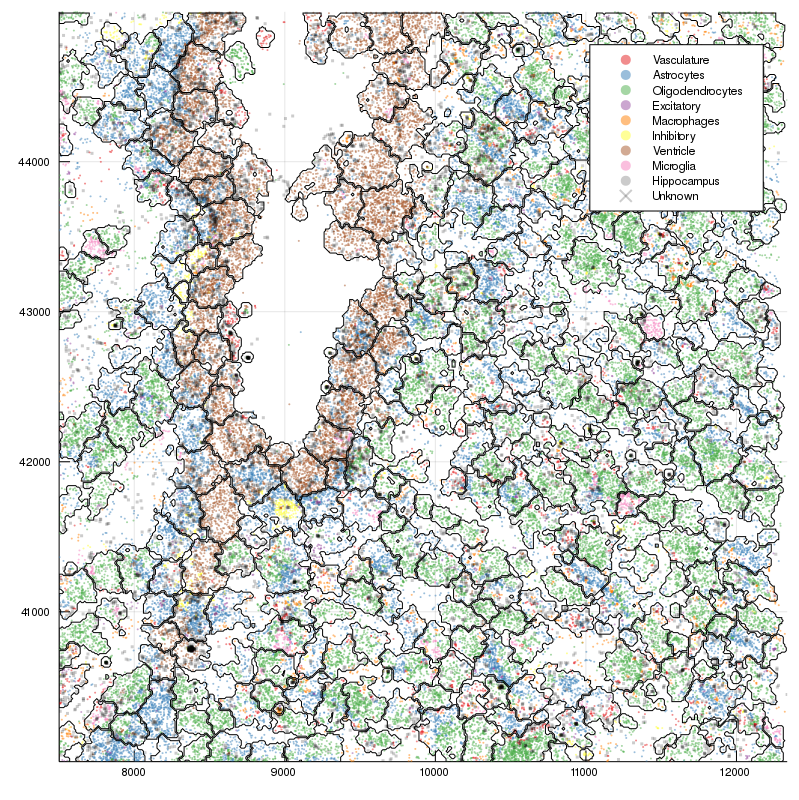
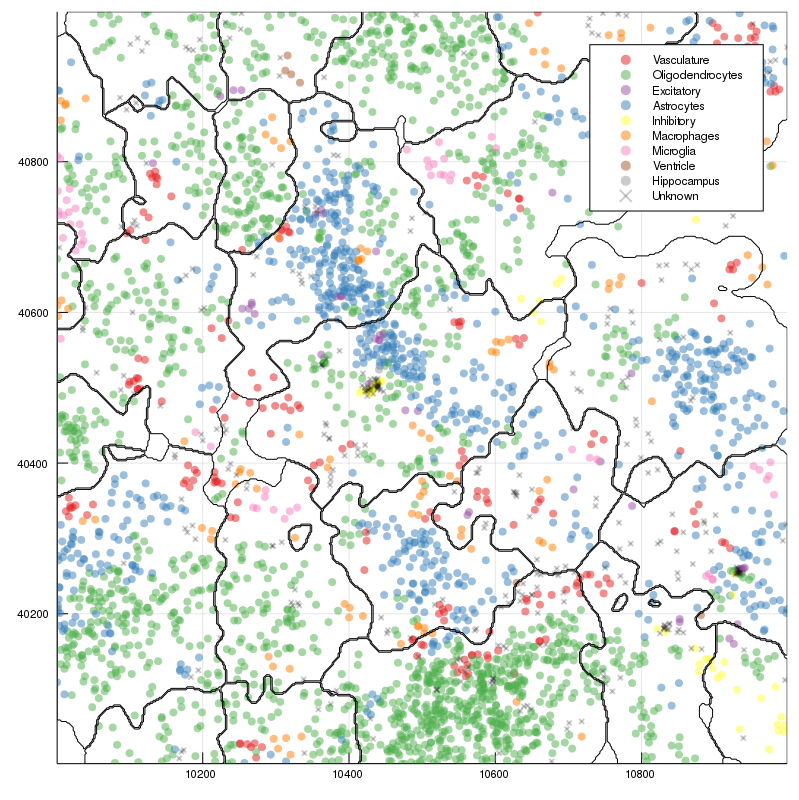
[1]
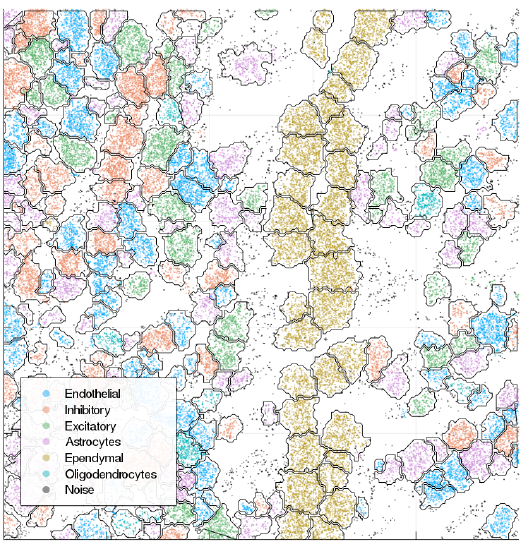
1. Simone Codeluppi, Lars E. Borm, Amit Zeisel, Gioele La Manno, Josina A. van Lunteren, Camilla I. Svensson & Sten Linnarsson. Nature Methods 15, 932–935 (2018)
Low expression / false positive
Contamination
Local gene composition
Cell type
+
osmFISH paper annotation
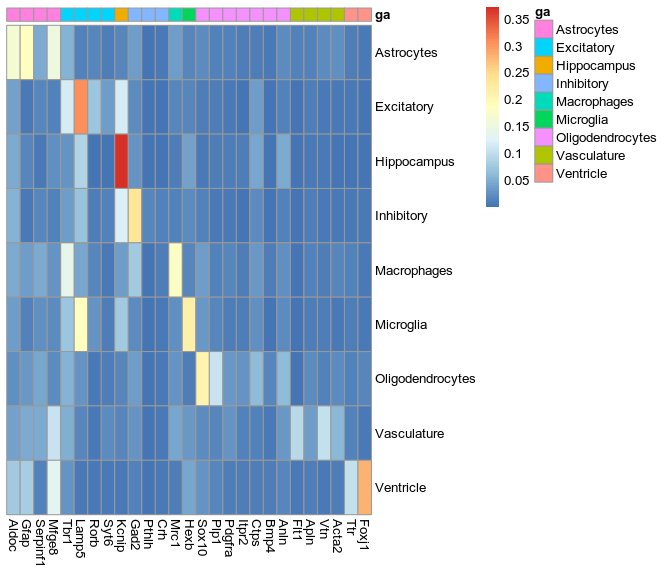
>Inhibitory
expressed: Gad2, Pthlh, Crh
not expressed: Tbr1, Rorb, Mfge8, Cpne5

>Excitatory
expressed: Tbr1, Lamp5, Rorb, Syt6
not expressed: Mfge8, Gad2, Mrc1

>Astrocytes
expressed: Aldoc, Gfap, Serpinf1, Mfge8
not expressed: Hexb, Lamp5, Mrc1, Gad2, Sox10, Rorb, Tbr1, Syt6, Plp1

>Oligodendrocytes
expressed: Sox10, Plp1, Pdgfra, Tmem6, Itpr2, Ctps, Bmp4, Anln
not expressed: Hexb, Mrc1, Aldoc, Gfap, Gad2, Tbr1

>Microglia
expressed: Hexb
not expressed: Gad2, Tbr1, Gfap, Mfge8

>Macrophages
expressed: Mrc1
not expressed: Rorb, Lamp5, Syt6, Cpne5, Gfap, Mfge8, Plp1

>Vasculature
expressed: Flt1, Apln, Vtn, Acta2
not expressed: Lamp5, Rorb, Sox10, Gad2, Syt6, Crh

>Ventricle
expressed: Ttr, Foxj1
not expressed: Gad2, Cpne5

>Hippocampus
expressed: Kcnip
not expressed: Gad2, Tbr1, Lamp5, Rorb, Slc32a1

## Inhibitory

>Inh Crhbp
expressed: Crhbp
subtype of: Inhibitory

>Inh Cnr1
expressed: Cnr1
subtype of: Inhibitory

>Inh Kcnip
expressed: Kcnip
subtype of: Inhibitory

>Inh Pthlh
expressed: Pthlh
subtype of: Inhibitory

>Inh Vip
expressed: Vip
subtype of: Inhibitory

>Inh Crh
expressed: Crh
not expressed: Vip
subtype of: Inhibitory

## Vasculature

>Vasc Flt1
expressed: Flt1
subtype of: Vasculature

>Vasc Vtn
expressed: Vtn
subtype of: Vasculature

>Vasc Apln
expressed: Apln
subtype of: Vasculature

>Vasc Acta2
expressed: Acta2
subtype of: Vasculature

## Excitatory

>Ex Rorb
expressed: Rorb
subtype of: Excitatory

>Ex Syt6
expressed: Syt6
subtype of: Excitatory

>Ex Tbr1
expressed: Tbr1
not expressed: Syt6, Rorb
subtype of: Excitatory

>Ex Lamp5
expressed: Lamp5
not expressed: Syt6, Rorb
subtype of: Excitatory

## Oligodendrocytes

>Oligo Cop
expressed: Bmp4
subtype of: Oligodendrocytes

>Oligo MF
expressed: Ctps
subtype of: Oligodendrocytes

>Oligo NF
expressed: Itpr2
subtype of: Oligodendrocytes

>Oligo Precursors
expressed: Pdgfra
subtype of: Oligodendrocytes

>Oligo Mature
expressed: Plp1, Anln
not expressed: Itpr2, Ctps, Bmp4
subtype of: Oligodendrocytes

## Ventricle

>Ependymal
expressed: Foxj1
subtype of: Ventricle

>C. Plexus
expressed: Ttr
subtype of: Ventricle

## Astrocytes

>Astro Mfge8
expressed: Mfge8
subtype of: Astrocytes

>Astro Gfap
expressed: Gfap
not expressed: Mfge8
subtype of: Astrocytes
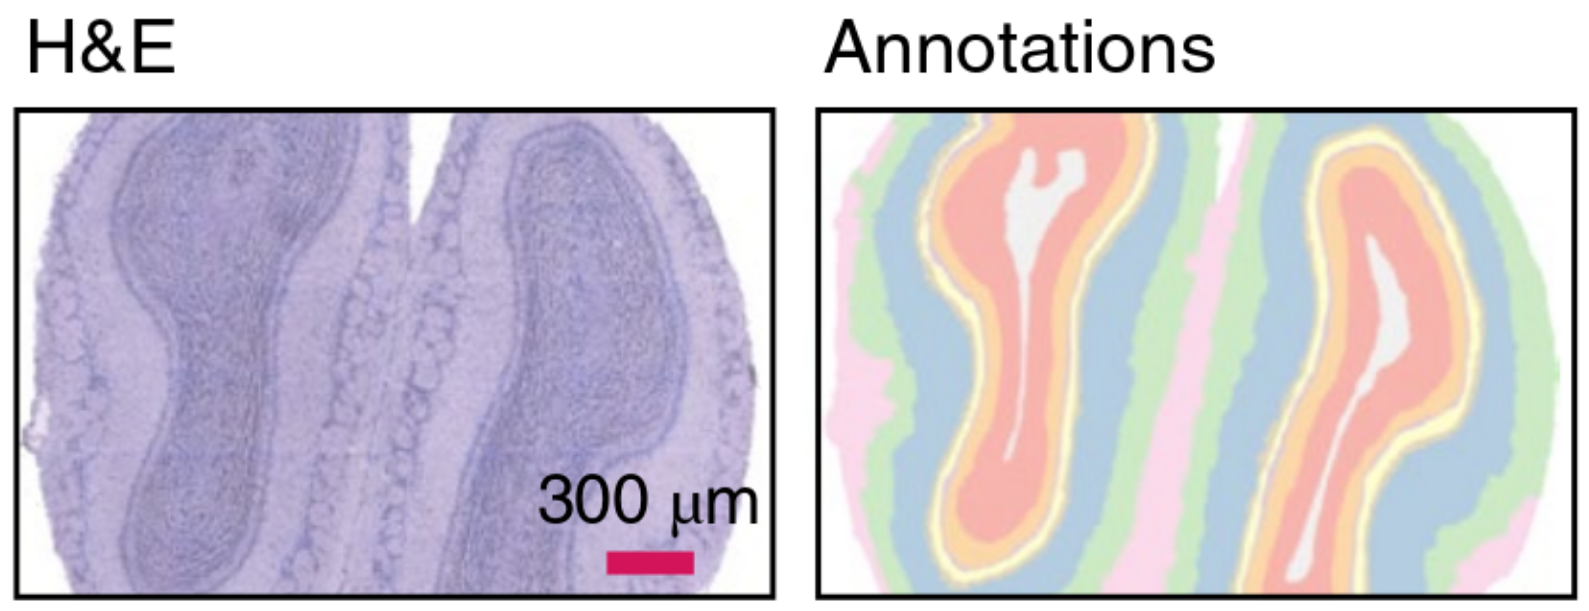
Extracted markers
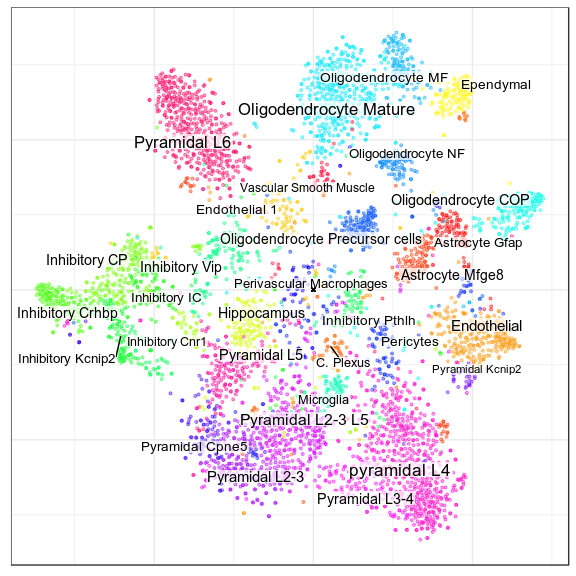
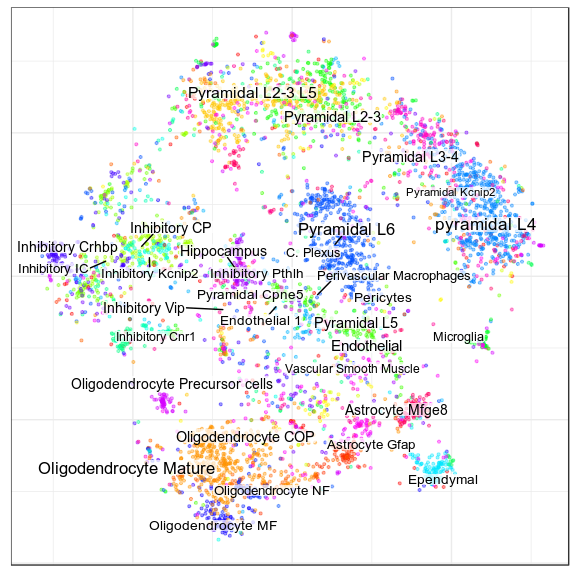
osmFISH paper annotation
Pagoda embedding, same annotation
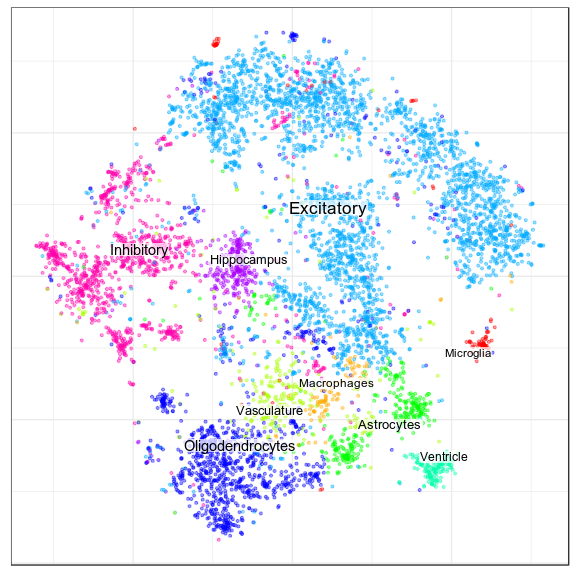
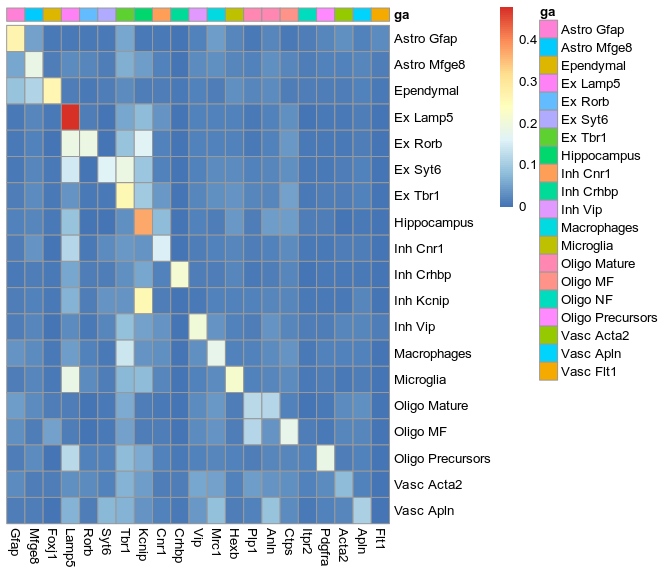
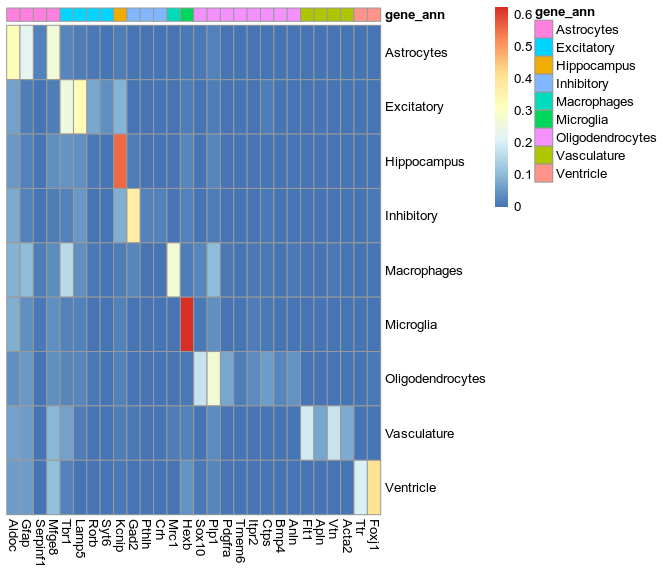
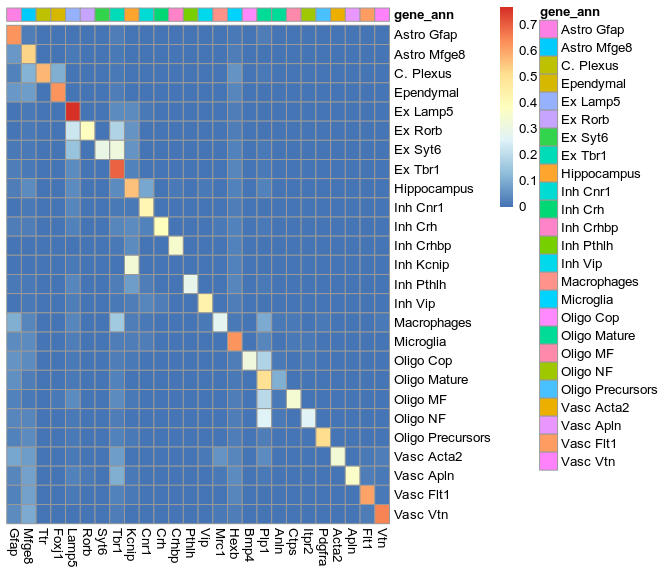
New annotation, level 1
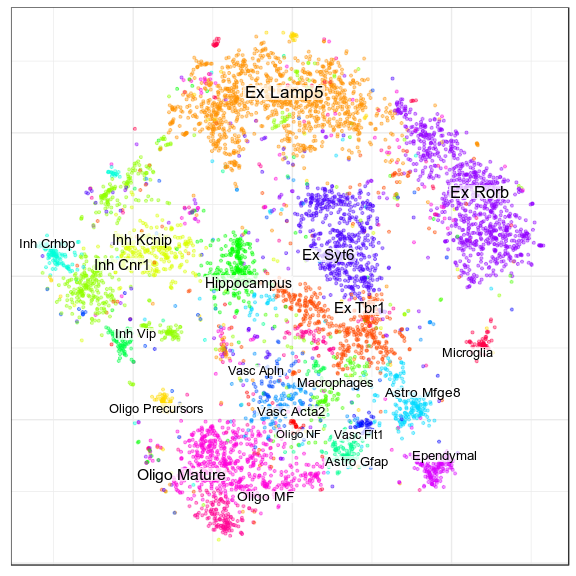
New annotation, level 2
New annotation, level 1
New annotation, level 2
Problems:
1976659 pseudo-cells
Expression is very sparse (10 reads per cell)
Result:
No graph
New annotation, level 1
New annotation, level 2
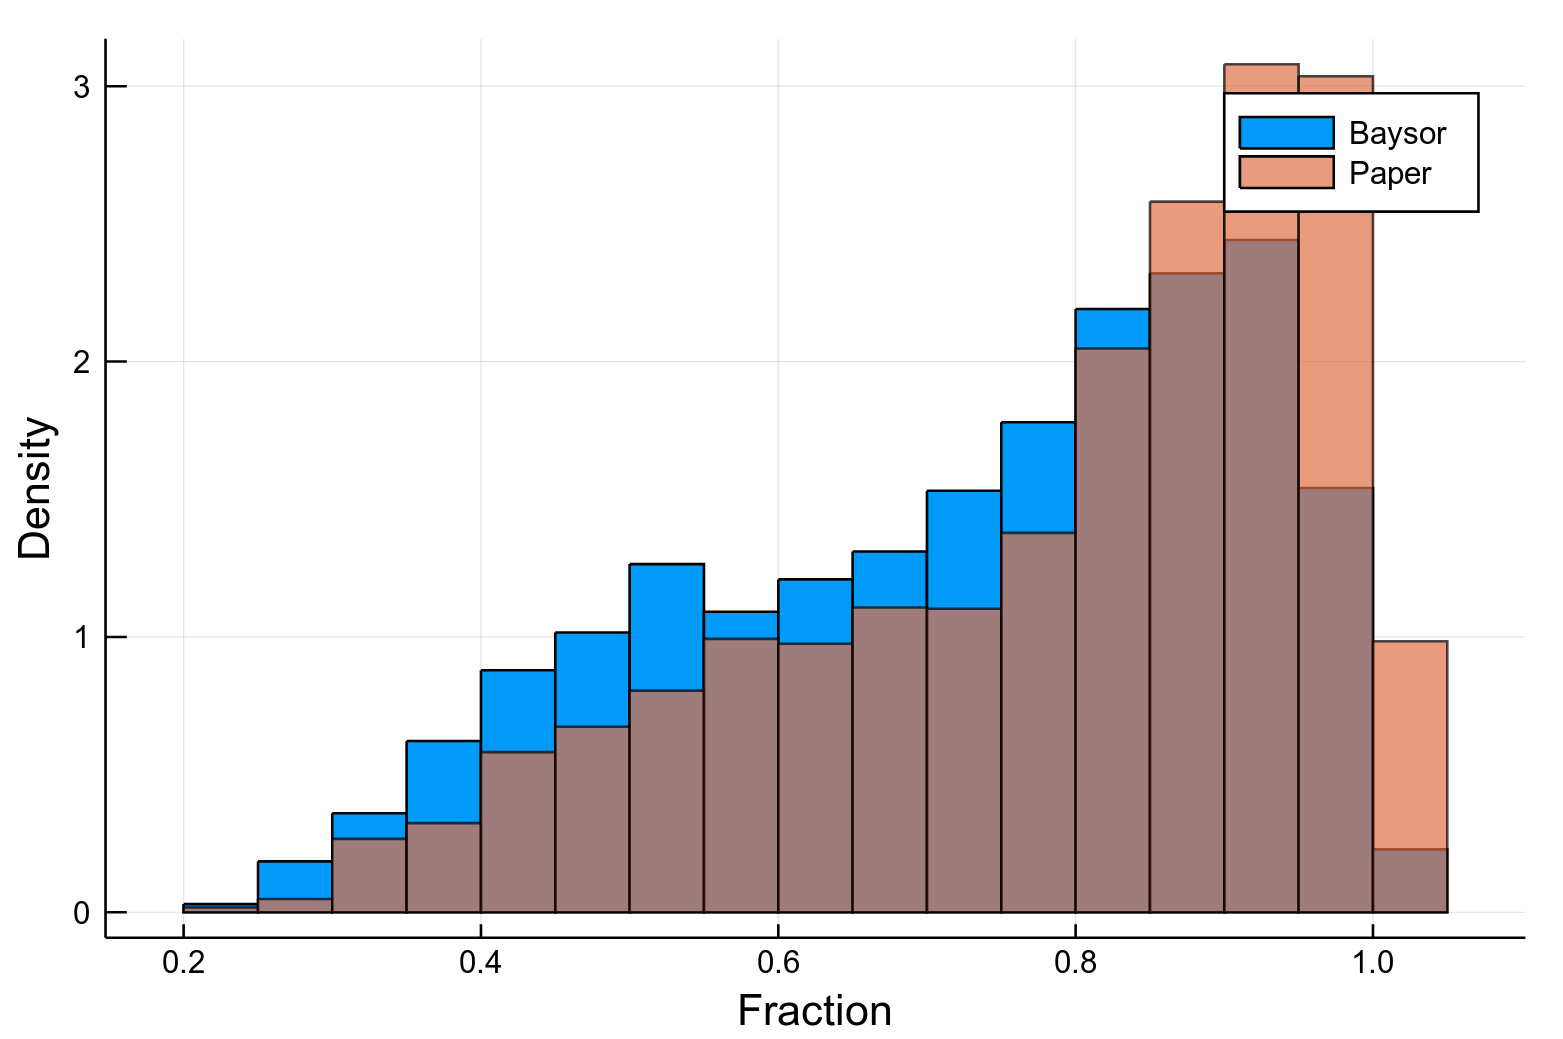
Paper
Baysor
Cell type
Max. fraction
Paper
Baysor
We want to improve this plot
Idea:
Aggregate expression over similar cells
Problems:
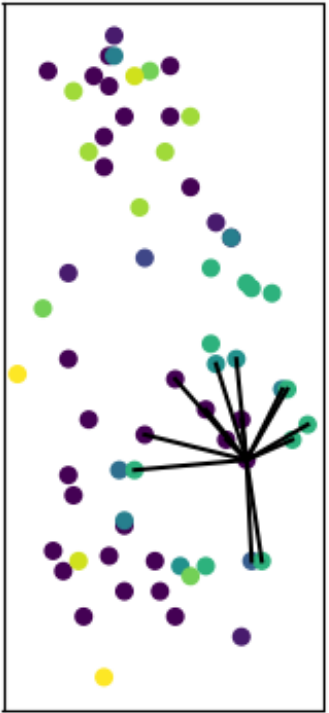
Example cell
Nearest
neighbors
Split-merge algorithm
Chinese restaurant processes
Transcript info
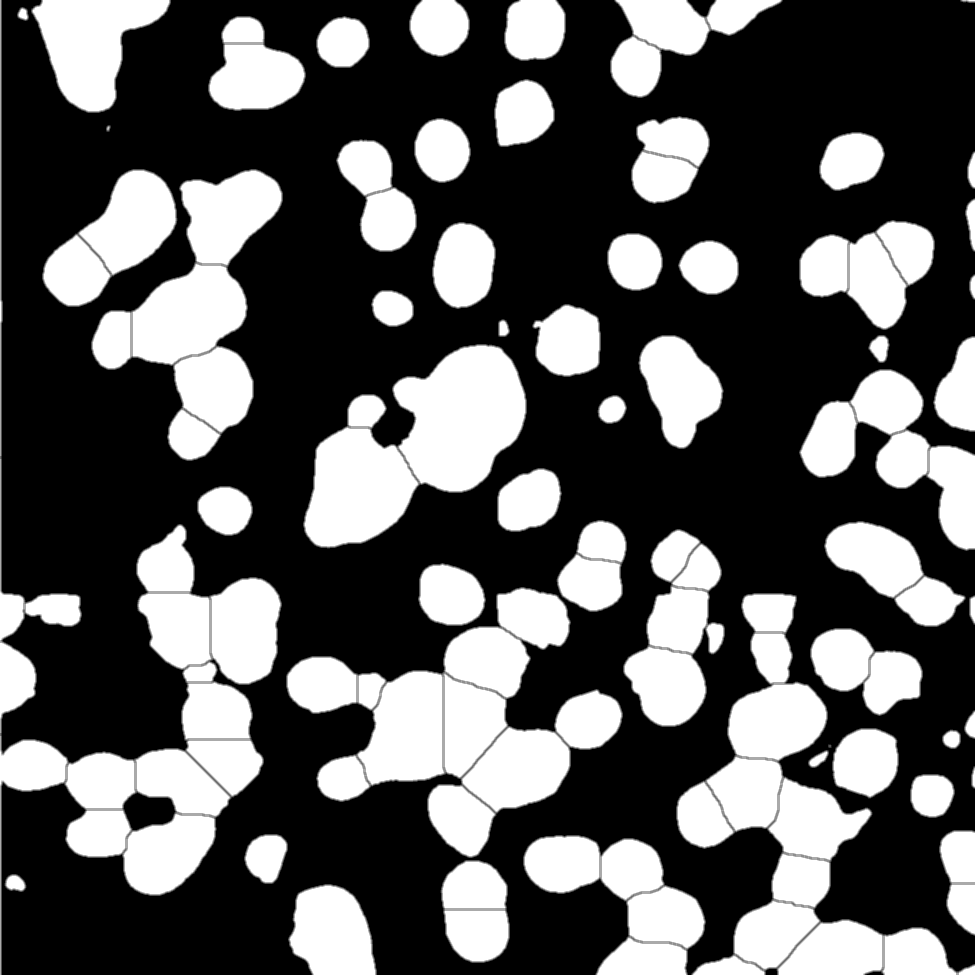
Staining info
Slide-Seq: 10μm beads
500μm
HDST: 2μm wells
By Viktor Petukhov
PKLab progress meeting presentation


