


Viktor Petukhov
PhD student at the University of Copenhagen
Petukhov V, Rydbirk R, Igolkina A, Mei S, Kharchenko P, Khodosevich K
viktor.petukhov@pm.me
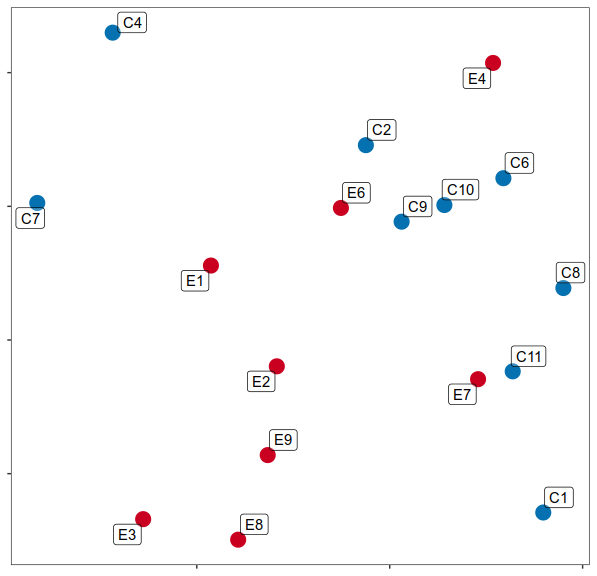
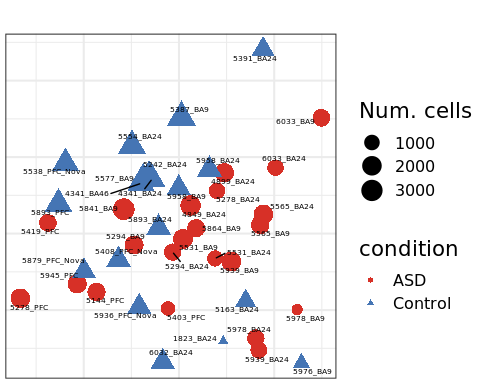
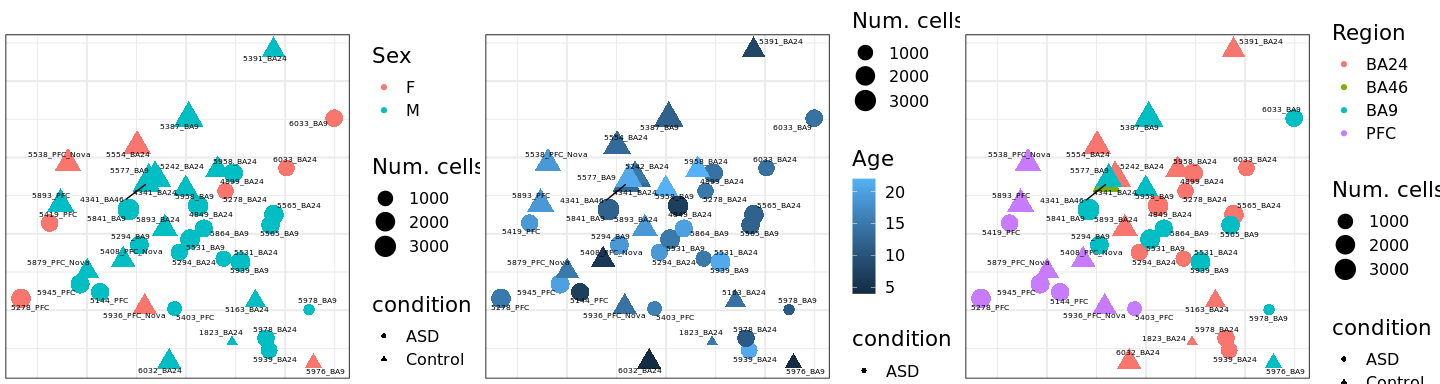
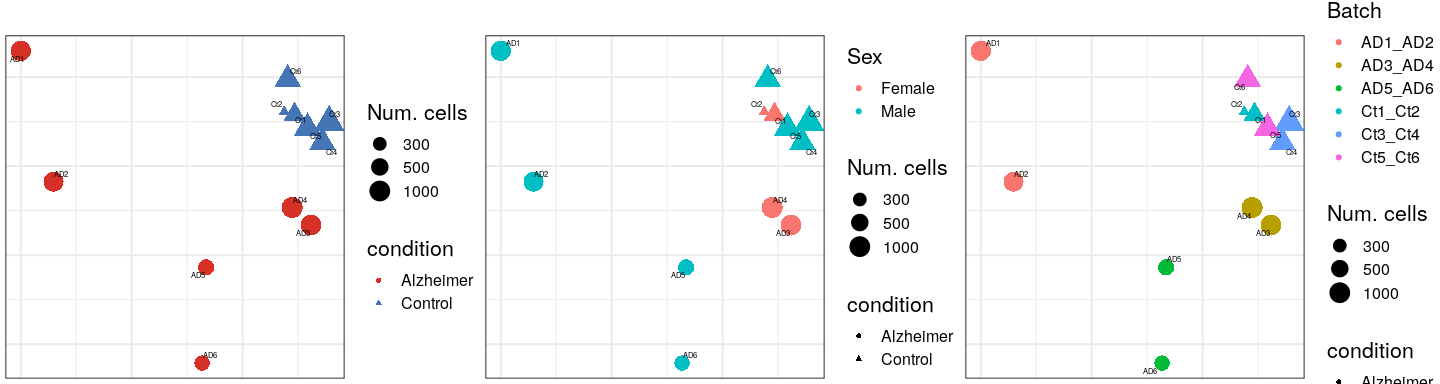
Case samples
Control samples
Prepare for further experiments:
Questions to existing data:
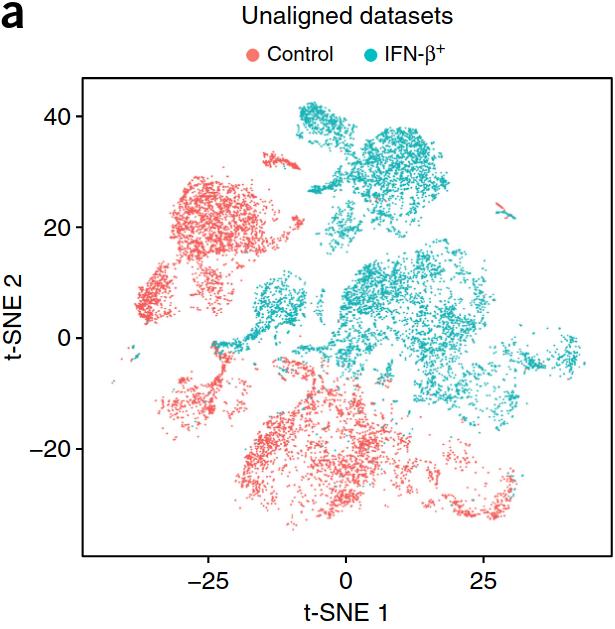
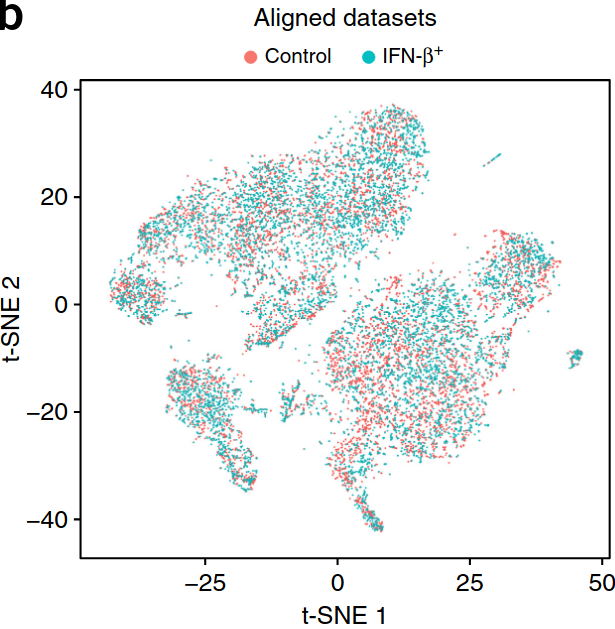
Align samples
scVI, Conos, ..., Seurat
See the review from the Theis lab
Align samples
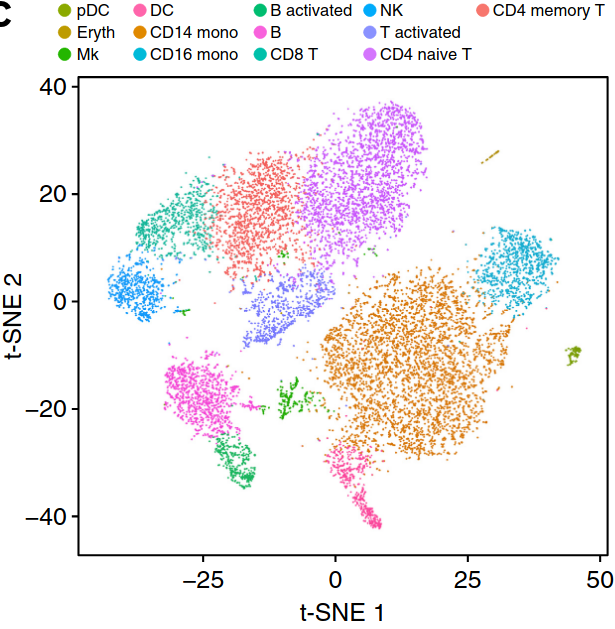
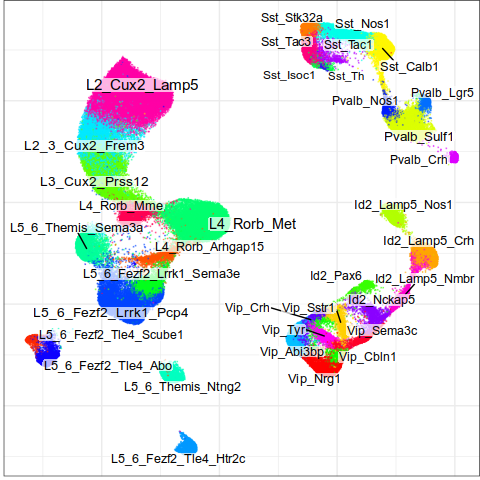
Perform joint annotation
Align samples
Perform joint annotation
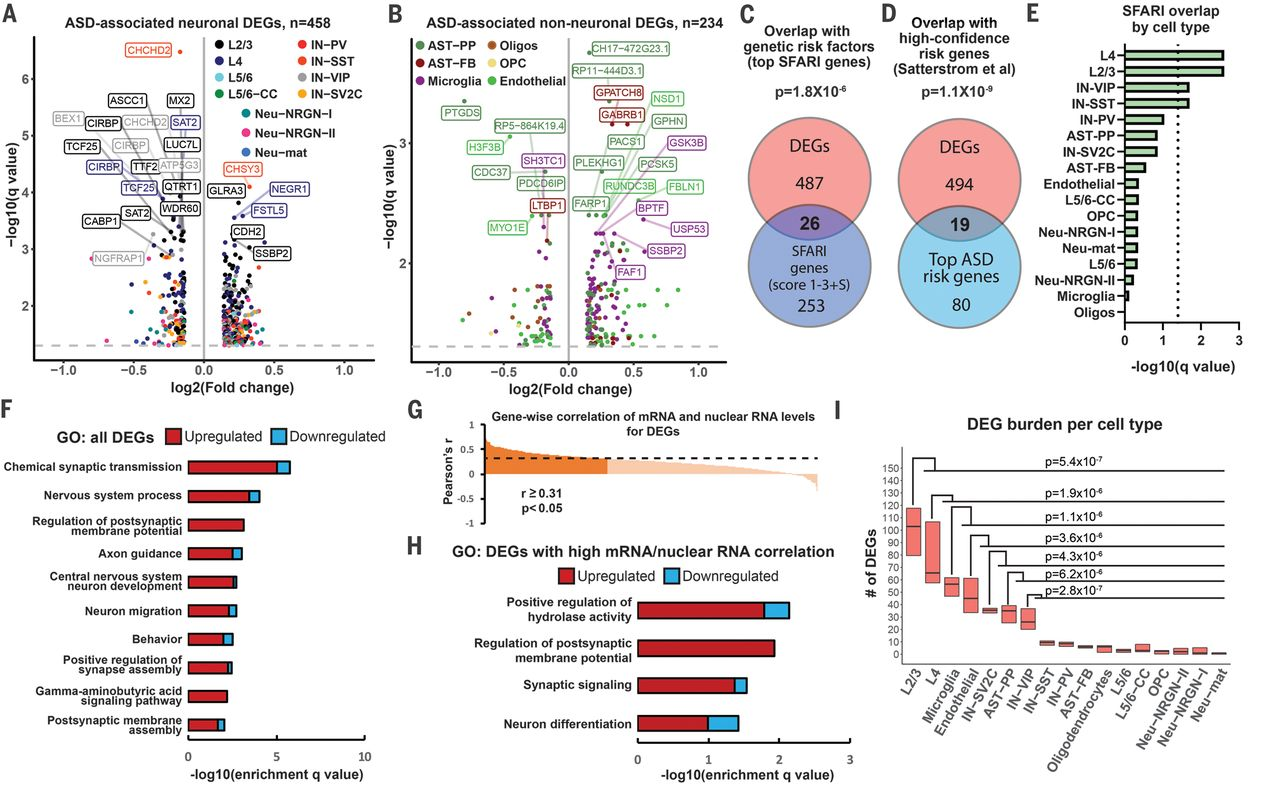
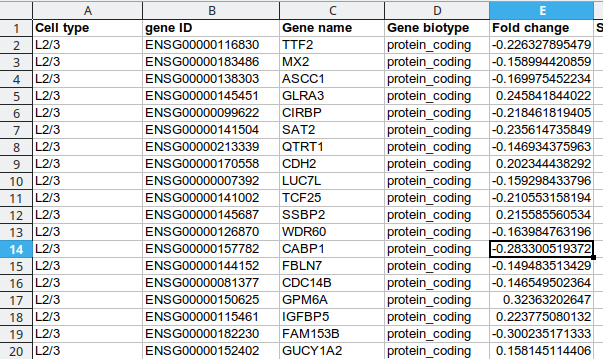
Run differential expression
Align samples
Perform joint annotation
Run differential expression
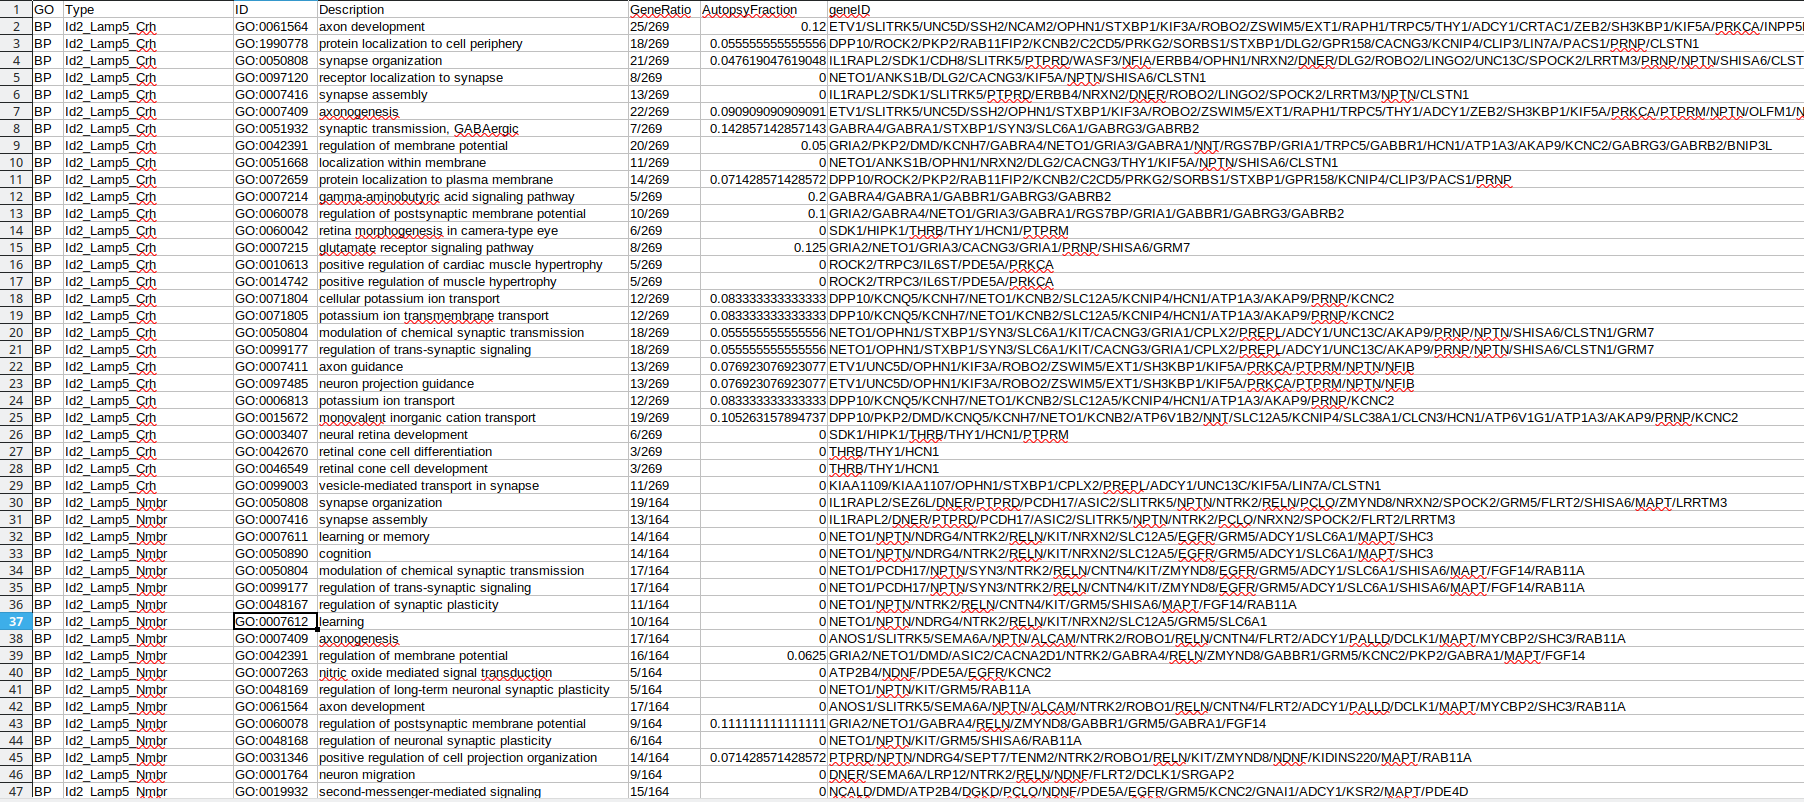
Run Gene Ontology analysis
Align samples
Perform joint annotation
Run differential expression
Run Gene Ontology analysis
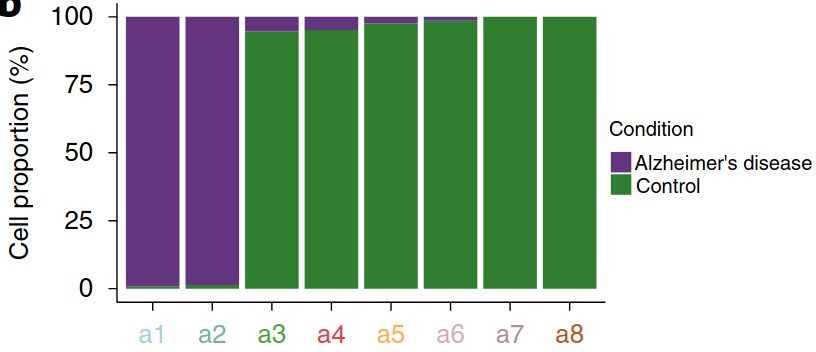
Compare cell type proportions
Align samples
Perform joint annotation
Run differential expression
Run Gene Ontology analysis
Compare cell type proportions
The main questions:
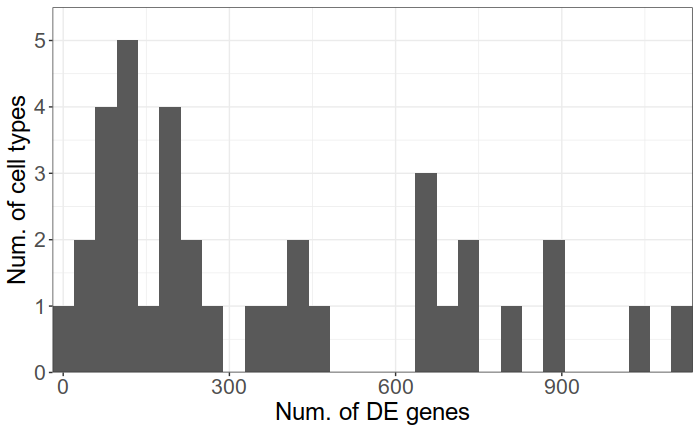
Number of DE genes is not an answer
The main questions:
There are up to 1000 significant DE genes per type and 2795 unique DE genes in total
The main questions:
There are up to 1000 significant DE genes per type and 2795 unique DE genes in total
The main questions:
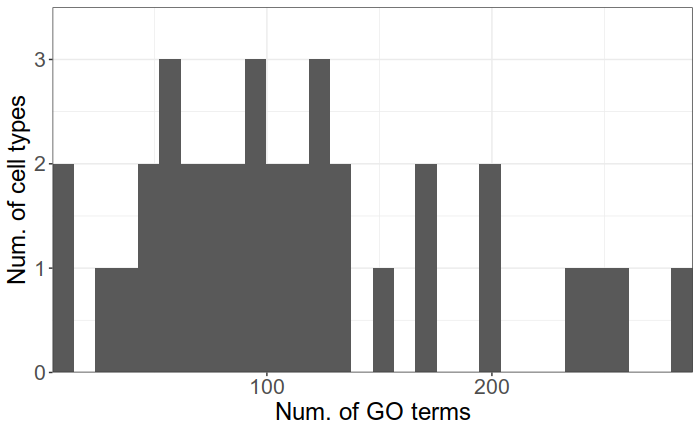
There are up to 300 significant GO terms per type and 796 unique terms in total
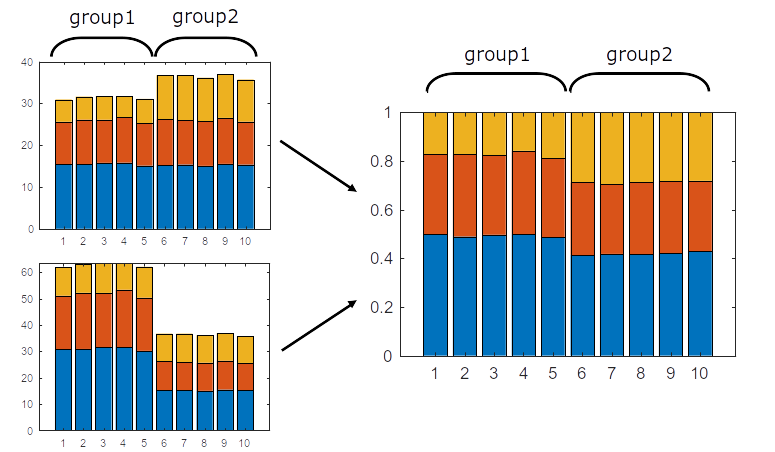
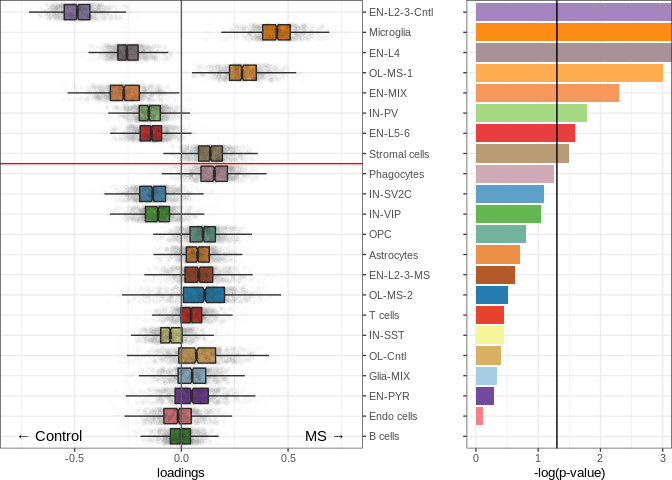
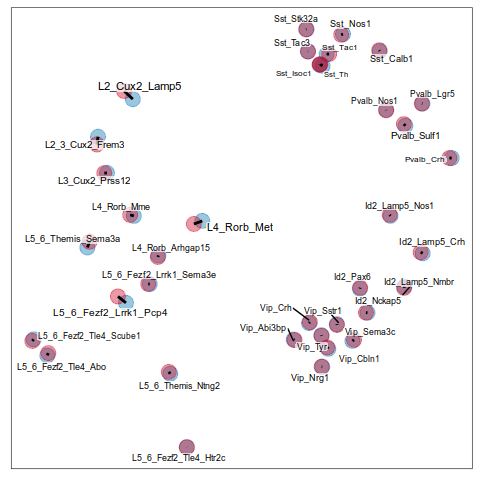
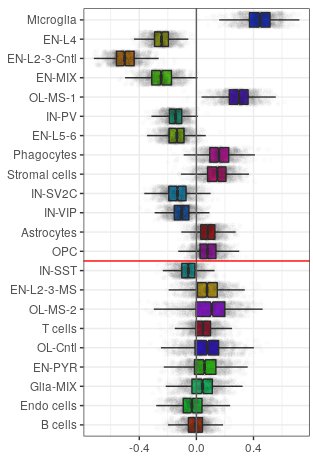
Compositional analysis
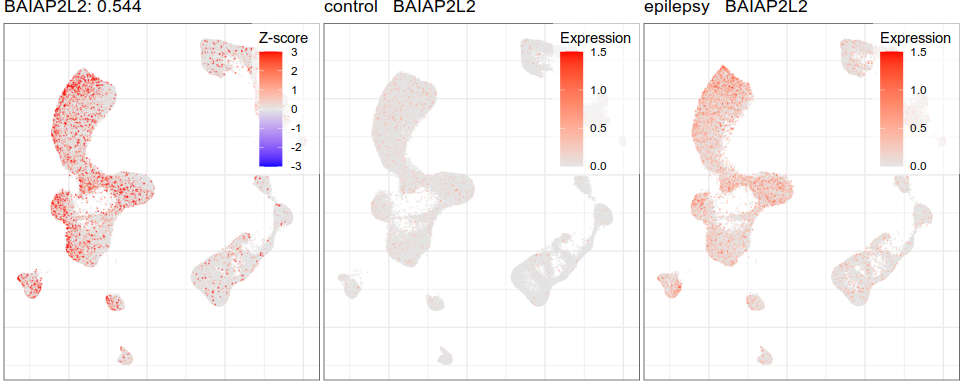
Gene expression analysis
Gene expression analysis
Compositional analysis
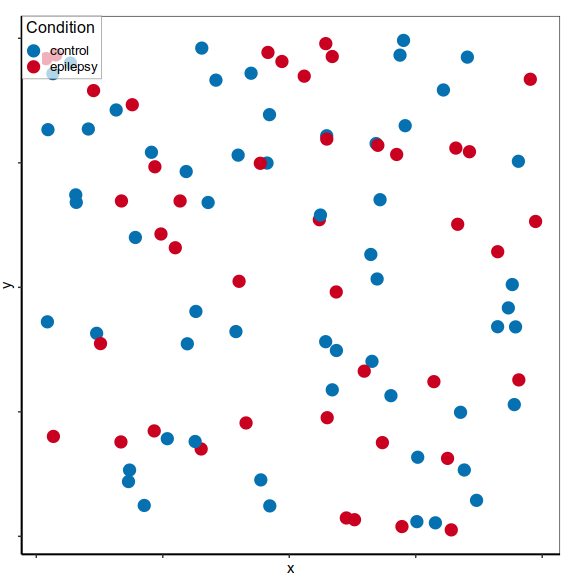
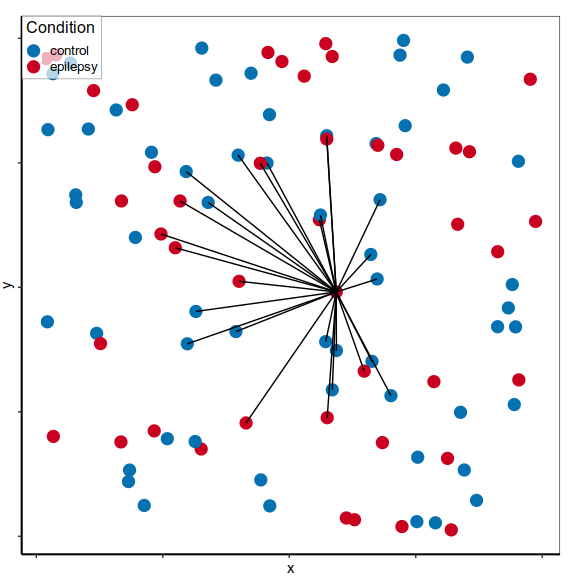
Cluster-based
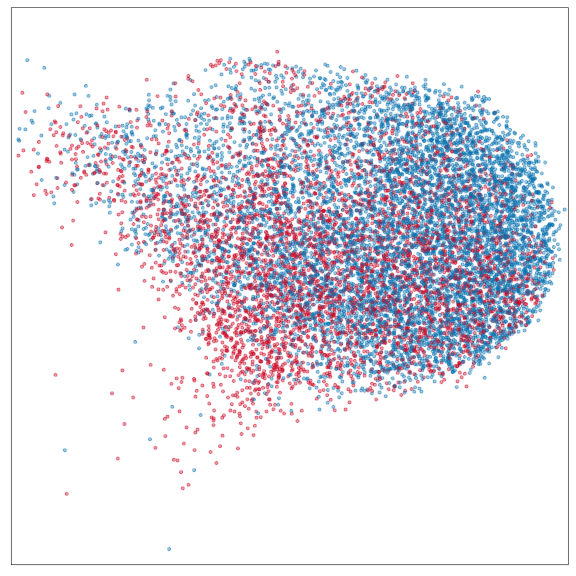
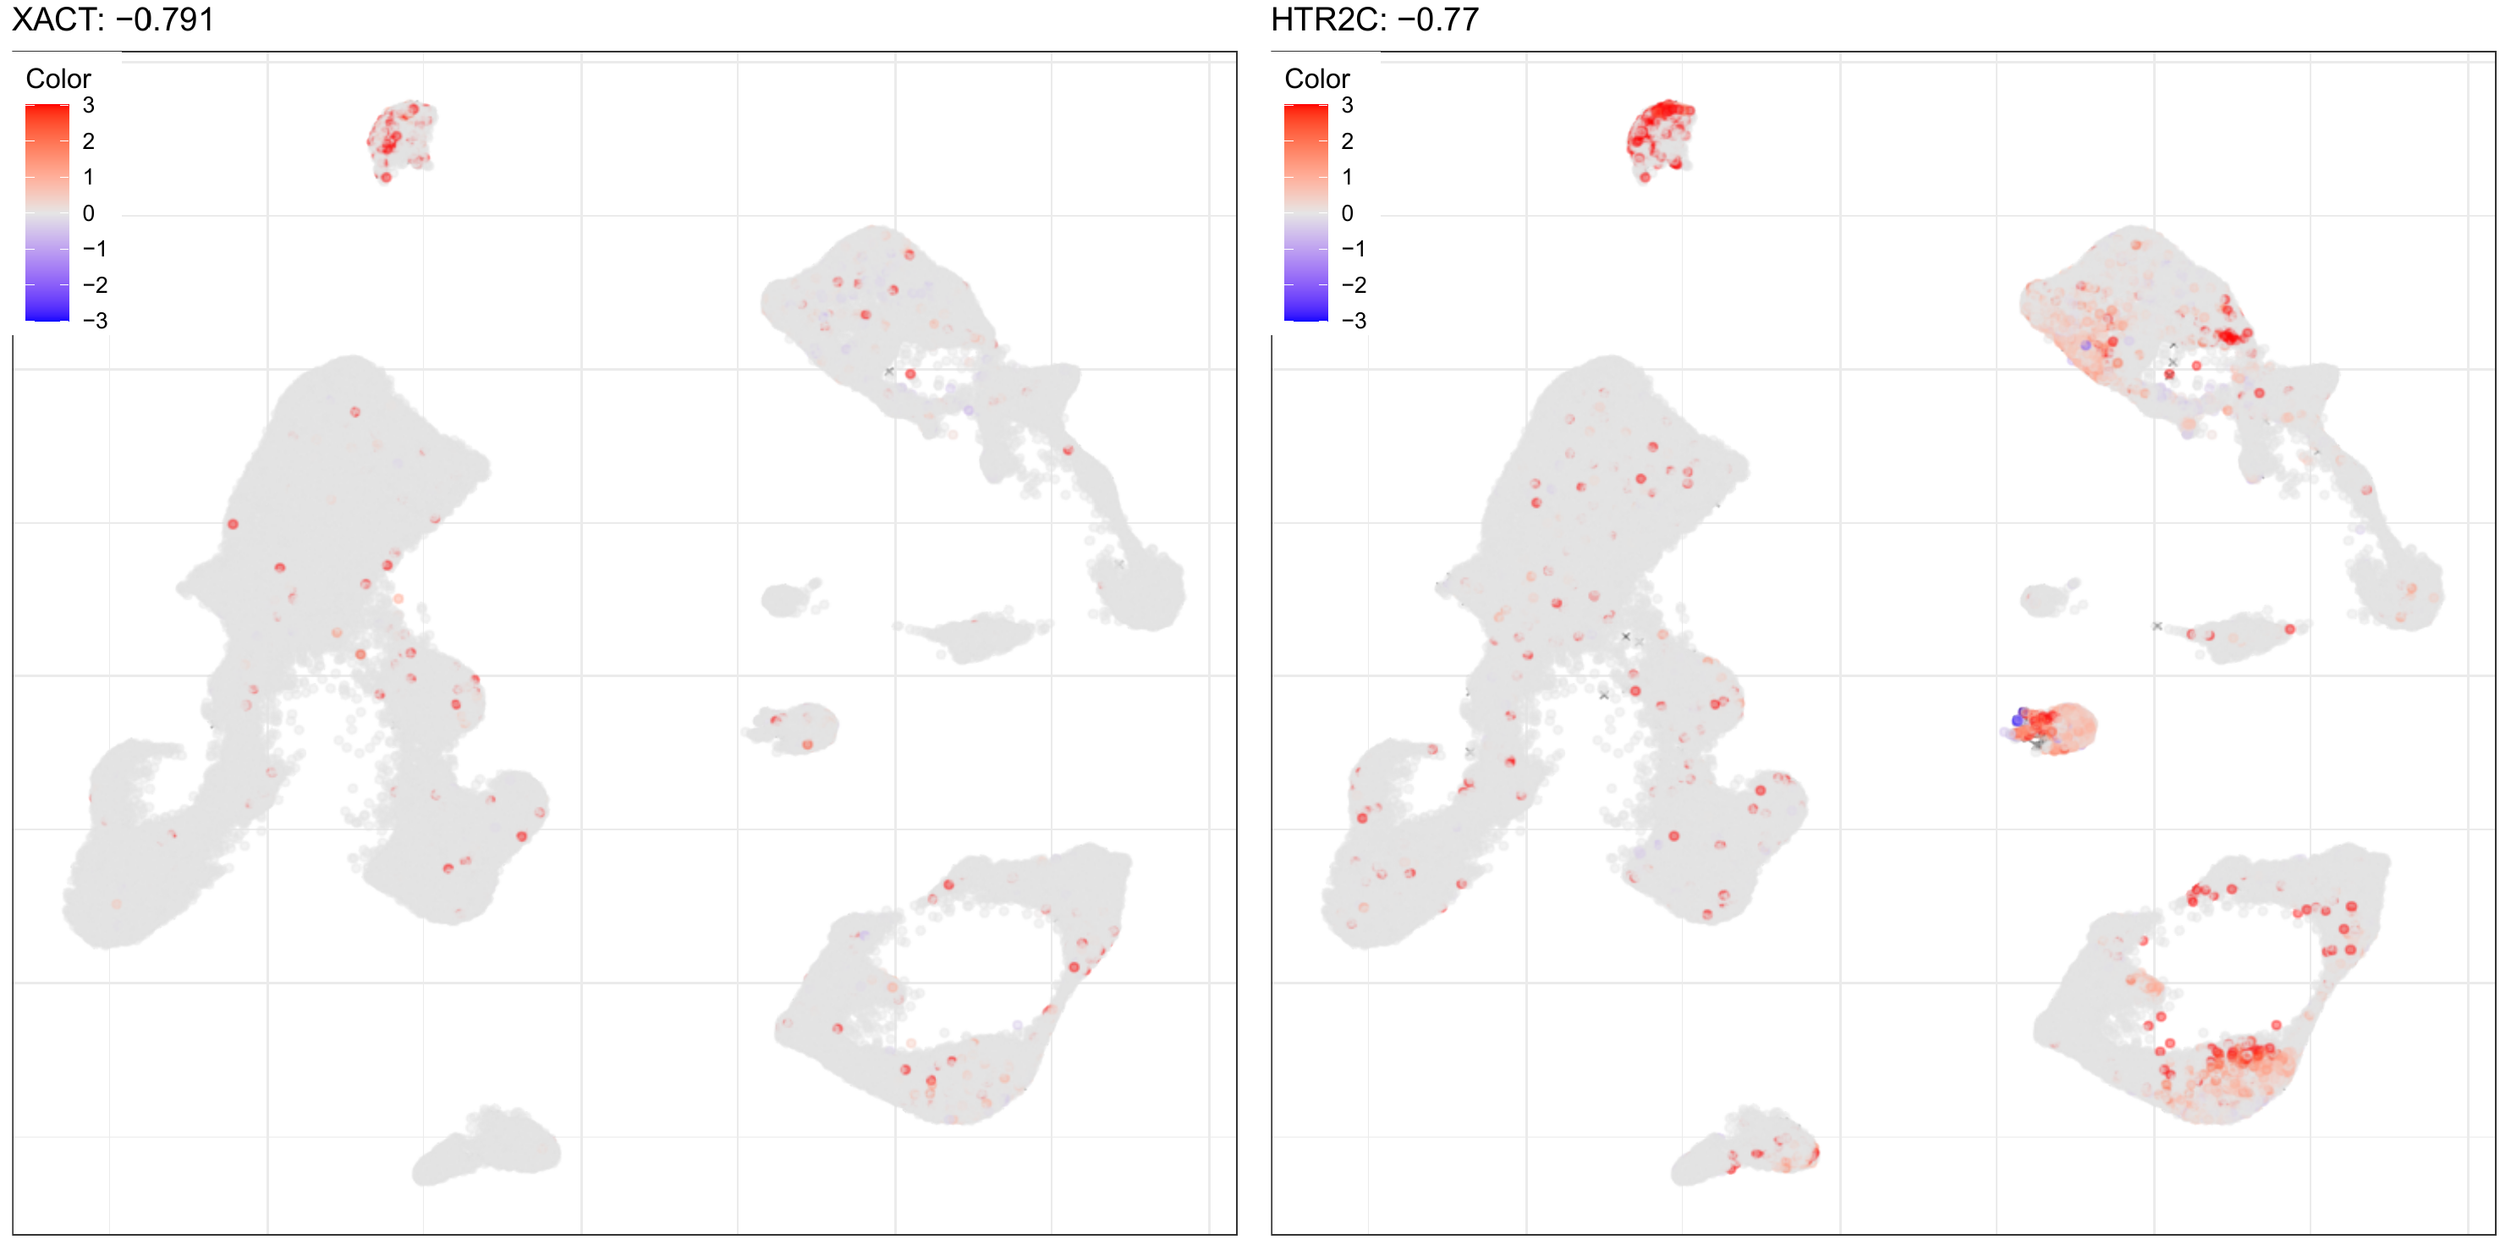
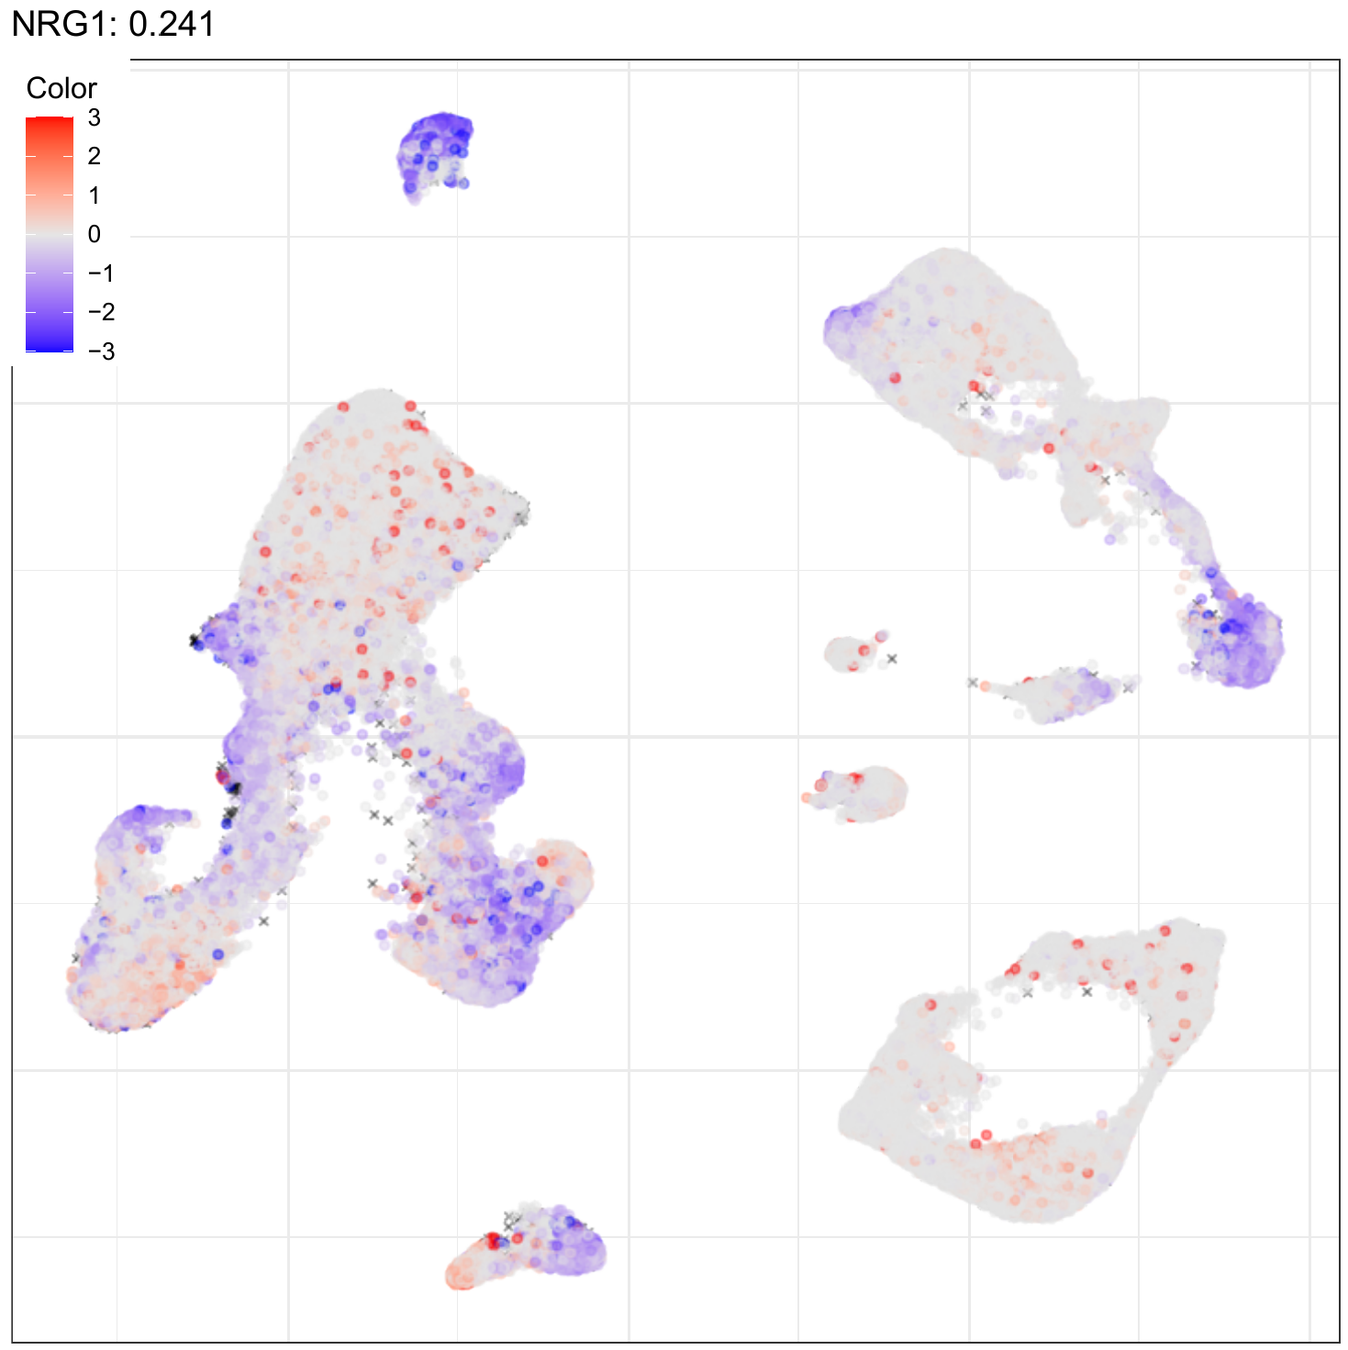
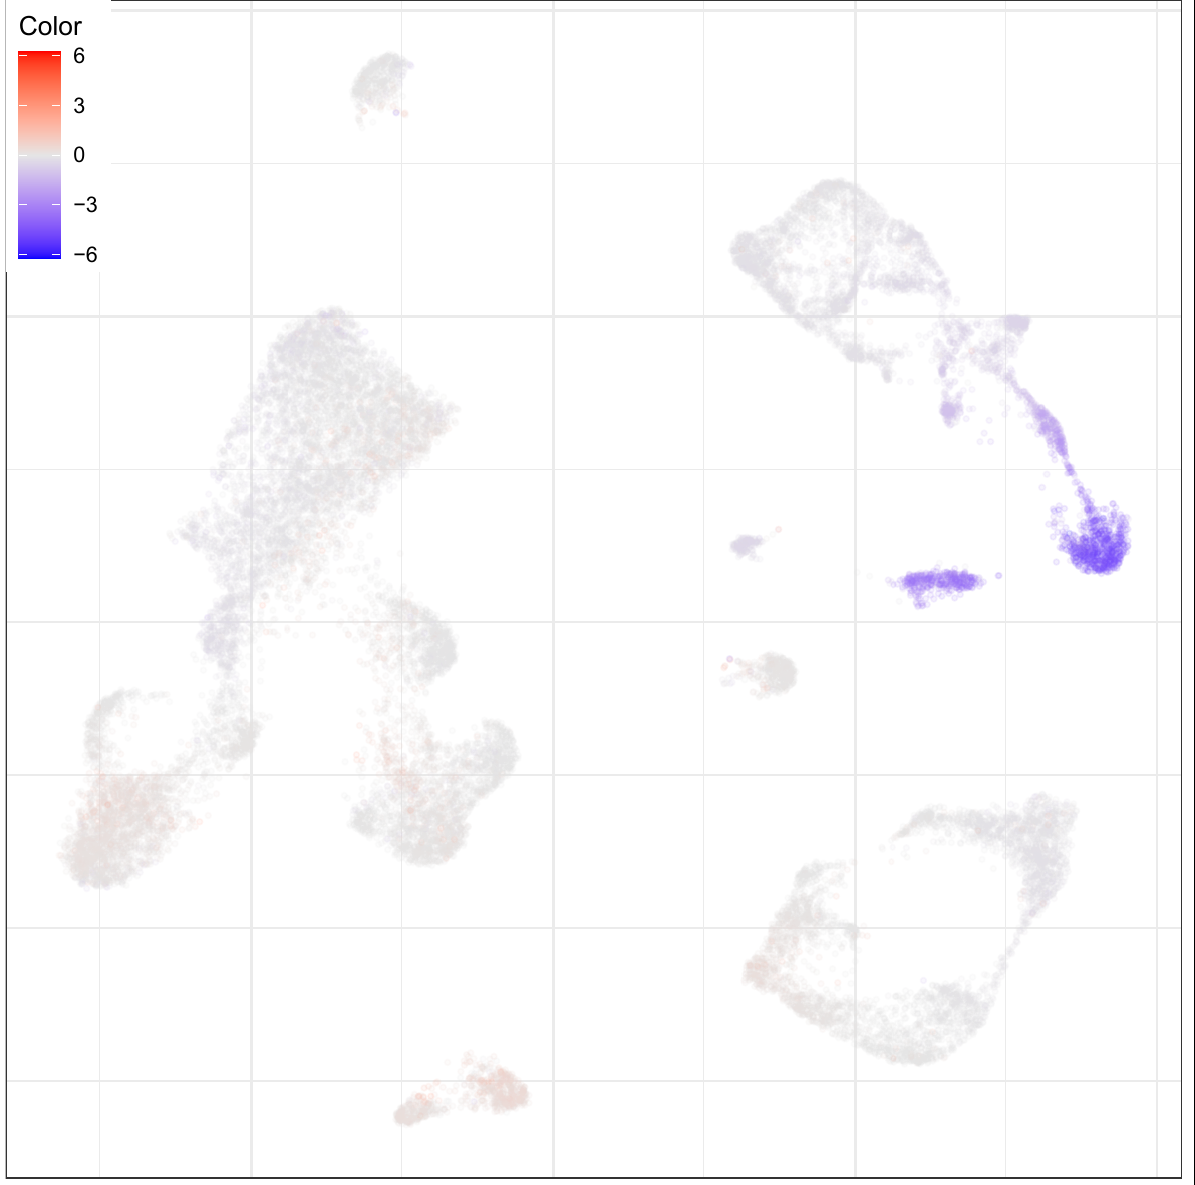
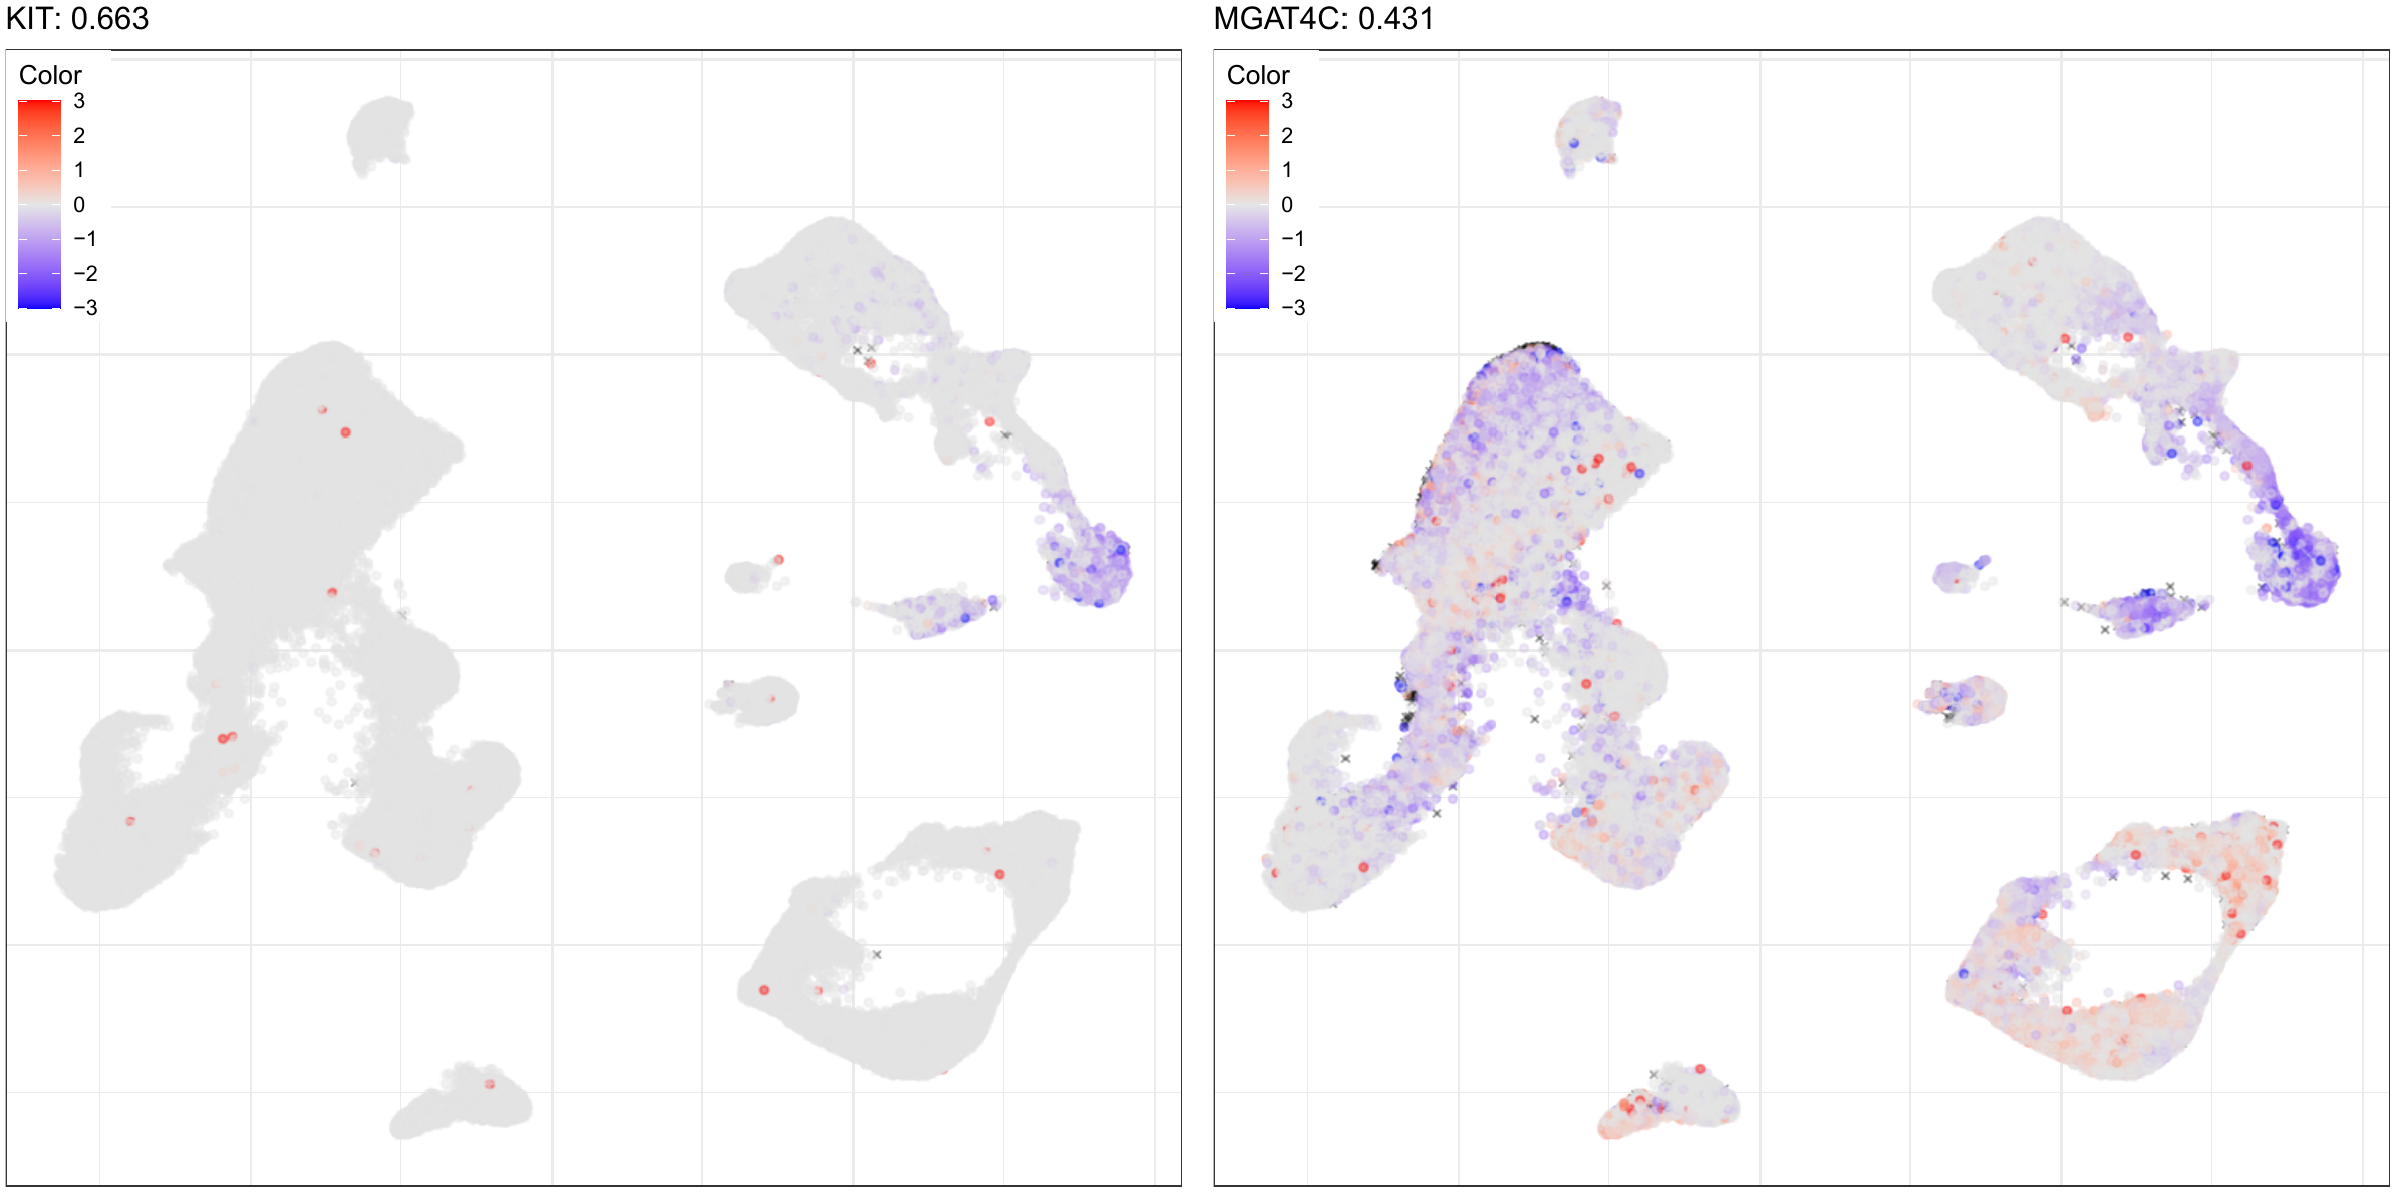
Cluster-free
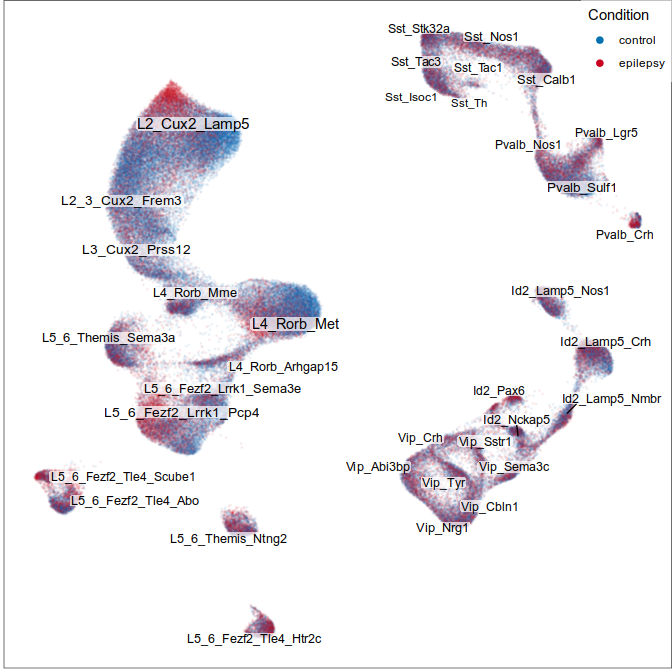
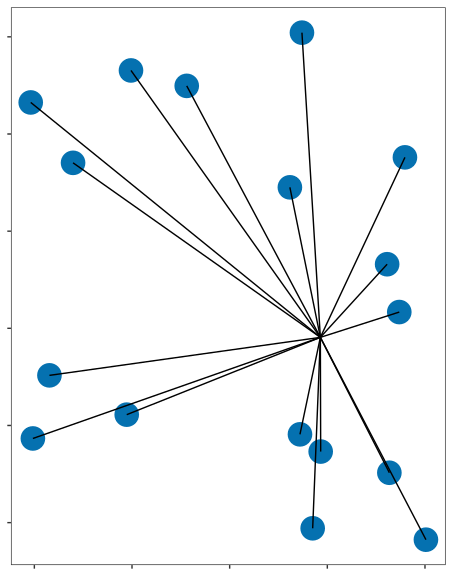
control
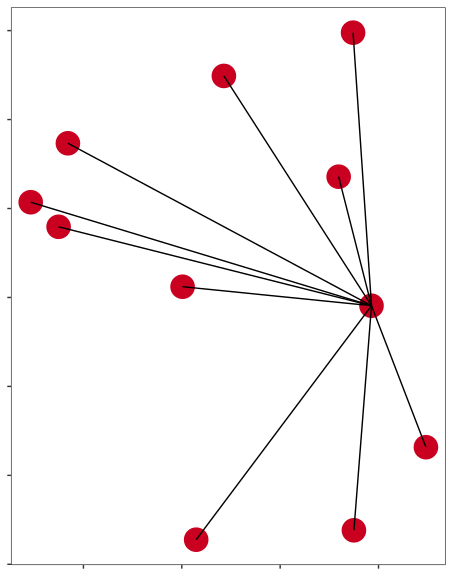
epilepsy
Problem: changes are not independent
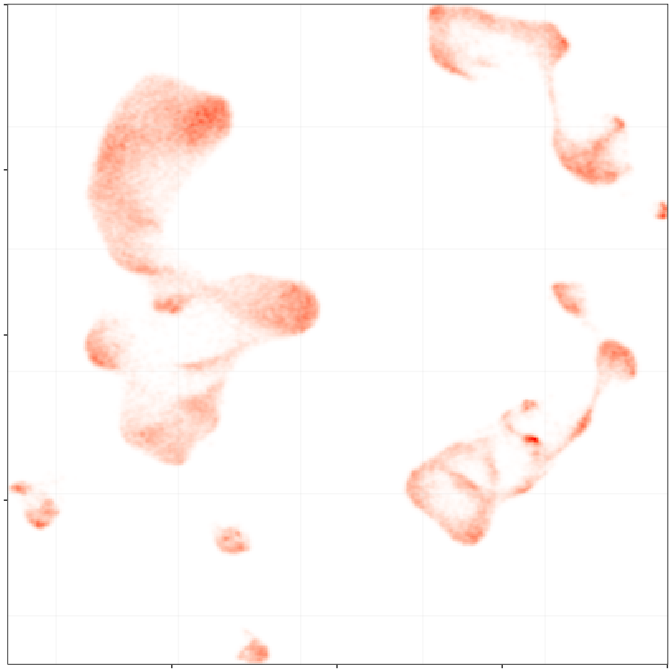
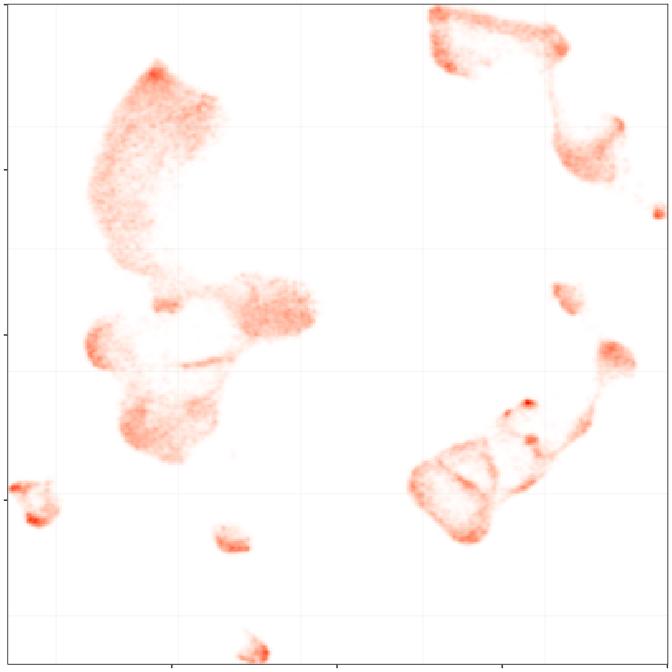
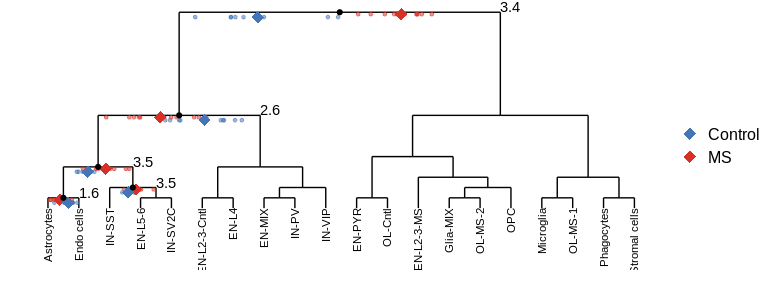
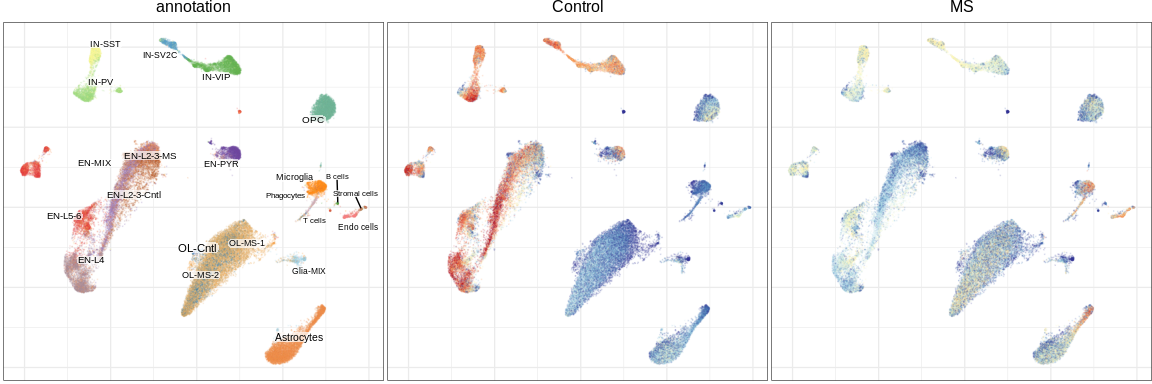
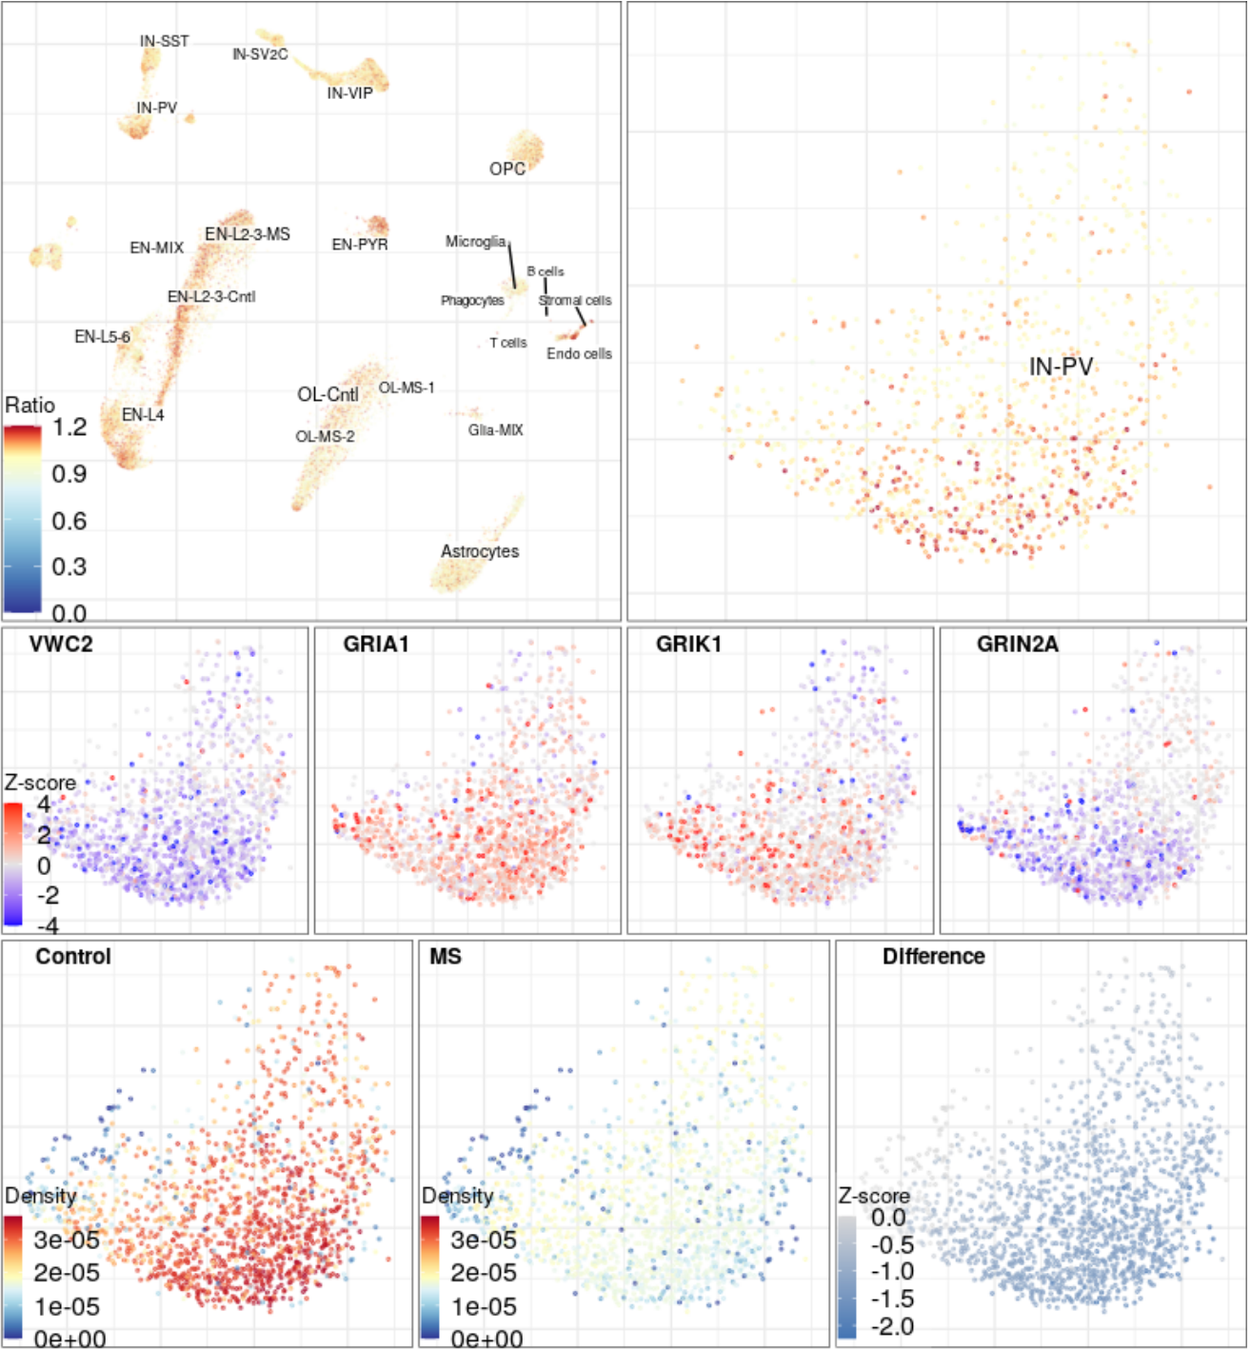
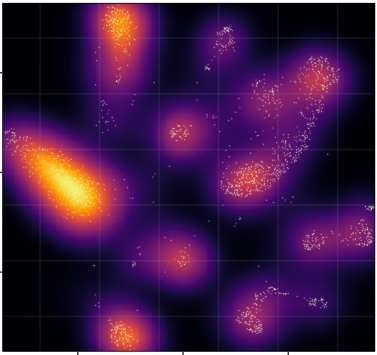
Control
Multiple sclerosis
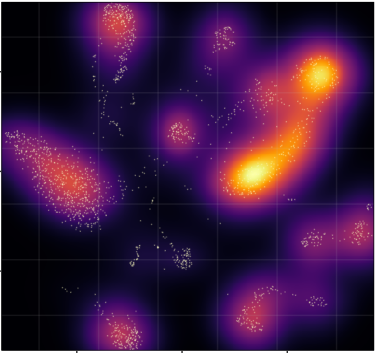
Control
MS
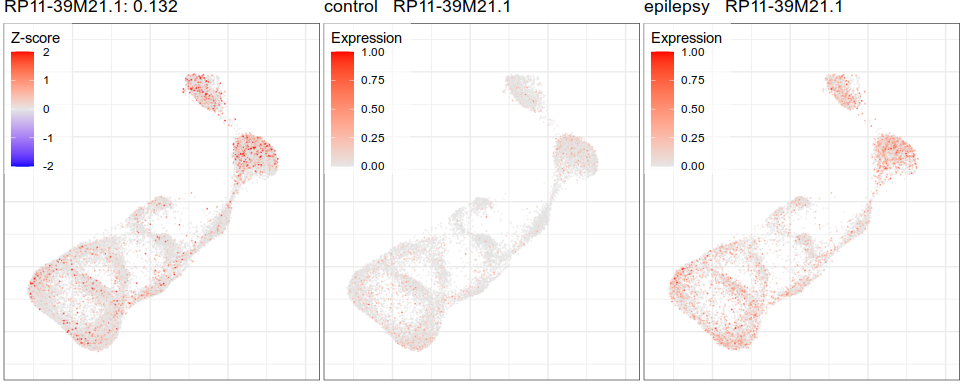
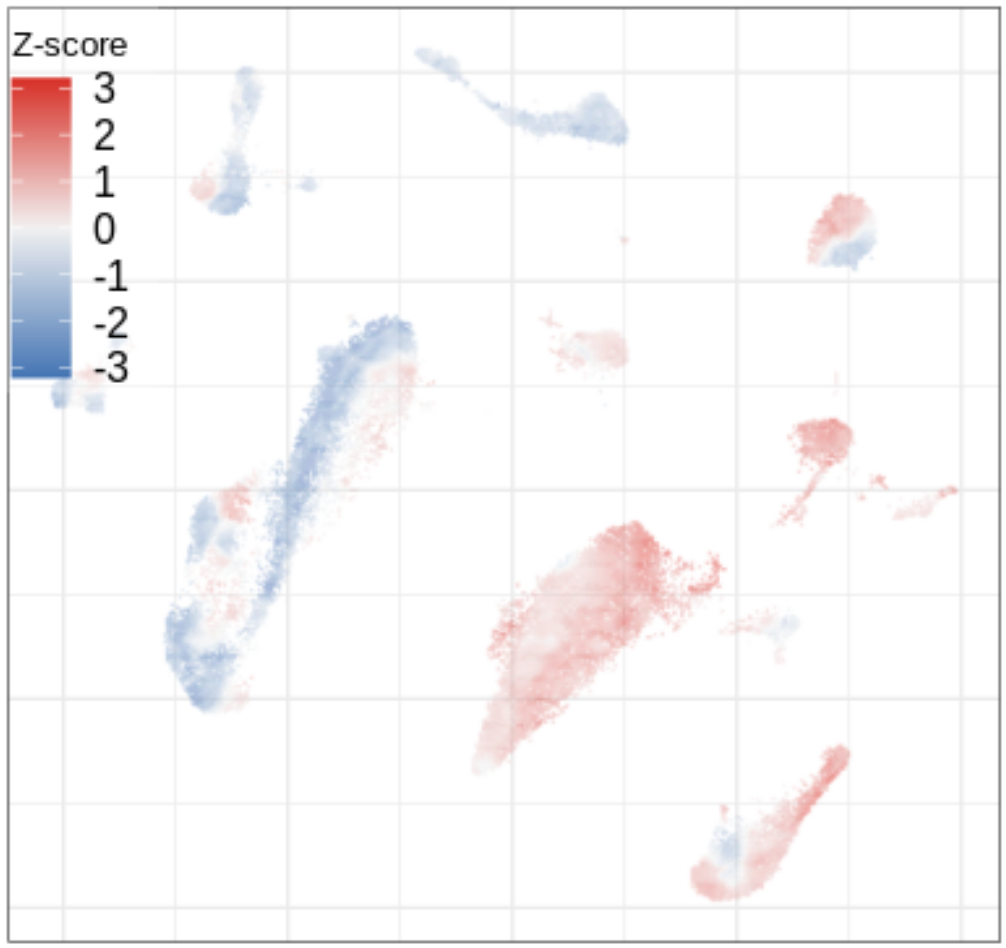
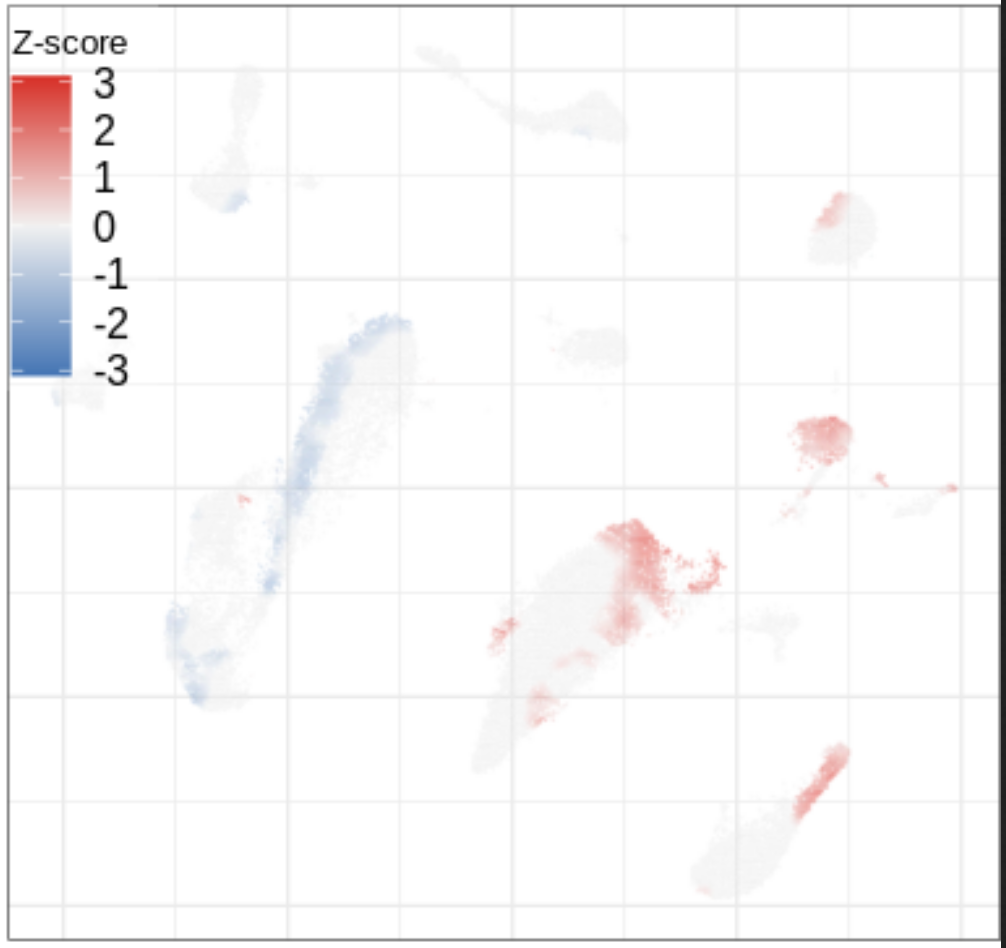
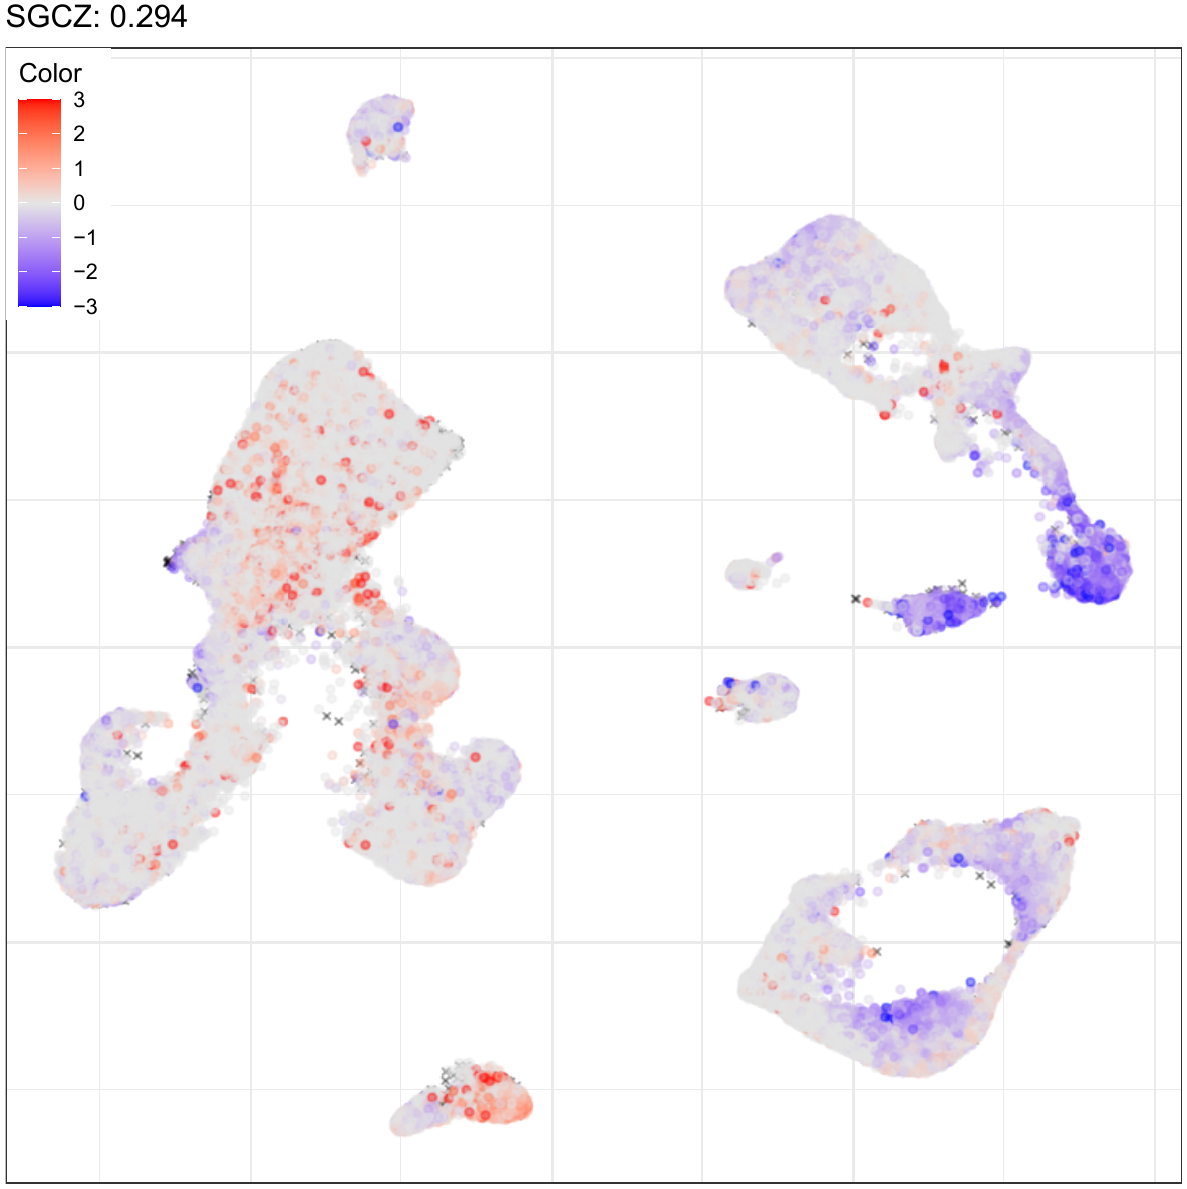
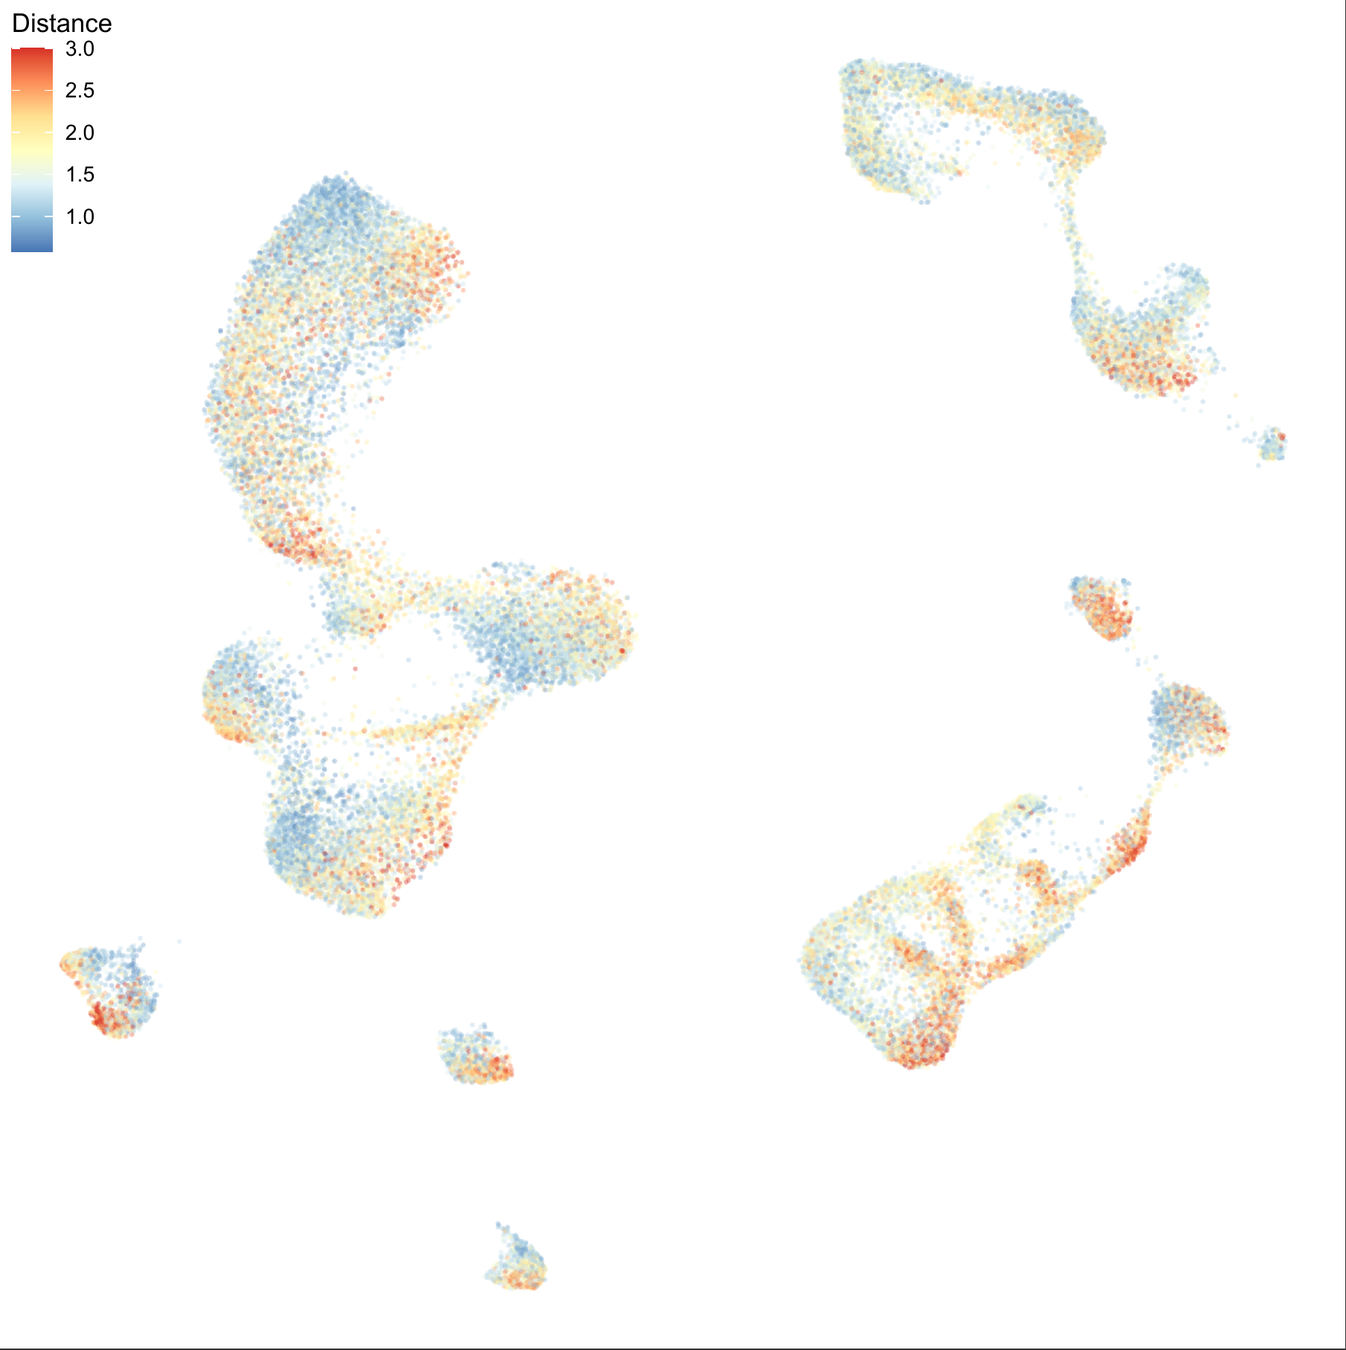
Z-scores
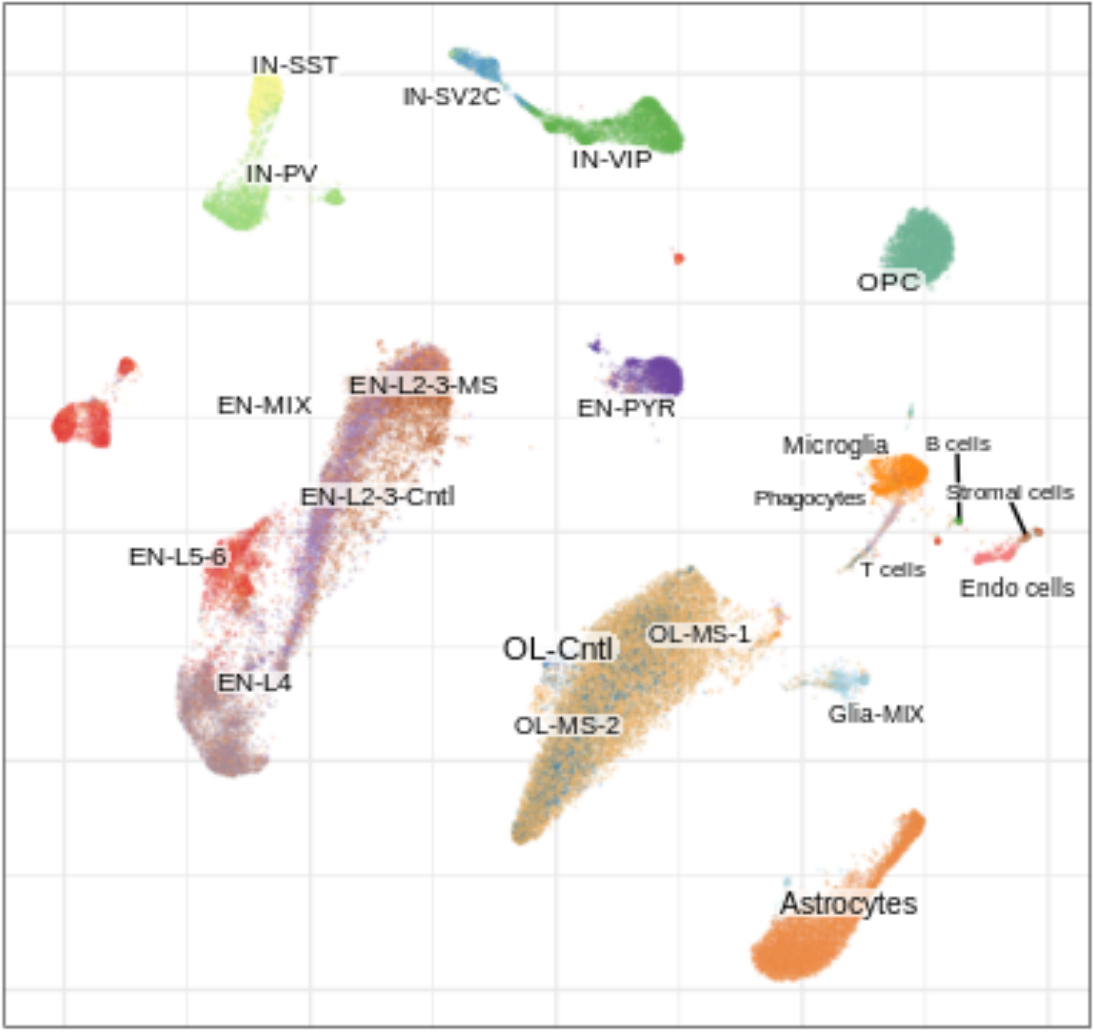
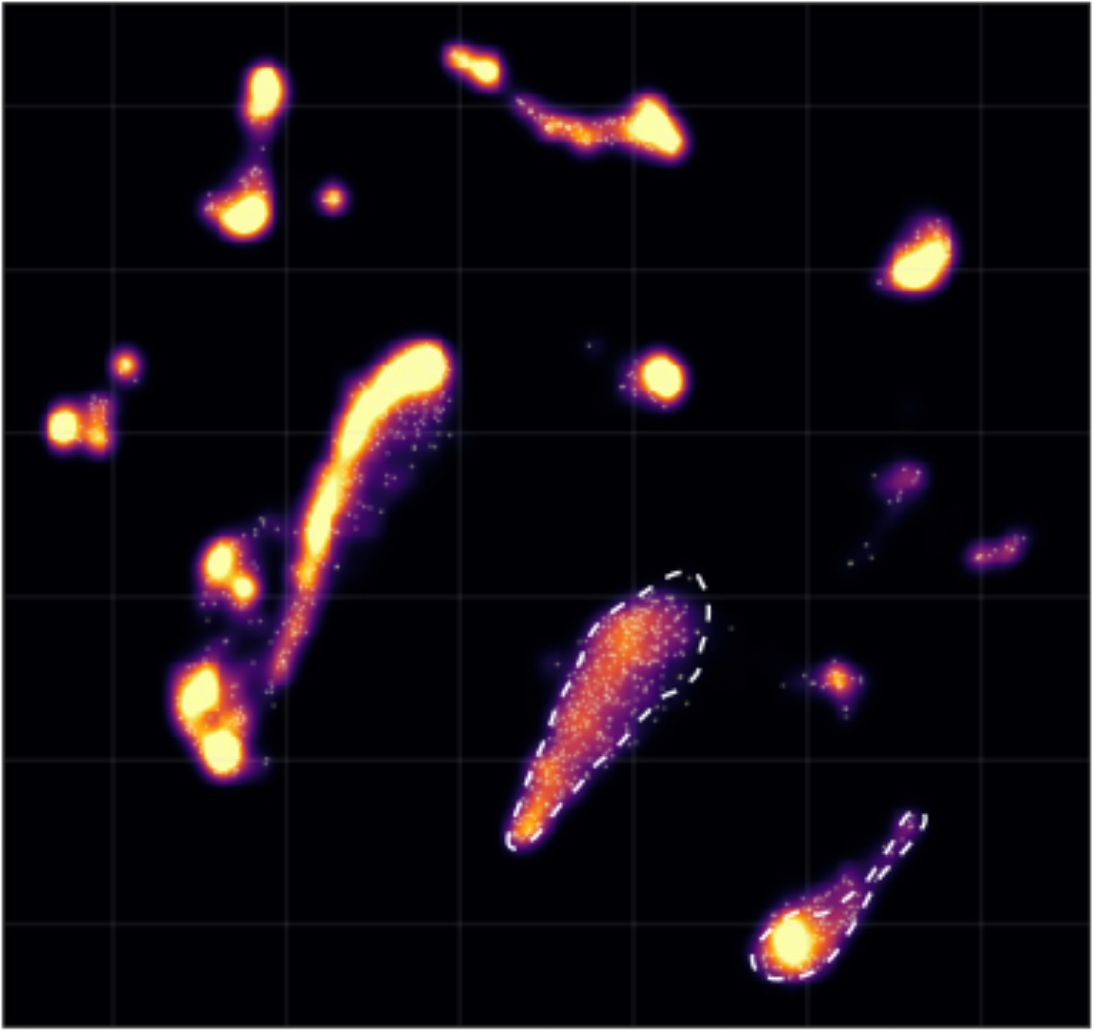
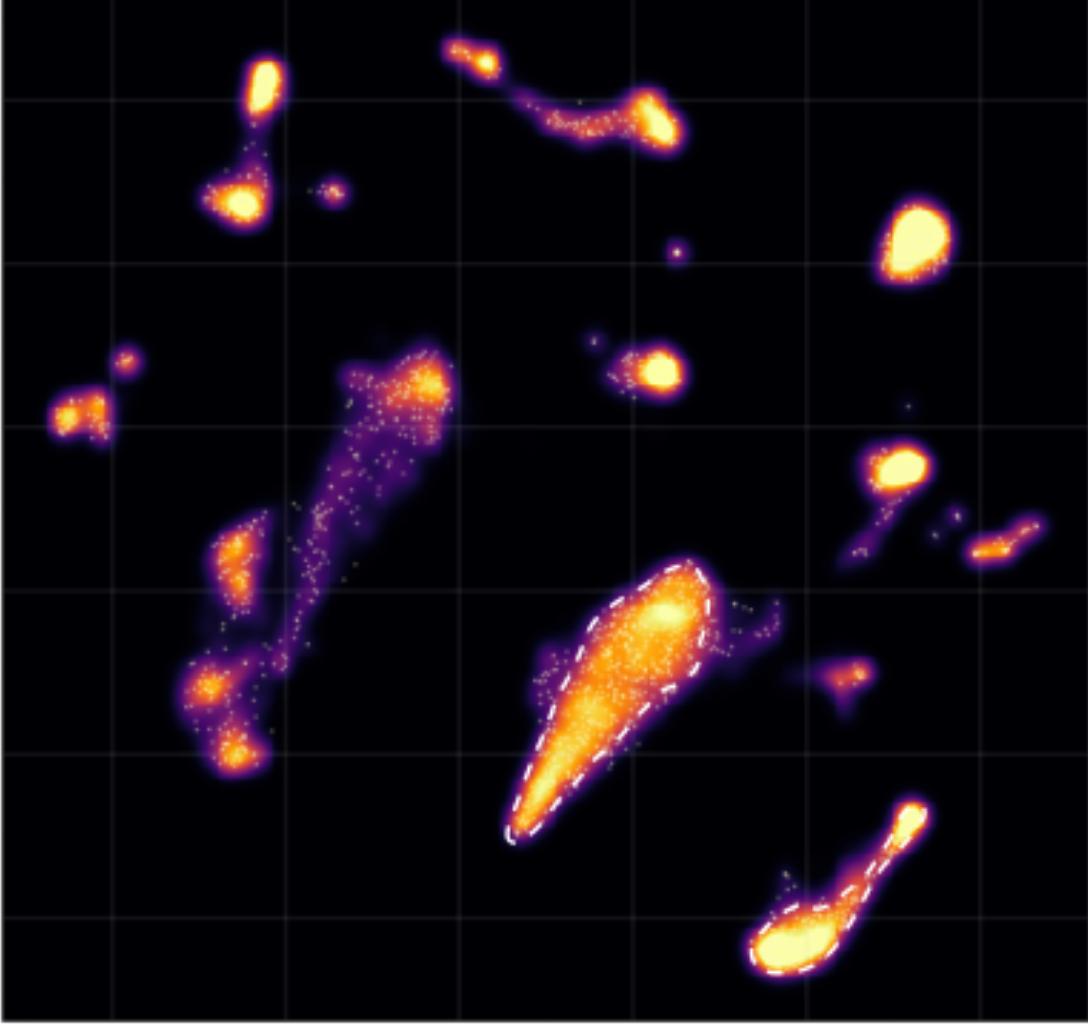
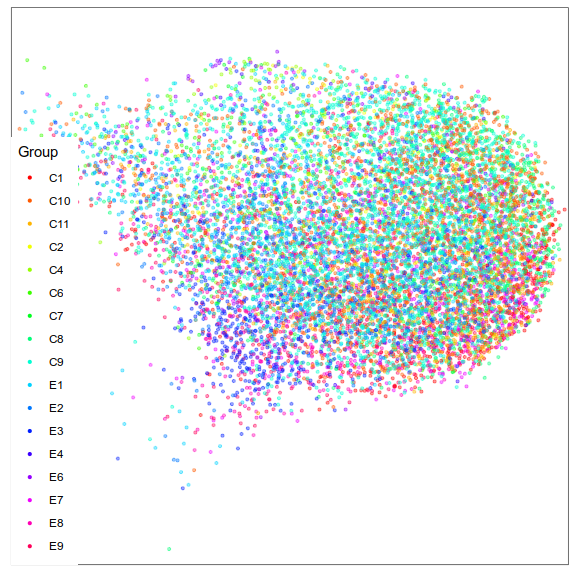
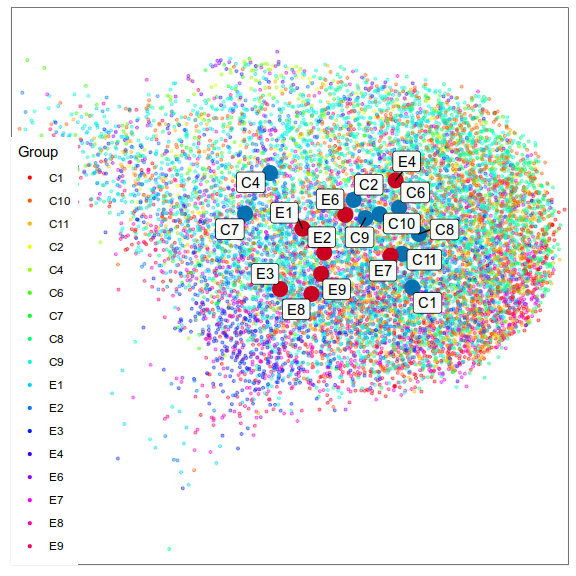
Embedding
Graph
Control
MS
Embedding
Graph
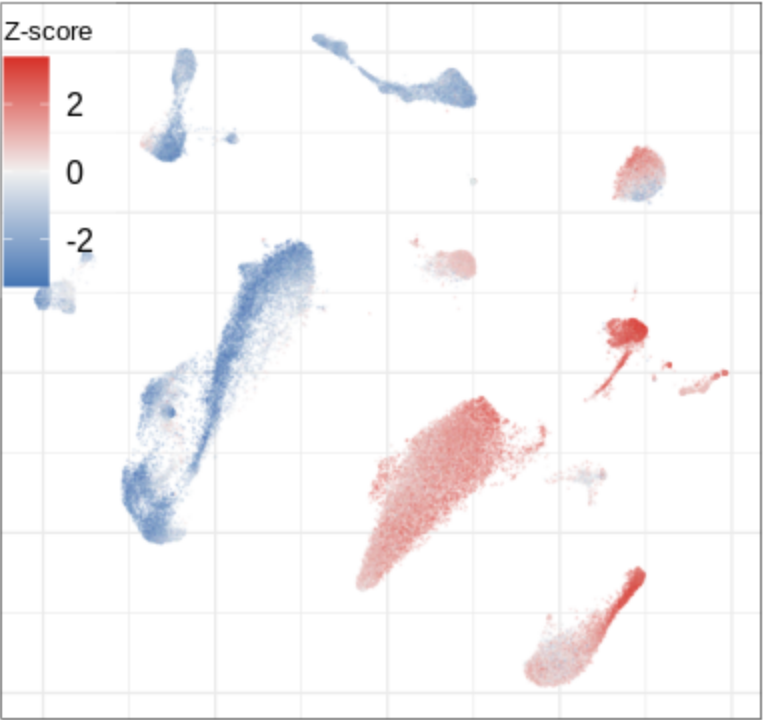
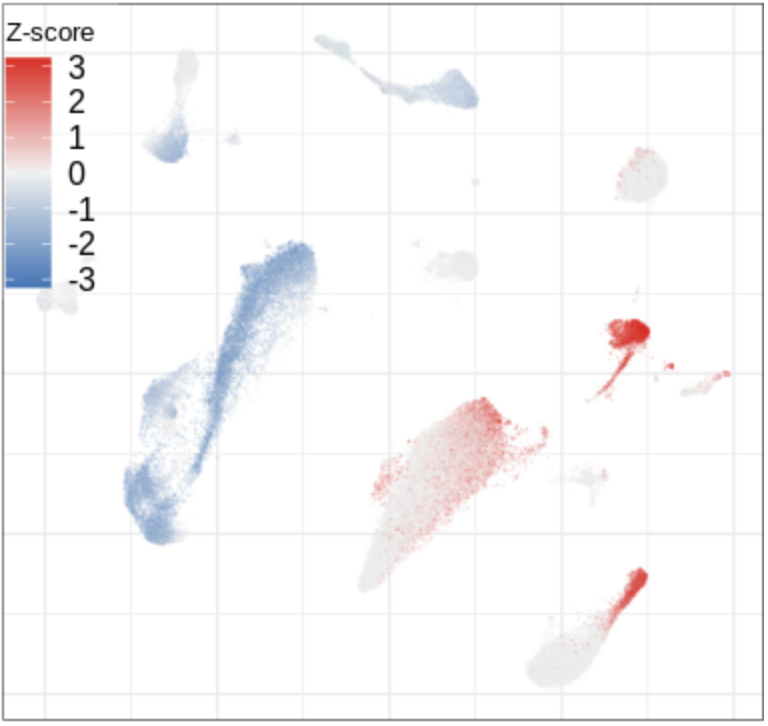
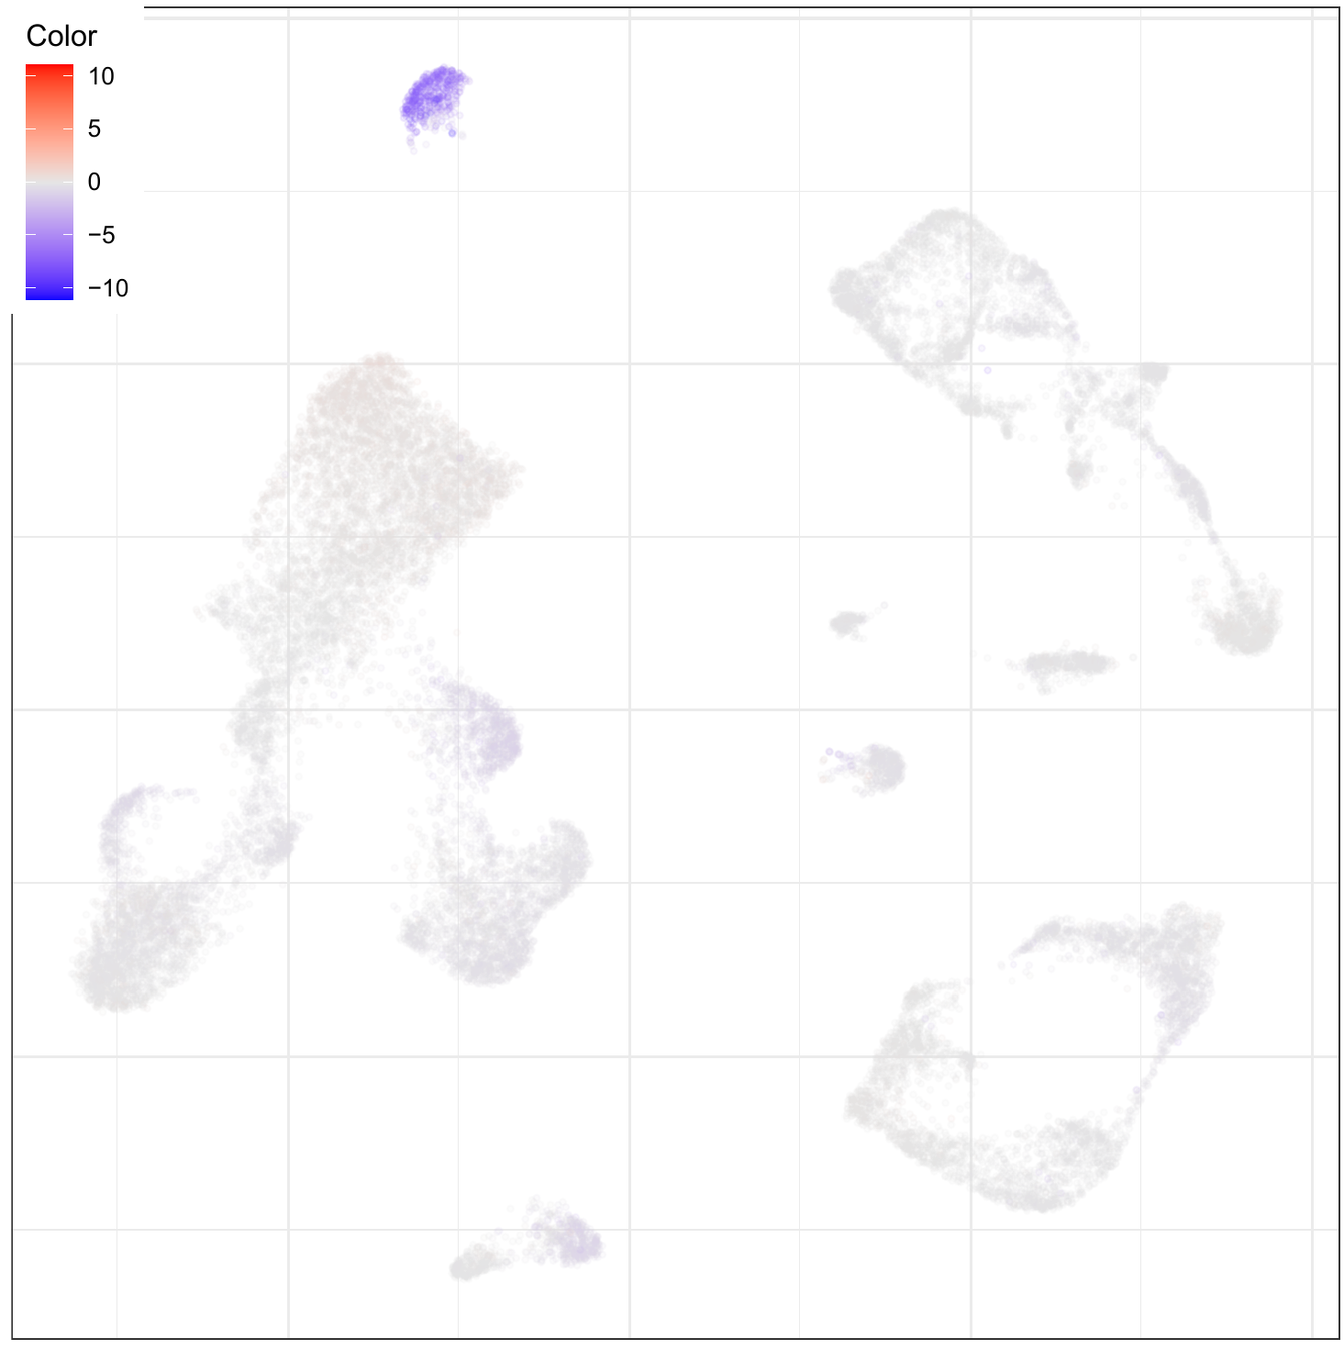
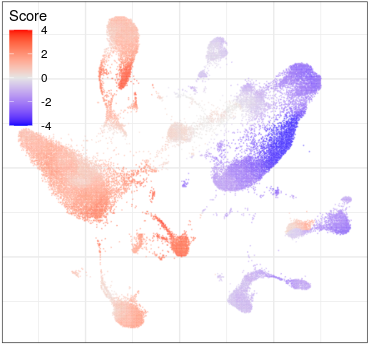
Adjusted z-scores
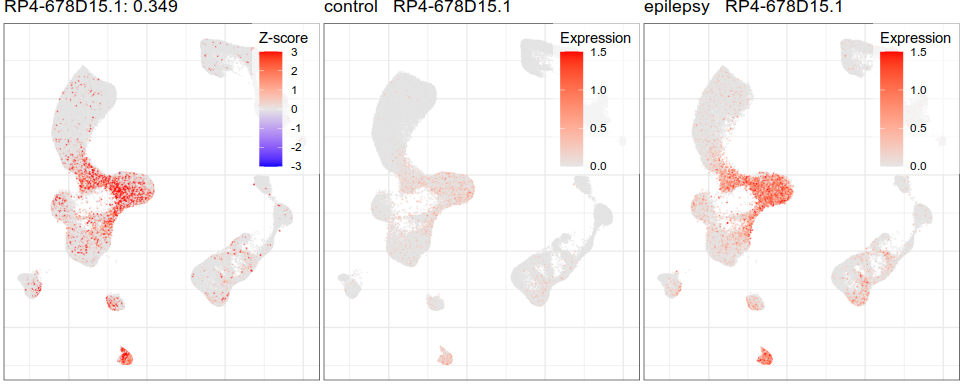
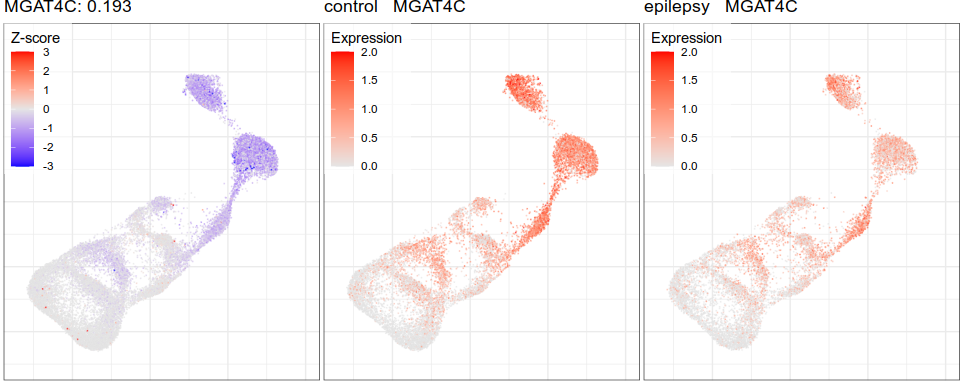
Z-scores
control
epilepsy
control
epilepsy
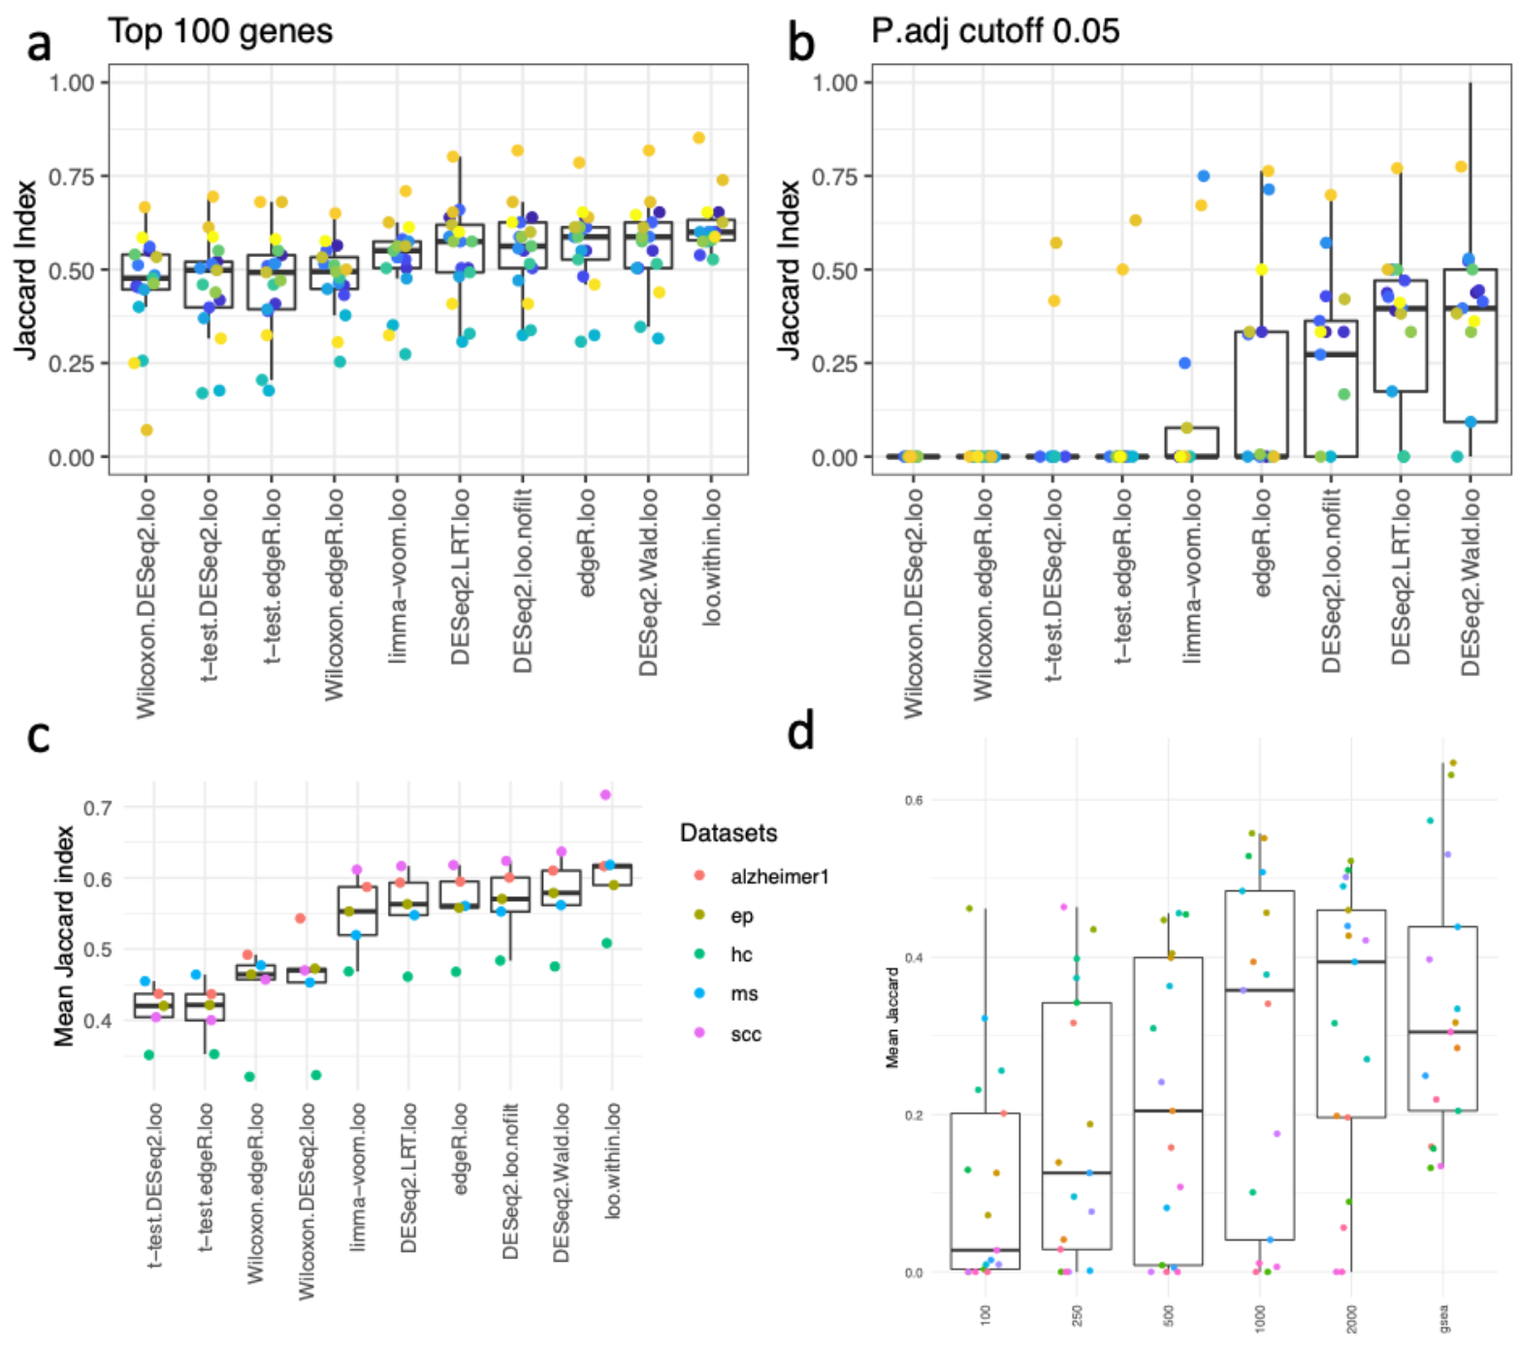
Differential expression
Aggregate by samples
Program 1
Program 2
Probably can be improved by estimating adjusted z-scores
*Done by Anna and Rasmus
Gene expression analysis
Compositional analysis
Cluster-based
Cluster-free
By Viktor Petukhov


