Peaches and Lemons


Predicting whether
a vehicle will be 'kicked back'
to the auction.
Will Morgan
Nov 2, 2018
MOTIVATION & BACKGROUND
The Lemons Problem
In Economics, the Lemons Problem refers to issues that arise regarding the value of a product due to asymmetric information between the buyer and the seller.
(In American slang, a lemon is a car that is found to be defective only after it has been bought.)
This information asymmetry leads a degradation in the quality of products in a given market.

The subject even has laws named after it.

Proposed Flow
- Overview of the Problem
- Objective
- The Data
- Feature Engineering
- Modeling & Feature Selection
- Tuning and Evaluating the Model
- Conclusion
"One of the biggest challenges of an auto dealership purchasing a used car at an auto auction is the risk of that the vehicle might have serious issues that prevent it from being sold to customers. The auto community calls these unfortunate purchases "kicks".
Kicked cars often result when there are tampered odometers, mechanical issues the dealer is not able to address, issues with getting the vehicle title from the seller, or some other unforeseen problem. Kick cars can be very costly to dealers after transportation cost, throw-away repair work, and market losses in reselling the vehicle.
Modelers who can figure out which cars have a higher risk of being kick can provide real value to dealerships trying to provide the best inventory selection possible to their customers.
The challenge of this competition is to predict if the car purchased at the Auction is a Kick (bad buy)."
Overview of the Problem
From kaggle:


TL;DR:
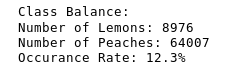
Vehicles that are returned to an auction are called kicks (lemons), and they can become a huge cost for dealers.
Asymmetric Information
Preventing quality degredation
OBJECTIVE
The objective of the Kaggle competition is to predict which cars will be lemons.
In addition to predicting lemons, the data can also be used in an attempt to maximize the expected profit margins of the inventory.

The Data:

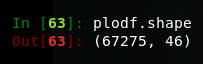
The data comes from Carvana, contains a list of vehicles purchased across two auctions (and other sources)
I used the training data and split it to train my model.
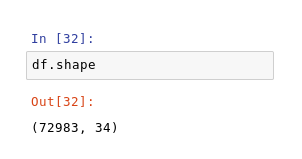
The test data does not contain the outcome attribute.
Click Me!
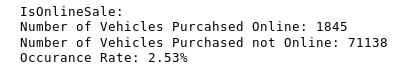
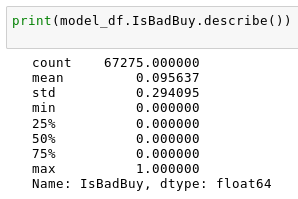
The data is imbalanced.
The Data
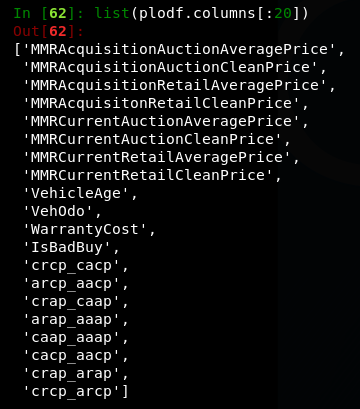
Continuous Attributes
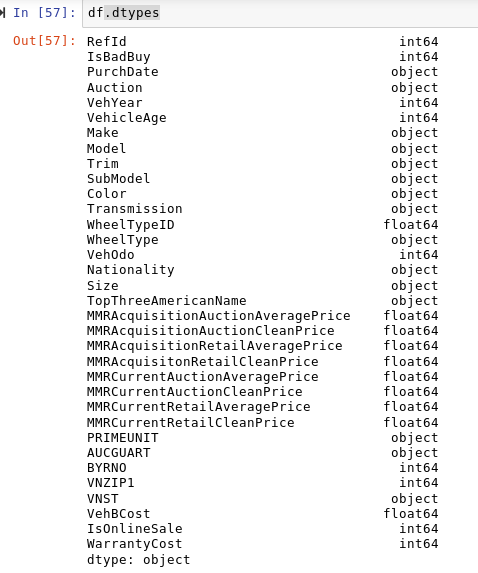
Original Attributes
Attributes Dropped (a prior i)
['RefId', 'BYRNO', 'AUCGUART', 'PRIMEUNIT','VNZIP','WheelType', 'VehYear']
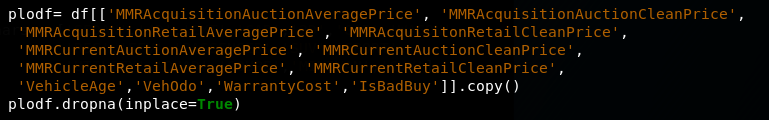
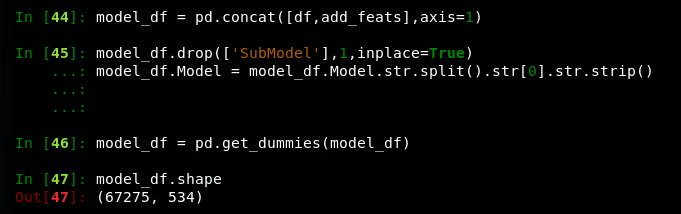
Index(['VehYear', 'VehicleAge',  'VehOdo', 'VehBCost',
       'MMRAcquisitionAuctionAveragePrice', 'MMRAcquisitionAuctionCleanPrice',
       'MMRAcquisitionRetailAveragePrice', 'MMRAcquisitonRetailCleanPrice',
       'MMRCurrentAuctionAveragePrice', 'MMRCurrentAuctionCleanPrice',
       'MMRCurrentRetailAveragePrice', 'MMRCurrentRetailCleanPrice',
        'WarrantyCost']
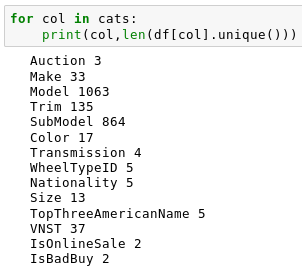
Categorical/Binary Attributes
Index(['Auction','PurchDate 'Make', 'Model', 'Trim', 'SubModel', 'Color',
       'Transmission','VNST', 'WheelTypeID', 'Nationality','Size',
       'TopThreeAmericanName', 'IsOnlineSale']
The Data:
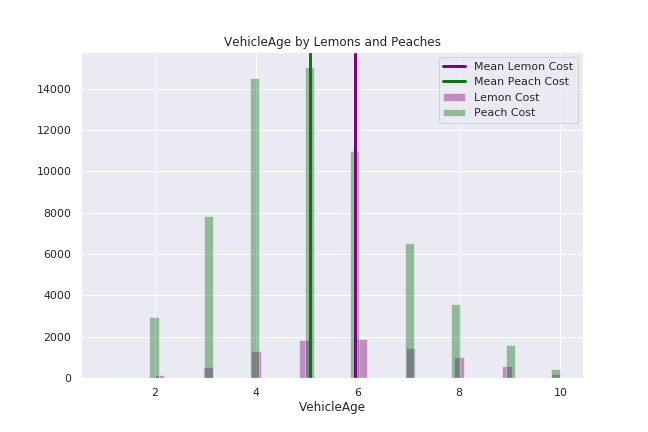
Continuous Attributes
'VehicleAge' - Age of Vehicle in Years
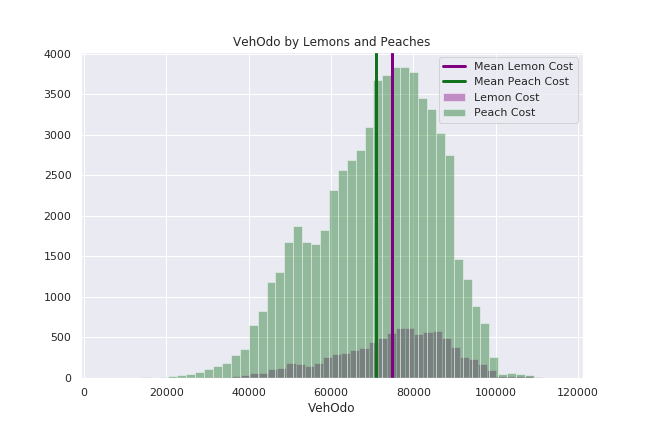
'VehOdo' - Vehicle Odometer Reading
'VehBCost - Price paid at the time of acquisition
'MMRAcquisitionAuctionAveragePrice' - Acquisition Average Auction Price
'MMRAcquisitionAuctionCleanPrice' - Acquisition Good Condition Auction Price
'MMRAcquisitionRetailAveragePrice' - Acquisition Average Retail Price
'MMRAcquisitonRetailCleanPrice' - Acquisition Good Condition Auction Price
'MMRCurrentAuctionAveragePrice' - Current Average Auction Price
'MMRCurrentAuctionCleanPrice' - Current Good Condition Auction Price
'MMRCurrentRetailAveragePrice' - Current Average Retail Price
'MMRCurrentRetailCleanPrice' - Current Retail Good Condition Price
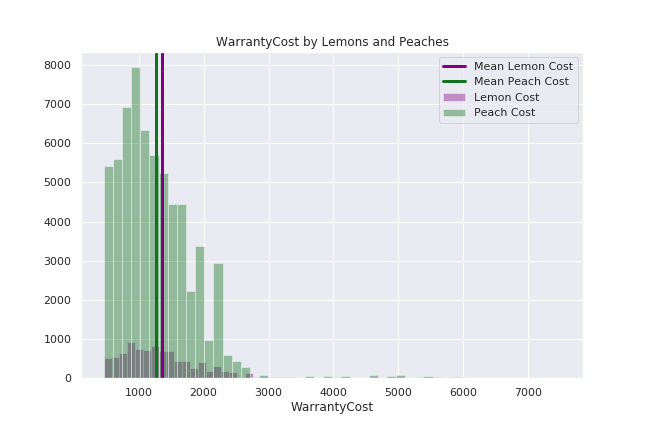
'WarrantyCost' - Cost of the warranty (36k mi, 36 mo)
The Data:
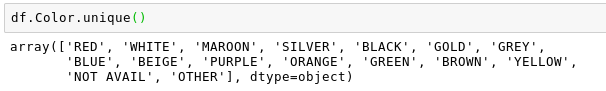
Categorical Attributes
'Auction' - Vehicle Source
'PurchDate' - Purchase Date
'Make' - Make
'Model'* - Model Type
'Trim'* - Style of the Vehicle
'SubModel'* - Additional specifications
'Color' - Color
'Transmission' - Transmission Type
'WheelTypeID' - Wheel Type
'Nationality' - Manufacturing Nation
'Size' - Size
'TopThreeAmericanName' - GM, Ford, Chrysler, other
'VNST'  - State where Vehivle was Purchased
'IsOnlineSale' - The vehicle was purchased online (binary)
'IsBadBuy' (outcome) - The vehicle is a lemon (binary)
*Category is Problematic

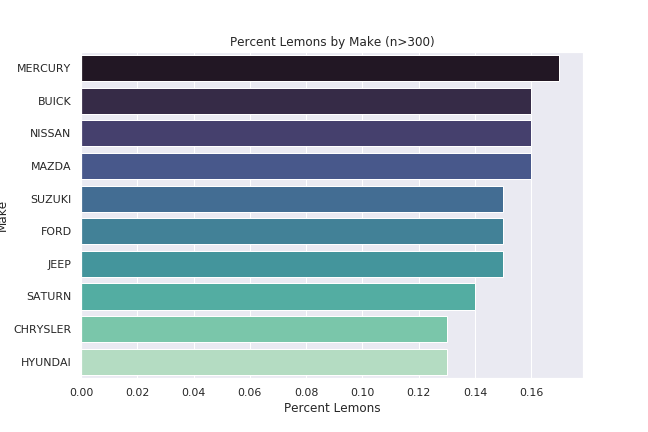
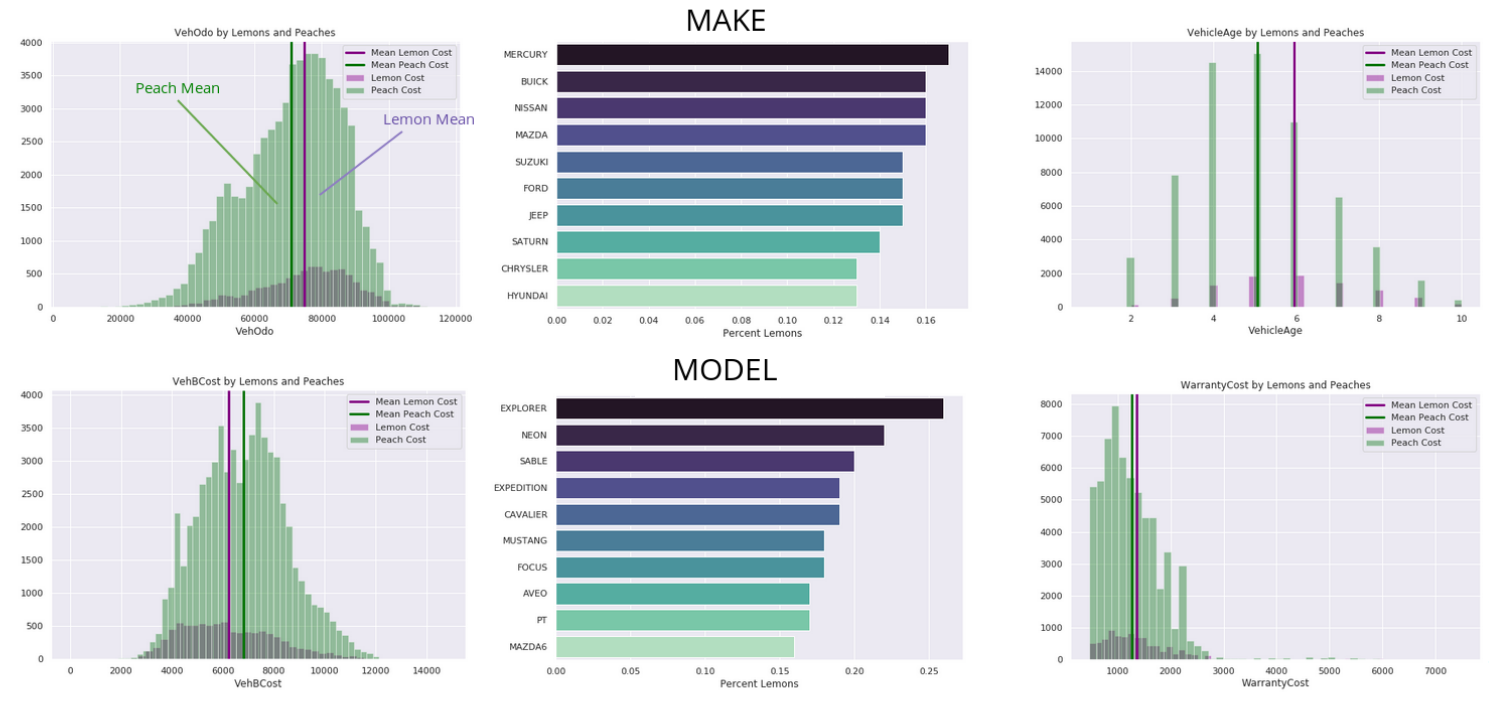
MAKE
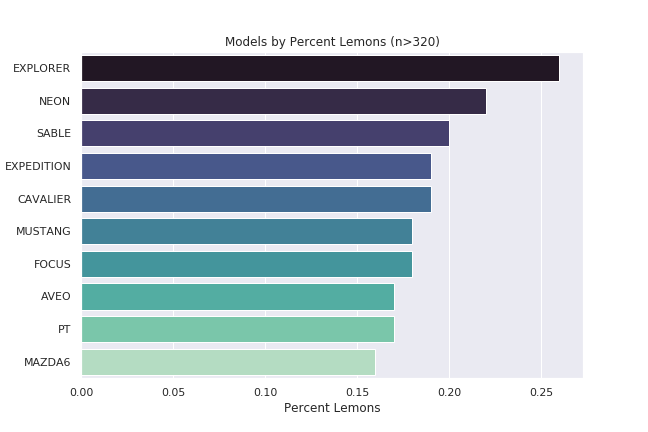
MODEL
Lemon Mean
Peach Mean
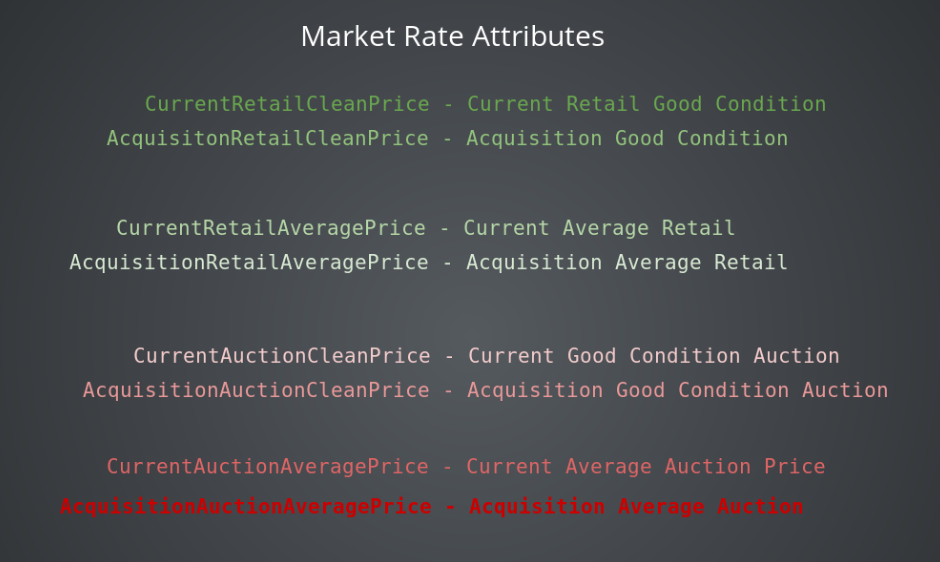
Market Rate Attributes
'AcquisitonRetailCleanPrice' - Acquisition Retail Good Condition
'AcquisitionAuctionAveragePrice' - Acquisition Average Auction
'AcquisitionAuctionCleanPrice' - Acquisition Good Condition Auction
'AcquisitionRetailAveragePrice' - Acquisition Average Retail
'CurrentRetailCleanPrice' - Current Retail Good Condition
'CurrentRetailAveragePrice' - Current Average Retail
'CurrentAuctionCleanPrice' - Current Good Condition Auction
'CurrentAuctionAveragePrice' - Current Average Auction
Current Prices
Acquisition Prices
Retail
Auction
Good Condition
Average Condition
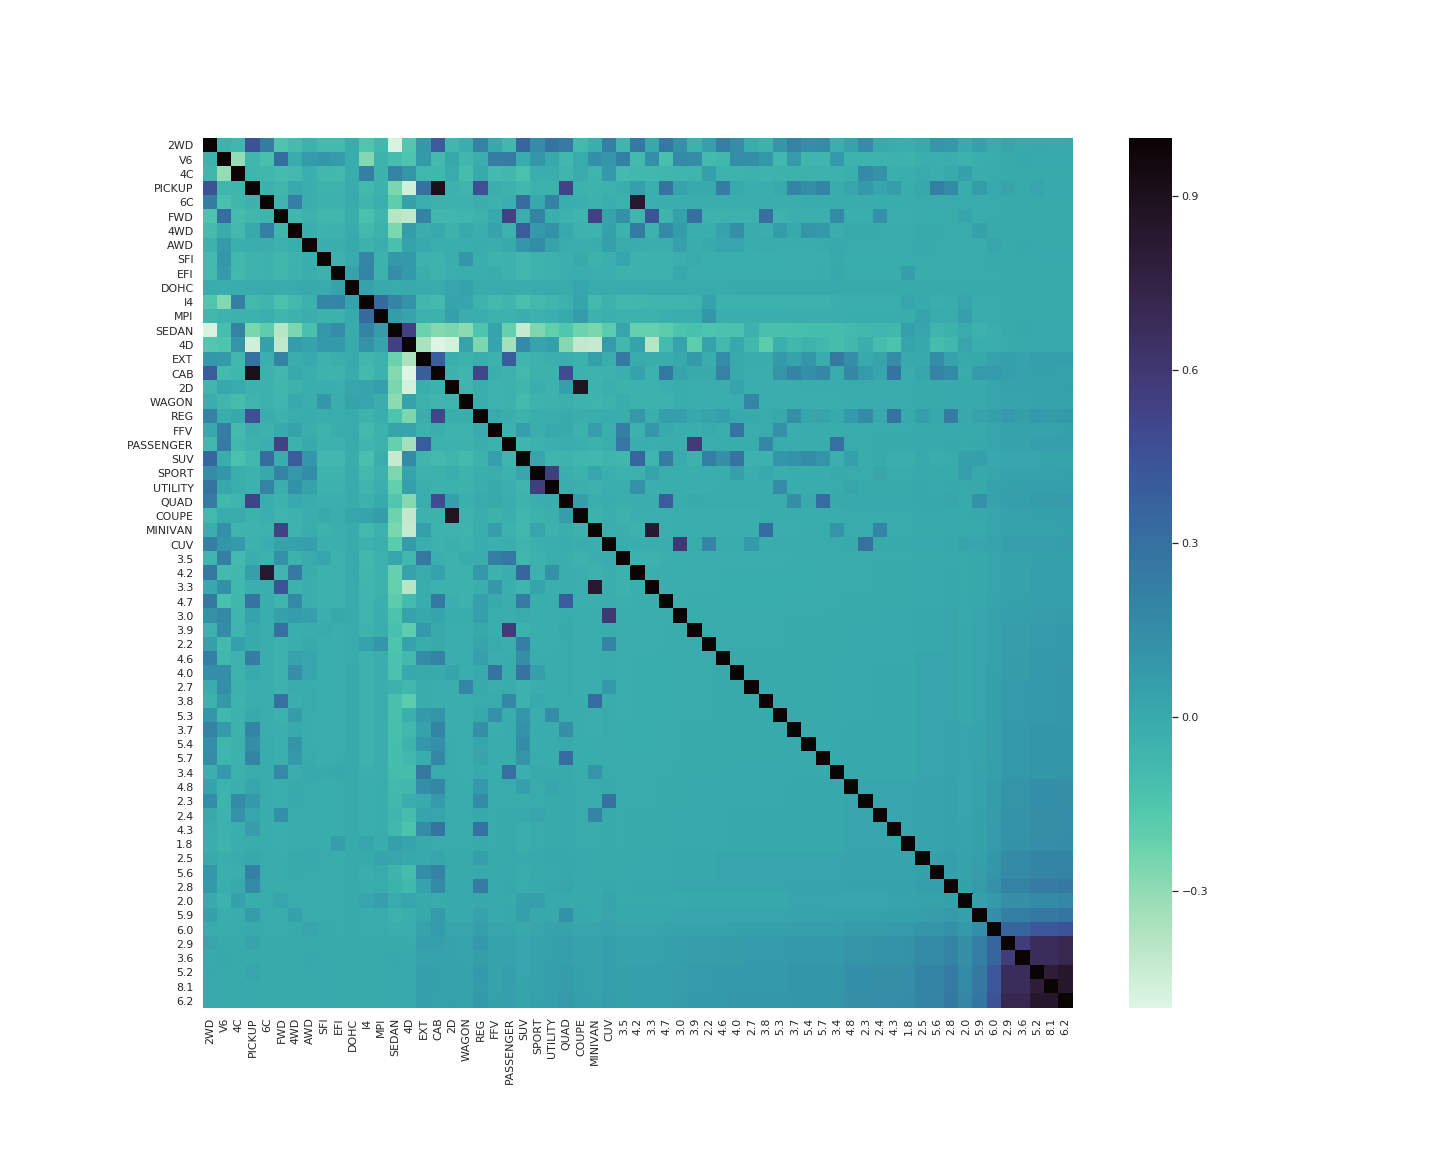
Correlation Between Prices
Expected Margin
'Average Price'
Average Price - Vehicle Cost = Expected Profit Margin
Feature engineering
Dealing with the categorical features

Feature engineering
Dealing with the categorical features
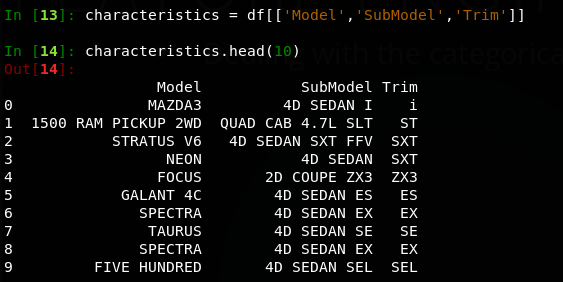
'Model'
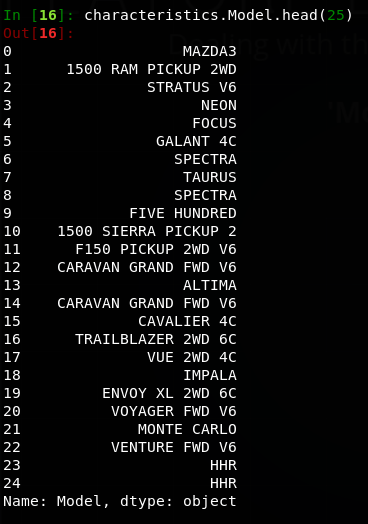
Before
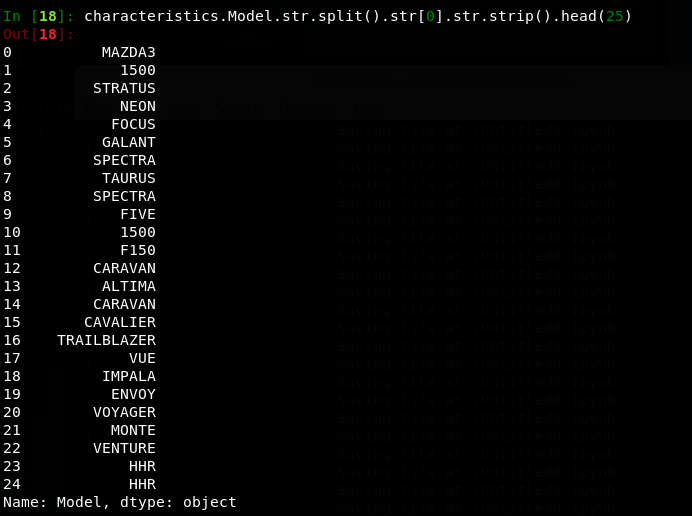
After
This is a quick way to remove the additional information after the model name. However, some mix ups will occur. Such as makers having similar models like the Chevy and Dodge.The Sierra and Ram are both identified as 1500 and 'Monte Carlo' is truncated.
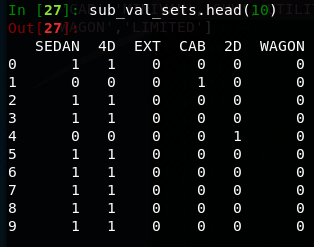
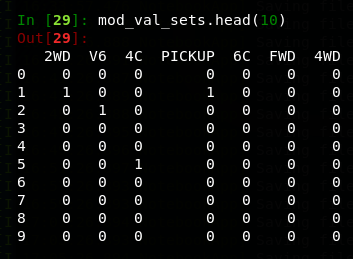
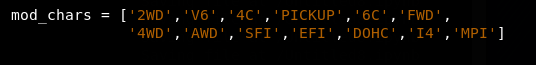
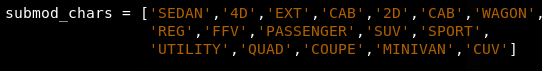
'Model' and 'SubModel'
Identify distinguishing features
Hot encode with keywords


Feature Engineering
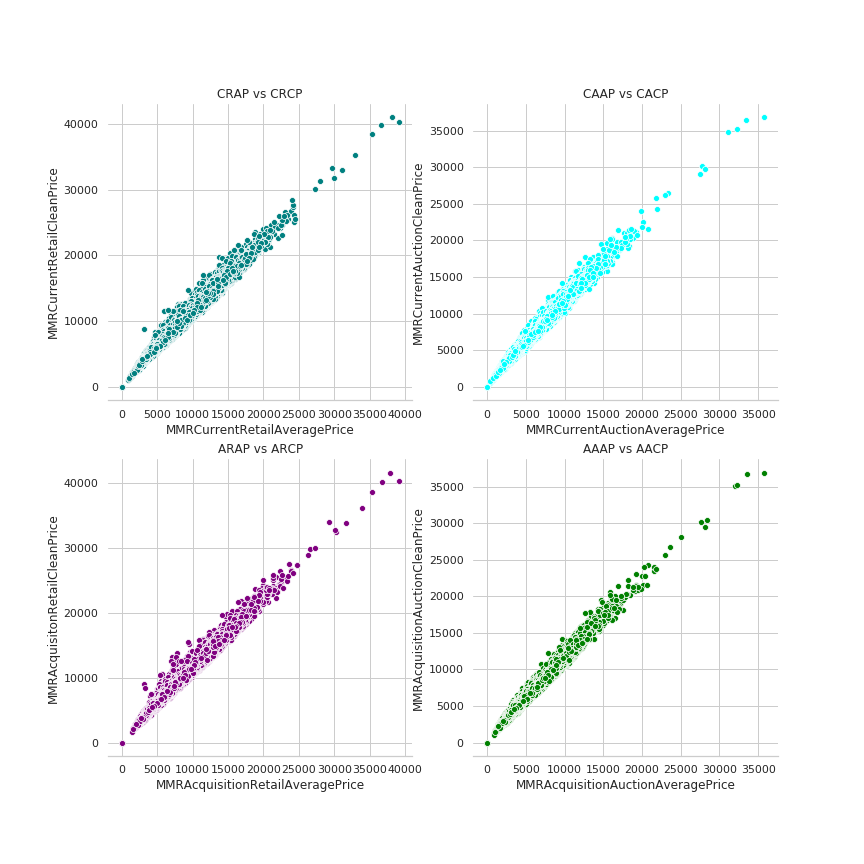
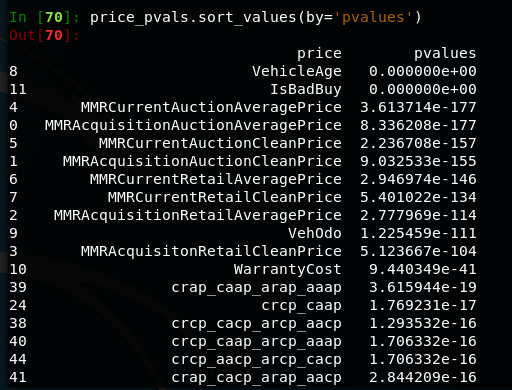
Very low p-values on t-tests for prices between lemons and non lemons
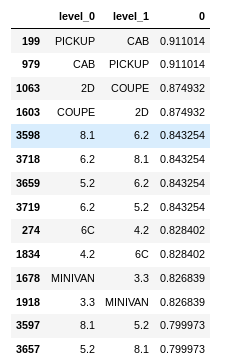
I dropped a few of the newly created features based on their correlation after reviewing how frequently each feature appeared in the data. e.g. 'CAB' has 3,916 occurrences while 'PICKUP' has 3,280.
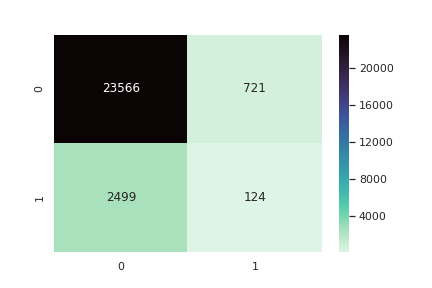
Confusion Matrix
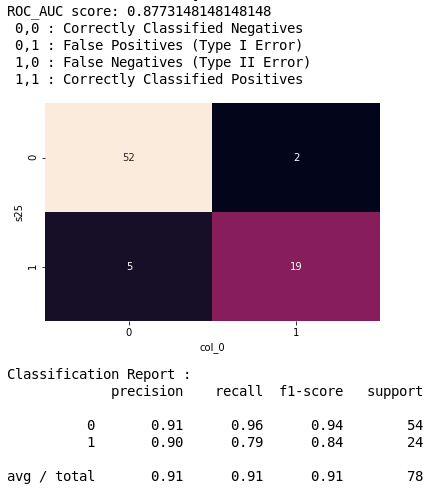
What percent of your predictions were correct?
You answer: the "accuracy" was (52+19) out of 78 = 91%
What percent of the positive cases did you catch?
You answer: the "recall" was 19 out of 24 = 79%
What percent of positive predictions were correct?
You answer: the "precision" was 19 out of 21 = 90%
ROC & AUC
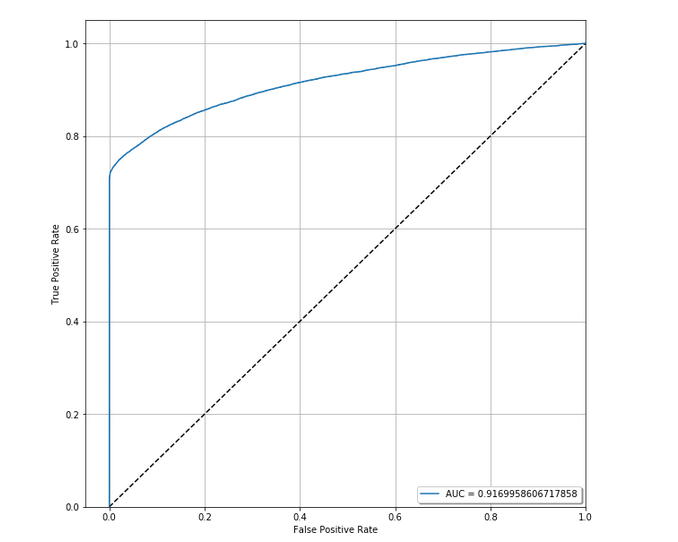
A
B
.5
.5 + A
Area under the curve (AUC)
Gini Index
A
A + B
=
2*A
A = .87 - .5 = .37
B = .5 - A = .13
G = .37/.5 ~ .74
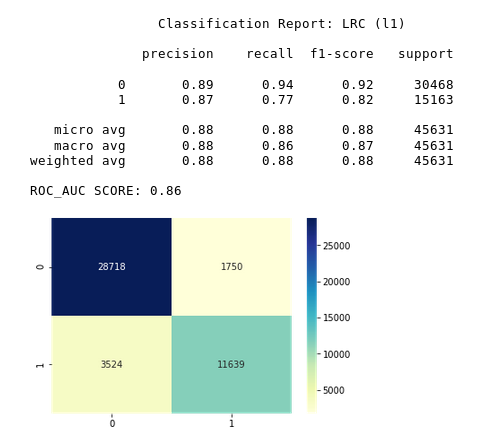
Metrics for Evaluating the Model
Preliminary Model


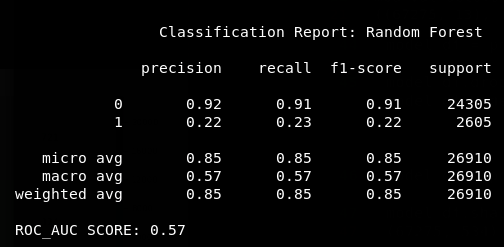

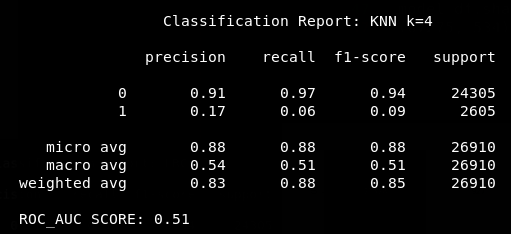
KNN Classifier
Logistic Regression (lasso)
Random Forest
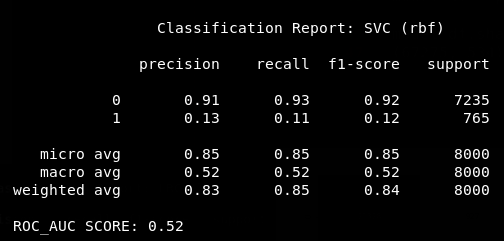
SVC
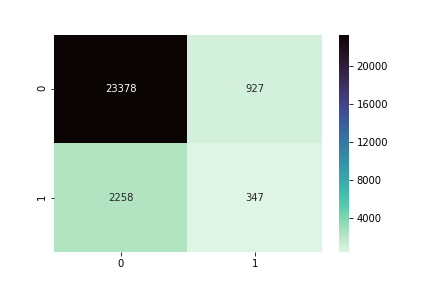
Yikes!
Why are the scores so low?

Whats going on?


What can we do about this?
Feature selection & Smote

Lemons Before
Lemons After
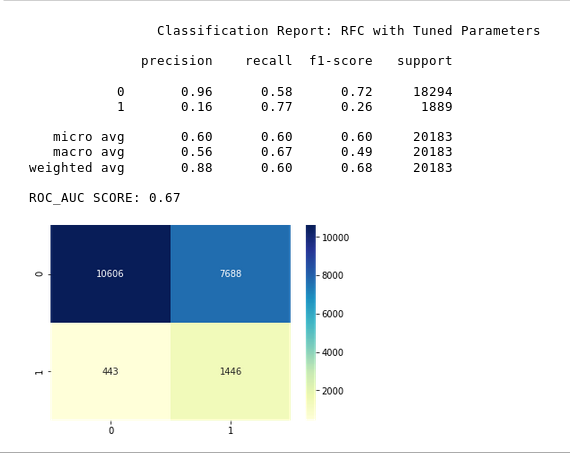
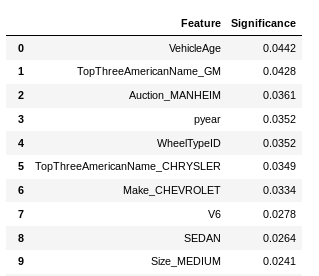
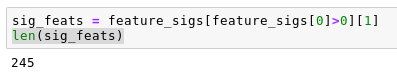
Keep significant features from Random Forest Classifier.
Use SMOTE to mitigate the class imbalance in the outcome variable
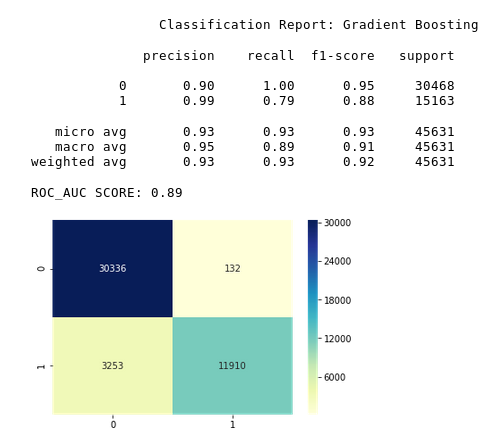
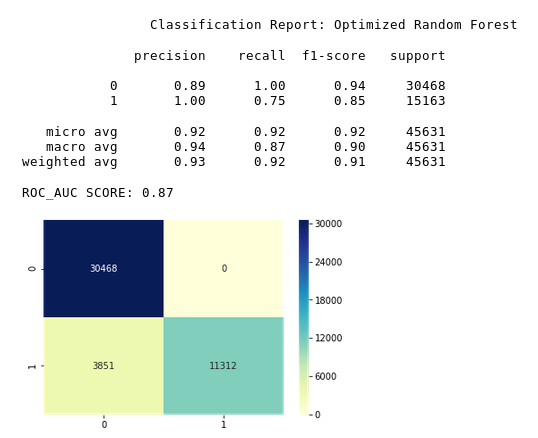
# 2. Random Forest
#1. Gradient Bootsting
#3. Logistic Regression (lasso)
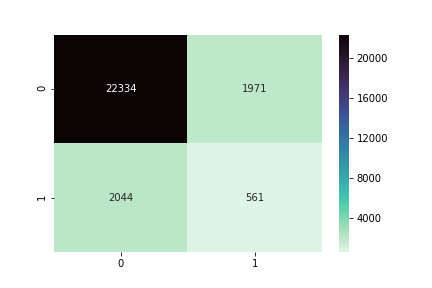
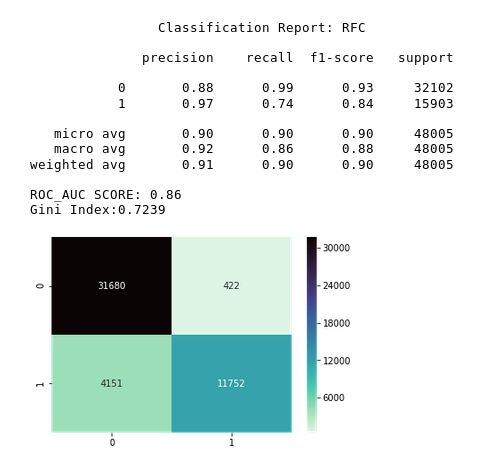
After eliminating some features and performing SMOTE on the data, the results improved dramatically.
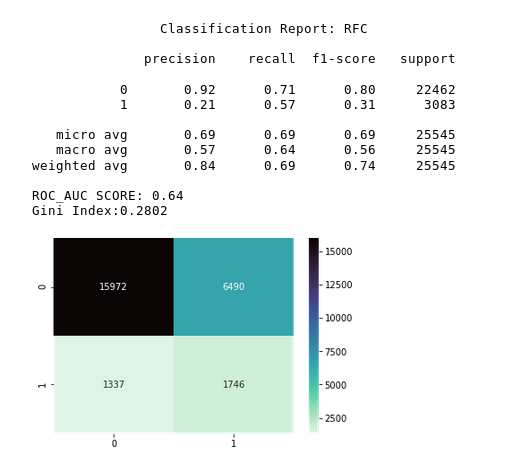
But how would this model do if it was given new, imbalanced information?
Original Data
Training Set
Test Set
SMOTE Training Set
SMOTE Testing Set
Train Model Here
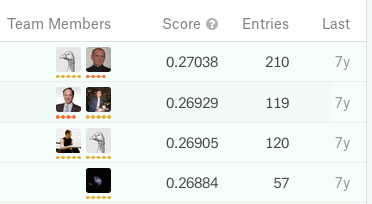
Top Kaggle Entries
Text
SMOTE Data Here
Gini
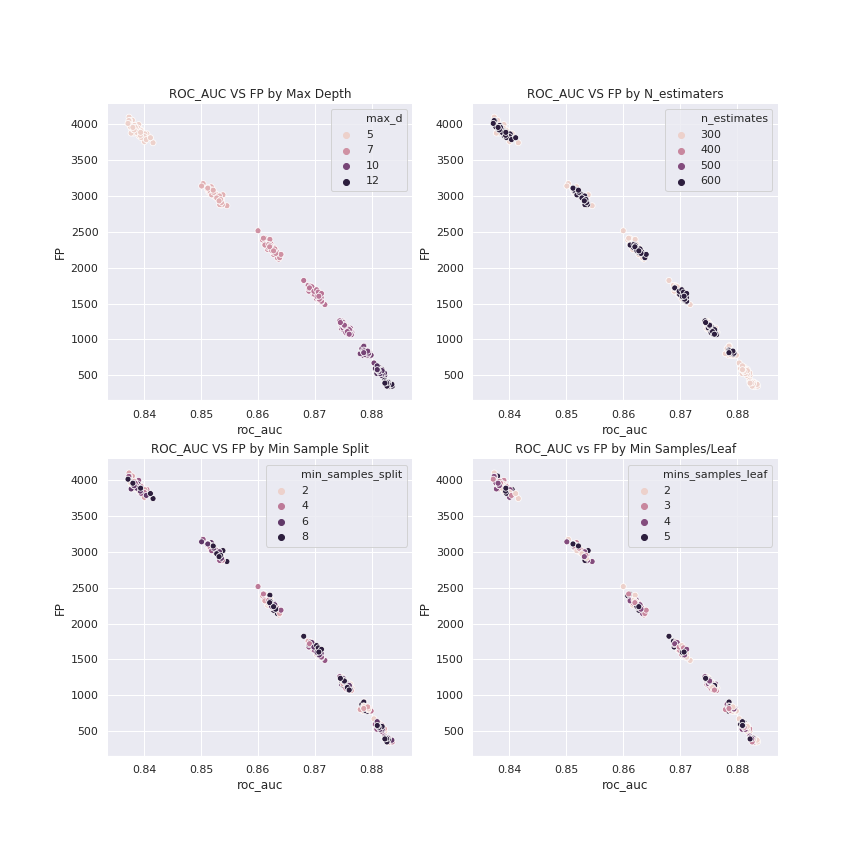
Smote &Hyperparameters
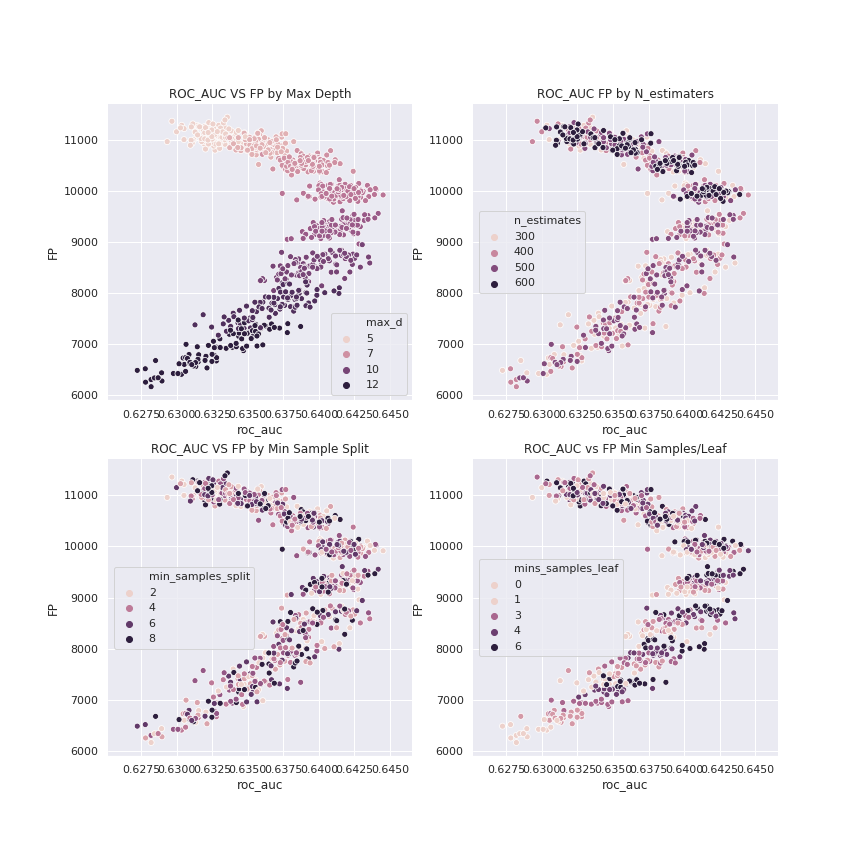
Before SMOTE
After SMOTE
840 RFC interations
~245 RFC iterations
Conclusion
The model performed extremely well after performing SMOTE on the data.
However, the complexity of the model became apparent after an average score of 76% in a 5-CV cross validation. (recall-macro)
The idea of the model being too complex is further supported by the scores from the leader board on Kaggle.
While the gap in information symmetry may never fully be bridged, this model shows that it is capable of helping car dealers avoid lemons...
But at what cost?
Next Steps
1. Continue to reduce attributes in order to reduce the complexity of the model.
2. Increase Gini index by tuning hyperparameters
3. Subscribe to carfax and use the incident reports to add information to dataset.
Industry Application
Through exploratory analysis it is possible to attempt to maximize the profitability of the inventory.
Using a chosen inventory goal, the model could used to avoid a fair amount of lemons and minimizing the opportunity cost.
Sources
The Market for Lemons
Lemons - Definition
The Data
kdnuggets
Lemon laws
This publication is for non-commercial educational purposes.
Will Morgan Nov 2, 2018
willdox7@live.com
Code:
Host
Lemons
By will-m
Lemons
Using supervised learning to identify the probability of a car being returned to the auction.


