Maps in React.js
a first lesson in web GIS
I'm Will
- Engler.Will@gmail.com | wengler@axon.com
- Full Stack Software Engineer at Axon
- LinkedIn - hmu
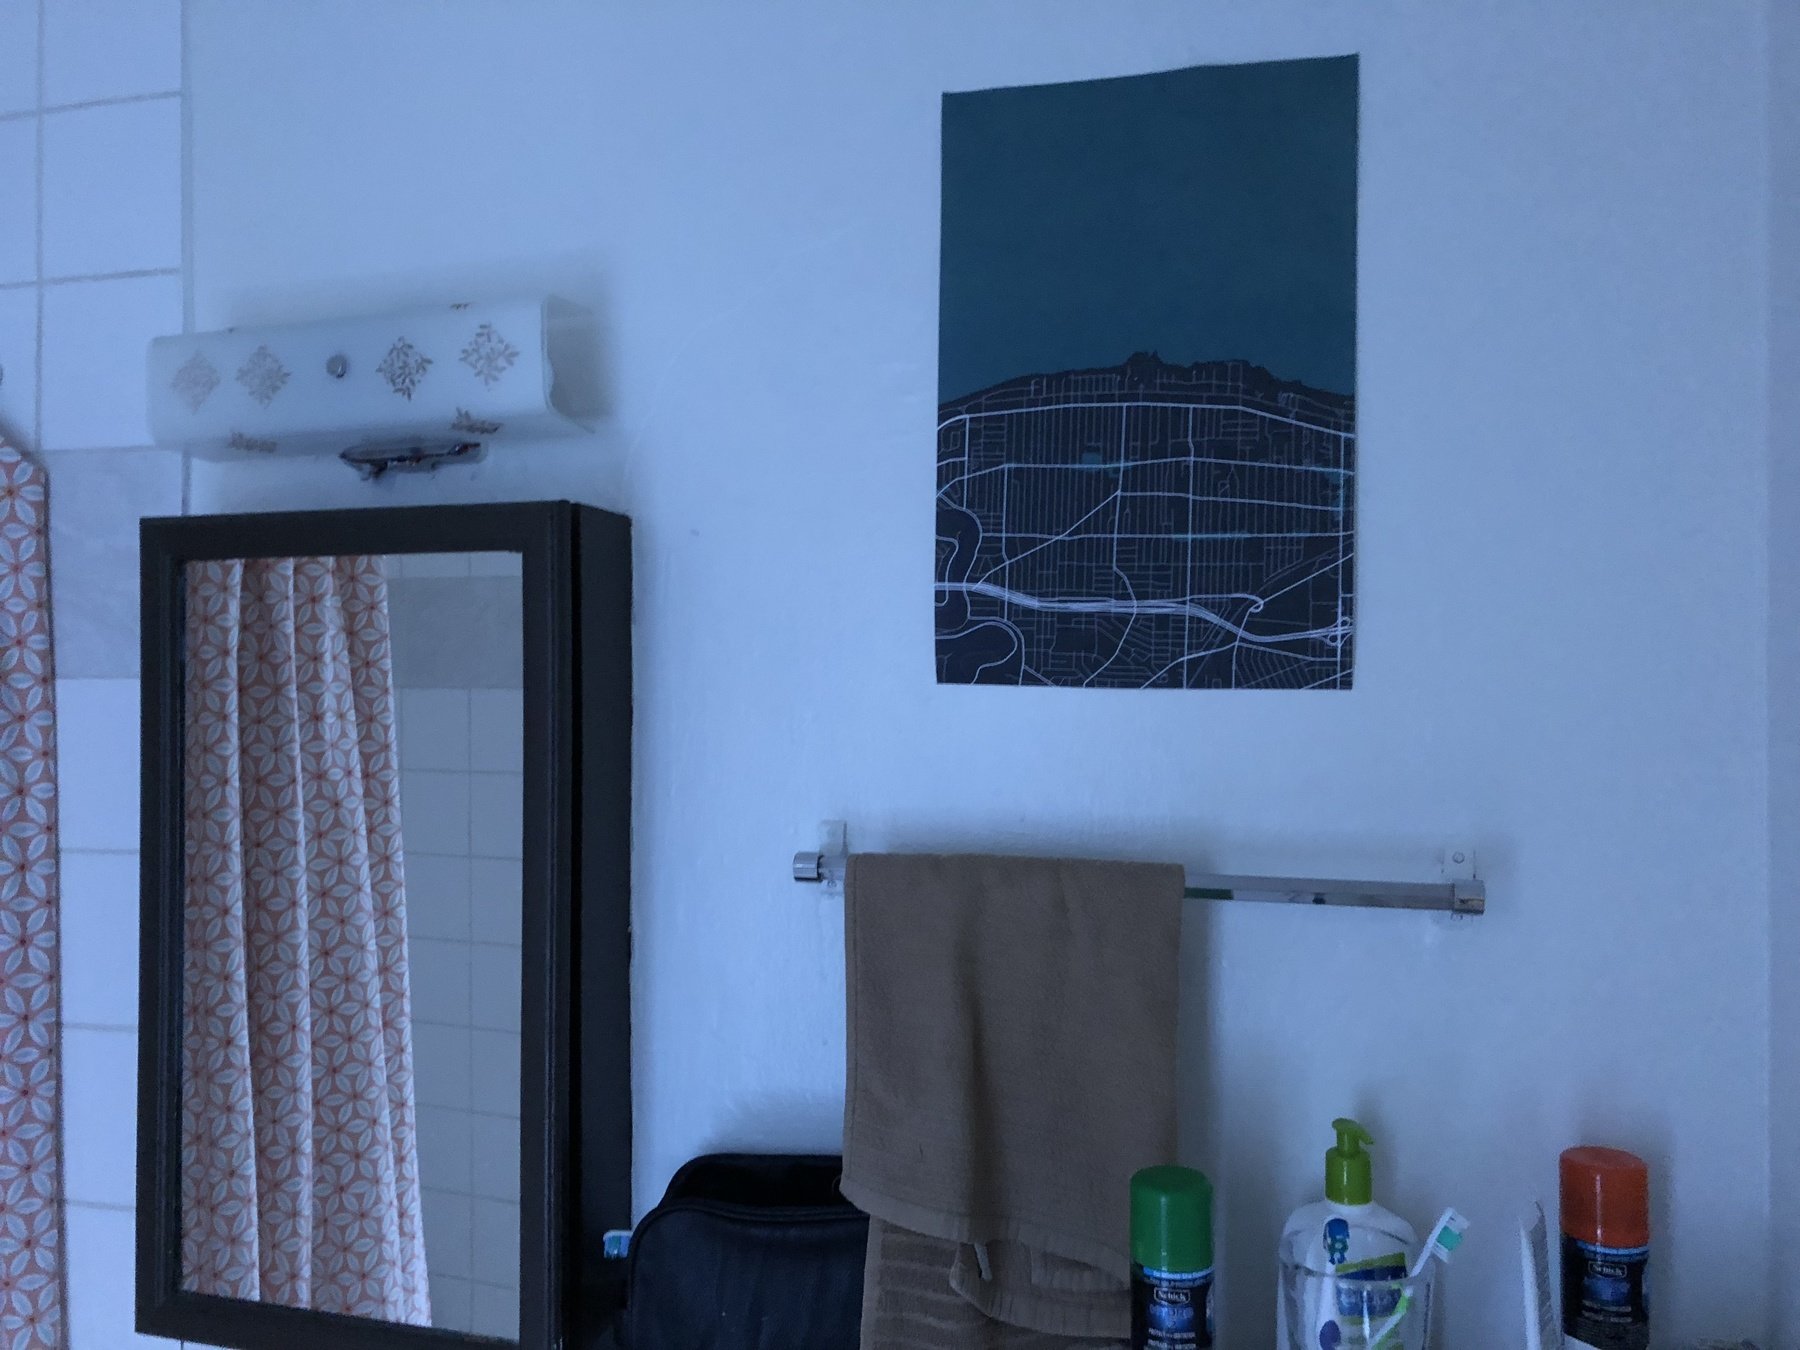
Me and Maps
- "Everything is related to everything else, but near things are more related than distant things"


What This Talk Is For
- Target audience
- You know how to make web applications, but you're new to mapping
- Goals
- Know how to go from longitudes and latitudes in a database to points on a map
- Understand design tradeoffs of different ways to integrate maps into a React app
Hello World
// Adapted from https://developers.google.com/maps/documentation/javascript/adding-a-google-map
function initMap() {
  const seattle = {lat: 47.6062, lng: -122.3321};
  const map = new google.maps.Map(
      document.getElementById('map'), {zoom: 4, center: seattle});
  const marker = new google.maps.Marker({position: seattle, map: map});
}
The Next 25 Minutes of Your Life
- How do we put data on a map?
- How do we React-ify this?
Maps on The Internet
How do web maps work in the first place?
How do we visualize data on top of them?
Tiles
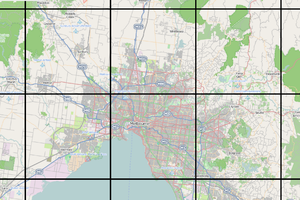
- The tile server stores different zoom levels of a web mercator map broken, into 256x256 px tiles
- Given current zoom and dimensions of the map, the web mapping library requests the right tiles on demand
- Can serve raster tiles (flat images) or vector tiles (frontend library needs to render from vector data)
Web Mercator
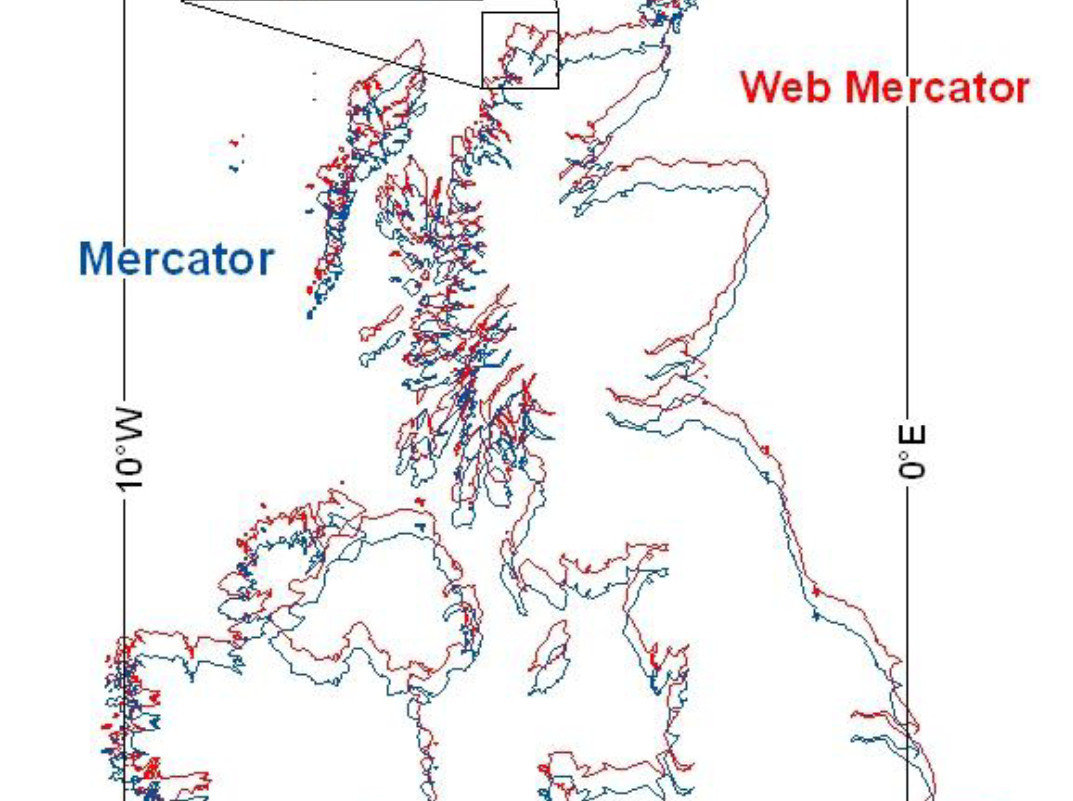
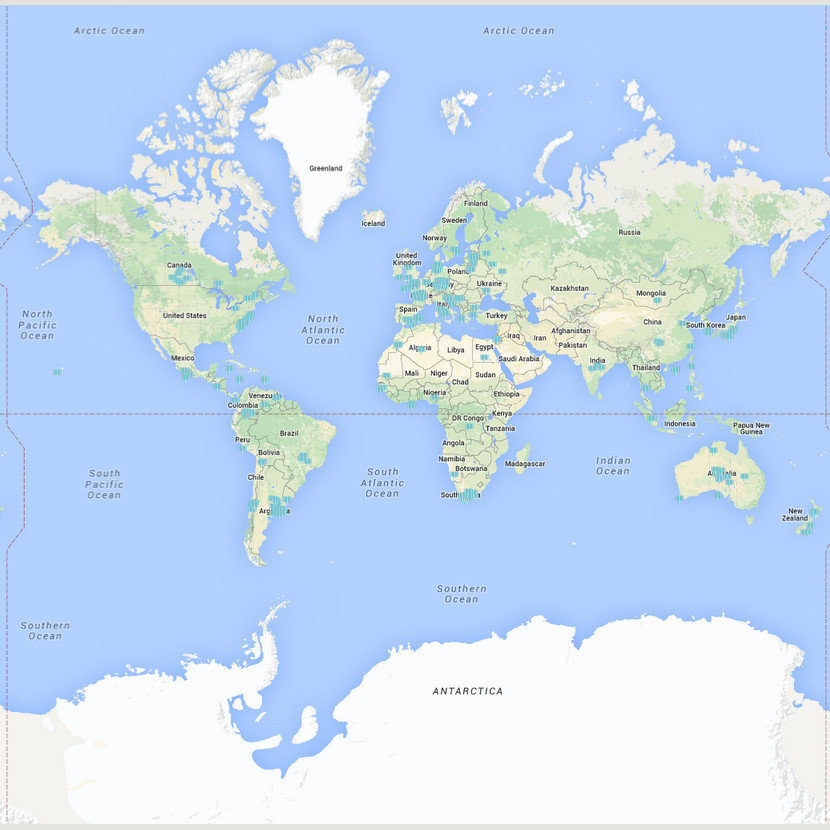
- Like the well-known Mercator projection, but cuts some corners
- More distortion towards the poles.
- Less trigonometry, so less computationally taxing
- More details
Providers
- There are lots:
- Google, Bing, MapBox, and HERE are big names
- Some fun reverse engineering of how Google generates its maps
- A recent price comparison of different providers
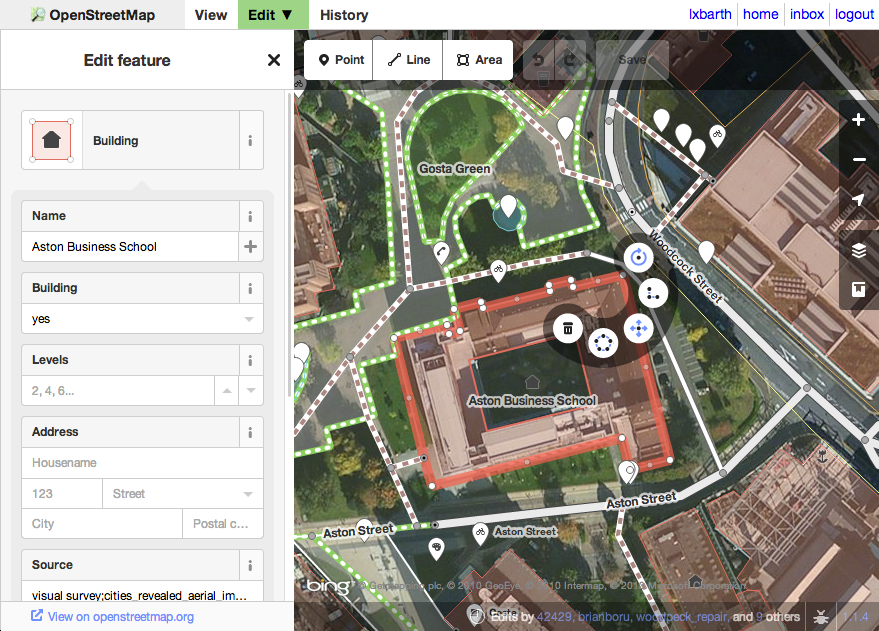
Making public contributions to Open Street Map
Basemaps
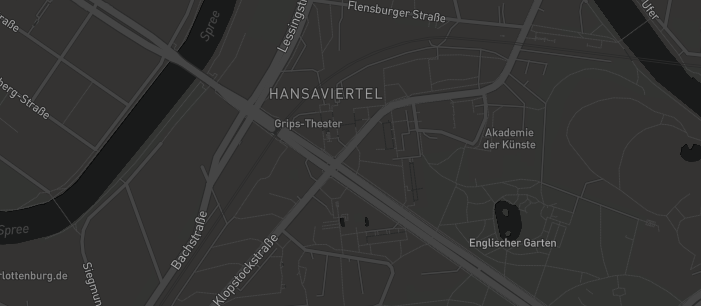
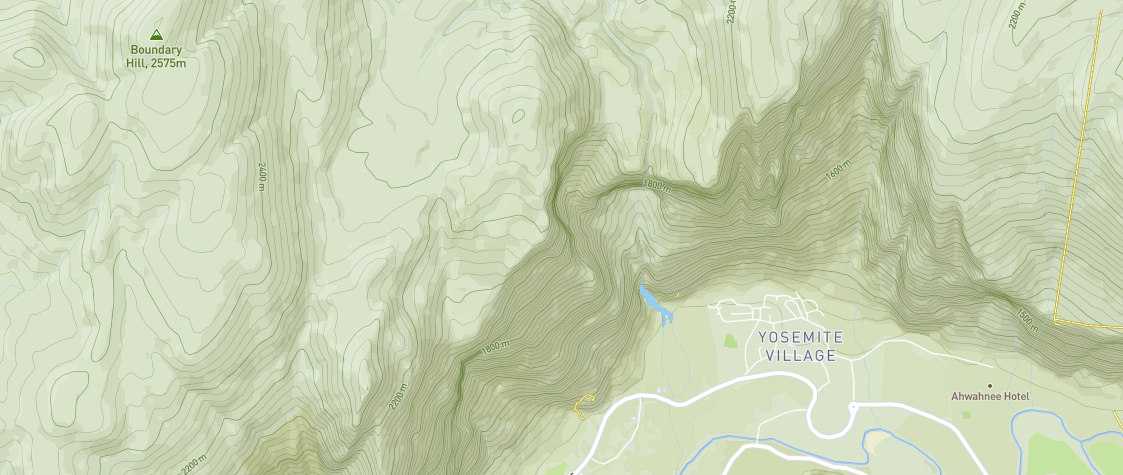
MapBox base layers optimized for high contrast data visualization and outdoors navigation, respectively
Hello World Revisited
// Adapted from https://developers.google.com/maps/documentation/javascript/adding-a-google-map
function initMap() {
  const seattle = {lat: 47.6062, lng: -122.3321};
  const map = new google.maps.Map(
      document.getElementById('map'), {zoom: 4, center: seattle});
  const marker = new google.maps.Marker({position: seattle, map: map});
}
Bigger Visualizations
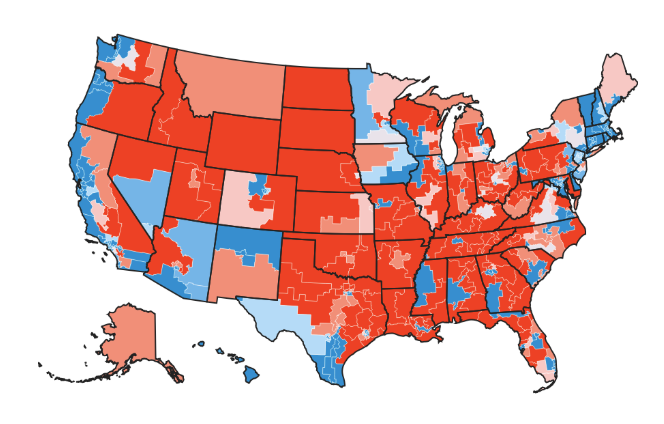
- Let's speed through this Leaflet example of how to map states by population density
Let's Cheat!
- Assume we have some data in GeoJSON
- Other formats to be aware of: KML, ESRI Shapefile
More Complex Data Types
- Nice, practical intro to spatial geometry types
- Spatial operations on the fronten

The state border of Michigan is a multipolygon
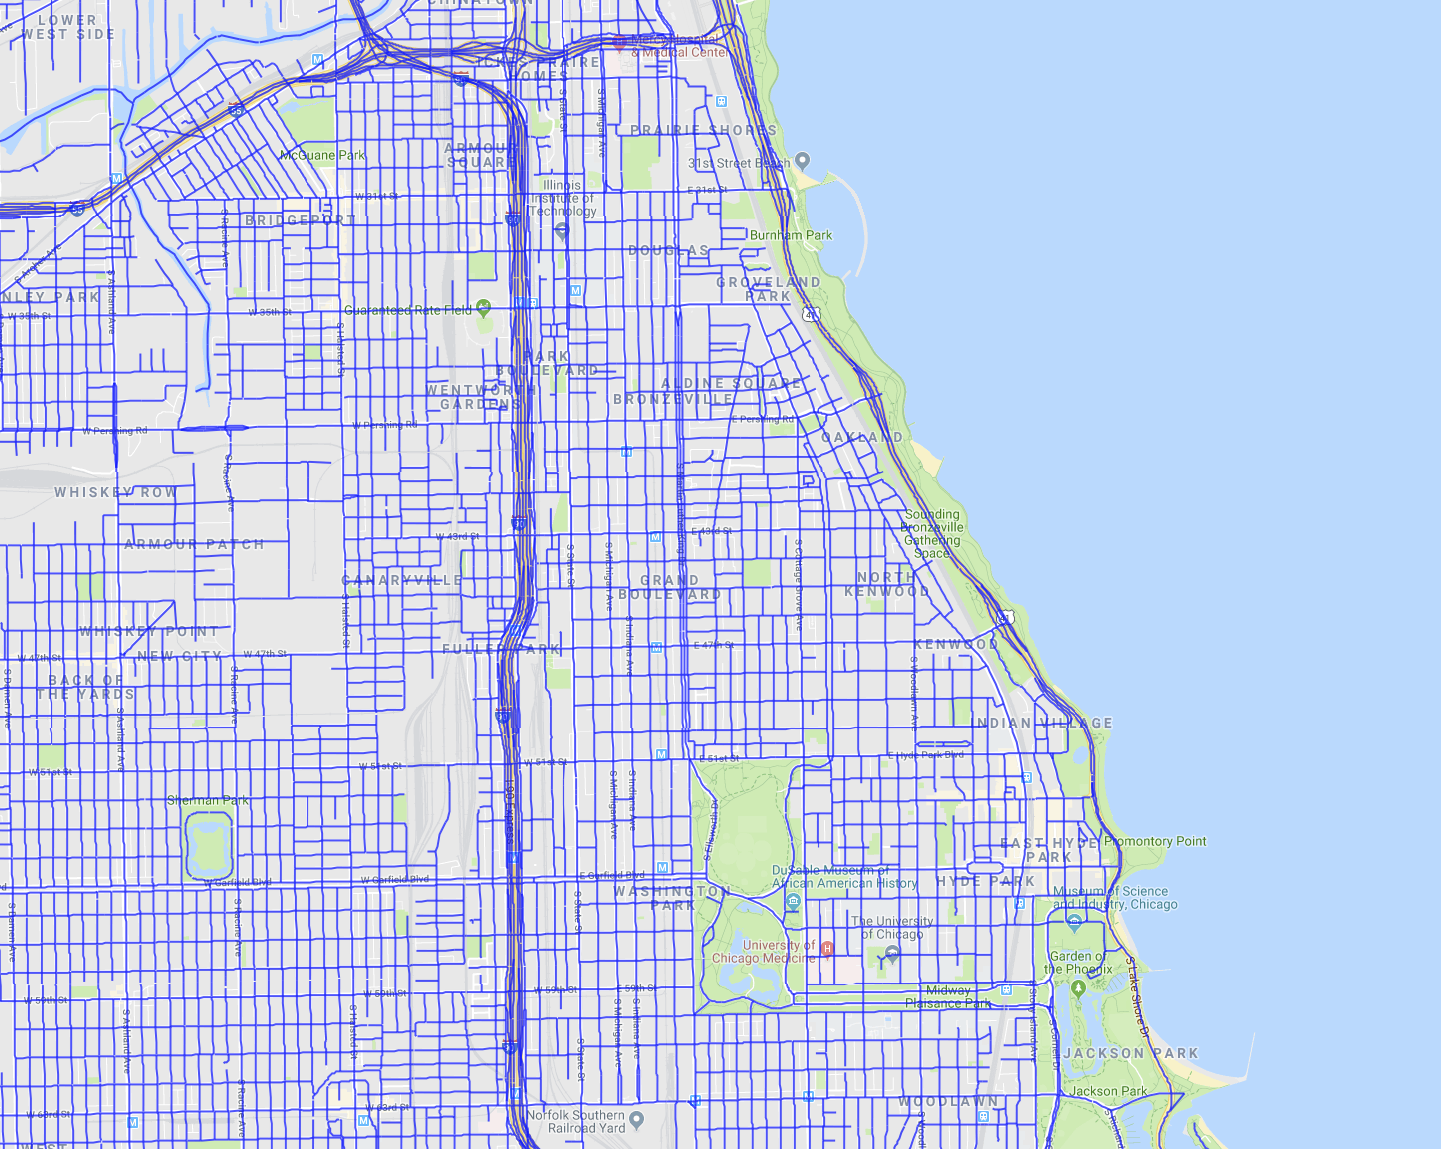
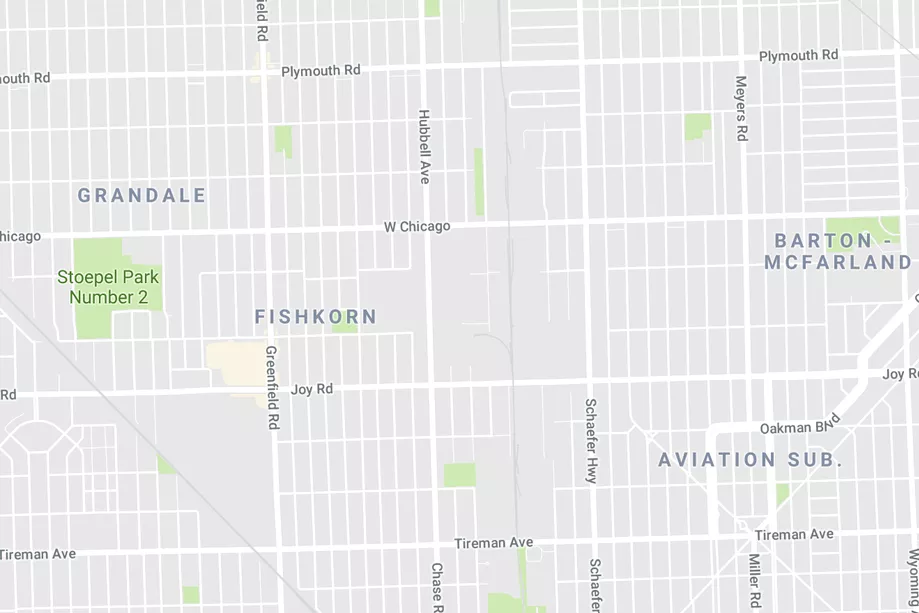
We can use a multiline to model Chicago's streets
var statesData = {
  "type":"FeatureCollection",
  "features": [
    {
      "type":"Feature",
      "id":"01",
      "properties": {
        "name": "Alabama",
        "density":94.65
      },
      "geometry": {
        "type": "Polygon", "coordinates": [ ... <lots of longitude, latitude pairs>
var mapboxAccessToken = {your access token here};
var map = L.map('map').setView([37.8, -96], 4);
L.tileLayer(tileUrl, {
id: 'mapbox.light',
attribution: ...
}).addTo(map);
L.geoJson(statesData).addTo(map);
function getColor(d) {
return d > 1000 ? '#800026' :
d > 500 ? '#BD0026' :
/// etc
}
function style(feature) {
return {
fillColor: getColor(feature.properties.density),
weight: 2,
opacity: 1,
/// etc
};
}
L.geoJson(statesData, {style: style}).addTo(map);End Product

Adding Your Own Data to Basemaps
- Sometimes, it can make sense to add your own layers to a basemap
- "Bake" your data into the tiles
- Don't need to overlay it on the map dynamically on every client
Things I Am Eliding
- Backend concerns
- Deeper cartography
- Geocoding
- Routing
- A great deal more!
Maps With React
How do I idiomatically integrate maps into my React app?
Provider Libraries (MapBox Example)
<script>
// Adapted from https://www.mapbox.com/mapbox-gl-js/example/geojson-markers/
mapboxgl.accessToken = 'pk.eyJ1IjoidGFzZXIiLCJhIj'
var map = new mapboxgl.Map({
    container: 'map',
    style: 'mapbox://styles/mapbox/light-v9',
    center: [-96, 37.8],
    zoom: 3
});

map.on('load', function () {
    map.addLayer({
        "id": "points",
        "type": "symbol",
        "source": {
            "type": "geojson",
            "data": someGeoJSON
            }
        },
    });
});
</script>
Reactifying Map Libraries
- You probably don't want to do it yourself
- Example wrapper for Google Maps
import { GoogleMap, Marker } from "react-google-maps"

...

render() {
  return (
    <GoogleMap
      defaultZoom={8}
      defaultCenter={{ lat: -34.397, lng: 150.644 }}
    >
      {props.isMarkerShown && <Marker position={{ lat: -34.397, lng: 150.644 }} />}
    </GoogleMap>
  )
}
Peeking Under The Covers
- Code for the base map component in react-map-gl (wrapping Mapbox)
componentDidMount() {
  const {mapStyle} = this.props;

  this._mapbox = new Mapbox(Object.assign({}, this.props, {
    mapboxgl, // Handle to mapbox-gl library
    container: this._mapboxMap, // a ref to the div we're putting the map in
    onError: this._mapboxMapError,
    mapStyle: normalizeStyle(mapStyle)
  }));
  this._map = this._mapbox.getMap();
}
Case Study: MapBox Wrappers
- Let's assume you want vector tiles.
- The base JS lib is Mapbox GL JS.
- There are a few options for your React wrapper ...
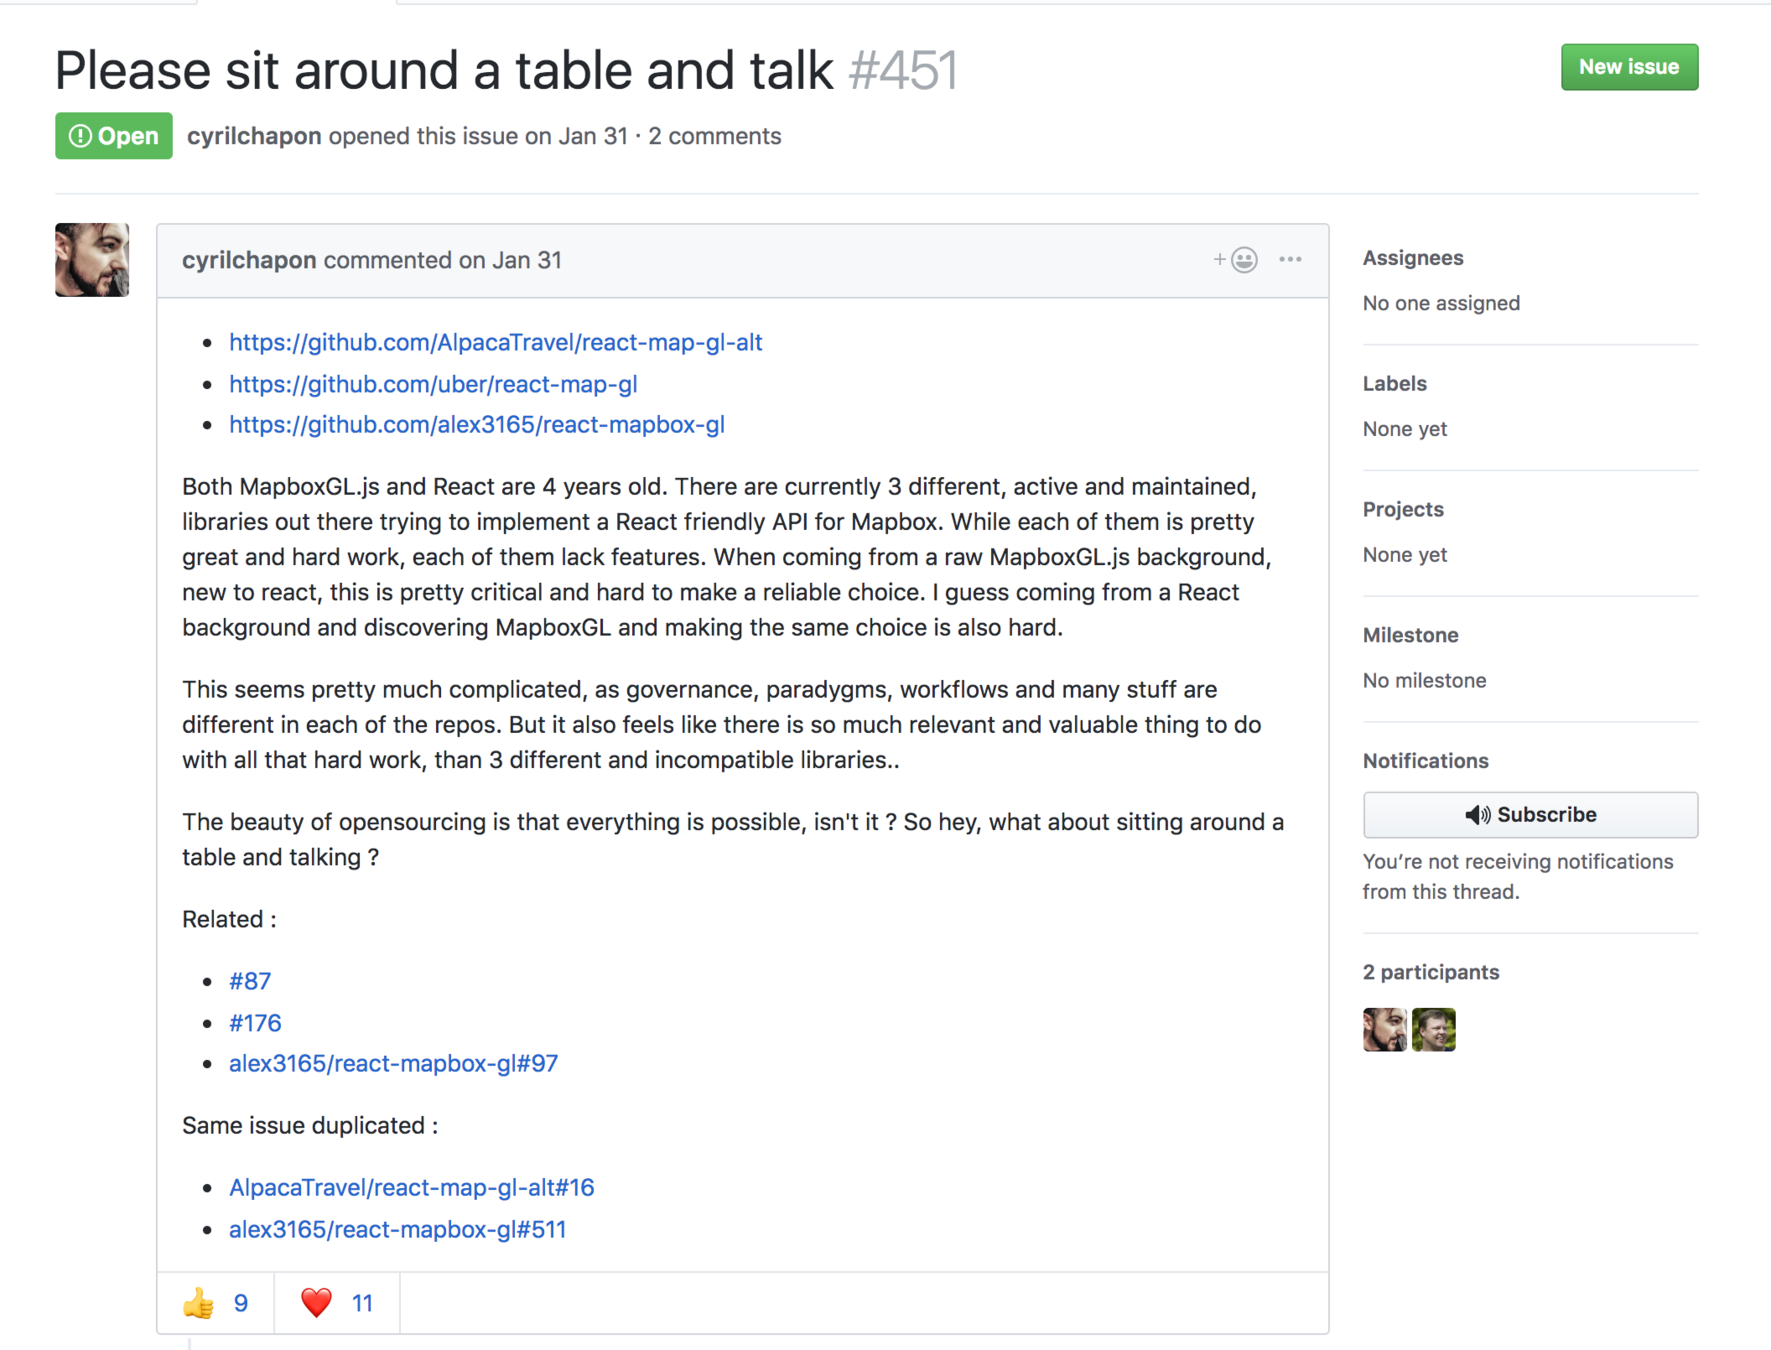
Different Design Philosophies
- react-mapbox-gl ("The Alex wrapper"): A thin layer on top of Mapbox GL. Pragmatically leave in some of the imperative parts.
- react-map-gl ("The Uber wrapper"): Rethink the Mapbox GL API. Everything should adhere to the React way, even if that means not exposing all the features of Mapbox GL.
Handling Moves
- Alex Wrapper: subscribe to a move event. You get an FYI after the fact that the position has changed.
- Uber Wrapper: onViewportChange handler is called. Map will not update until you setState with new location.
import {Component} from 'react';
import ReactMapGL from 'react-map-gl'; // Uber wrapper

class Map extends Component {

  state = {
    viewport: {
      width: 400,
      height: 400,
      latitude: 37.7577,
      longitude: -122.4376,
      zoom: 8
    }
  };

  render() {
    return (
      <ReactMapGL
        {...this.state.viewport}
        onViewportChange={(viewport) => this.setState({viewport})}
      />
    );
  }
}
Alex Wrapper: GeoJSON
import ReactMapboxGl, { GeoJSONLayer } from "react-mapbox-gl";

const Map = ReactMapboxGl({
  accessToken: "*****"
});

<Map>
    <GeoJSONLayer
      data={geojson}
      symbolLayout={{
        "text-field": "{place}",
        "text-font": ["Open Sans Semibold", "Arial Unicode MS Bold"],
        "text-offset": [0, 0.6],
        "text-anchor": "top"
      }}/>
</Map>
You can do anything that Mapbox GL does, which is quite a bit. But no more.
Composing Advanced Visualizations
- Benefit of the hardline React approach: easier composition.
- Uber team built Deck.GL library that sits on top of the Uber wrapper. Deck.GL overlays a separate WebGL canvas on top of the Mapbox WebGL canvas. The declarative style makes it tenable to keep them in sync.
- With the Alex wrapper, you're limited to the layers implemented directly in Mapbox GL JS.
- (Caveat: the Mapbox team is working on opening this up)
Negative: Reinventing the Wheel
- I've personally encountered rough edges in the Uber libraries' plumbing
- eg, a bug in their event handling that I needed to read the source to hack around
- Deck.gl is very IE11 incompatible
Takeaways
- Two good options for Mapbox wrappers!
- Map libraries are super impressive: they've done most of the hard work for you.
- The trickiest part (imo) of the frontend implementation is integrating the imperative parts of a mapping library with your otherwise beautiful, untainted React codebase
Tying Up
Maps at Axon
- Open jobs in Seattle
- Body Cameras
- Virtual backup, situational awareness
- Computer Aided Dispatch
- Get first responders to 911 calls quickly and safely
- And lots more!
Thanks!
Engler.Will@gmail.com | wengler@axon.com | LinkedIn
Graveyard
Slides and links that got cut
Space
- Not as bad as time
- We live on a pudgy sphere, or "oblate spheroid"
- A "reference spheroid" is a particular 3D model of earth
- Longitude and latitude define points on the spheroid
- We're at {latitude: 47.6062, longitude -122.3321}
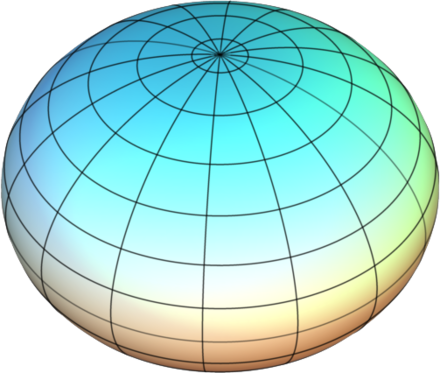
"Highly Exaggerated" spheroid
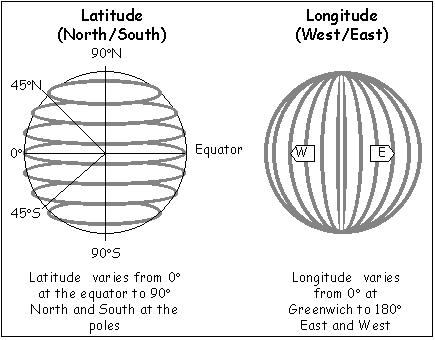
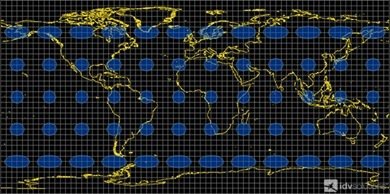
Spatial Reference Systems
- Reference spheroid + projection
- Your backend DB probably stores spatial data in SRID 4326
- The WGS 84 spheroid (pudgy earth used by GPS)
- The simplest possible projection (longitude is x, latitude is y)
- Contrast with Web Mercator (SRID 3857 <double check!!!!>): slim earth, trigonometric projection
- There are lots of SRIDs.
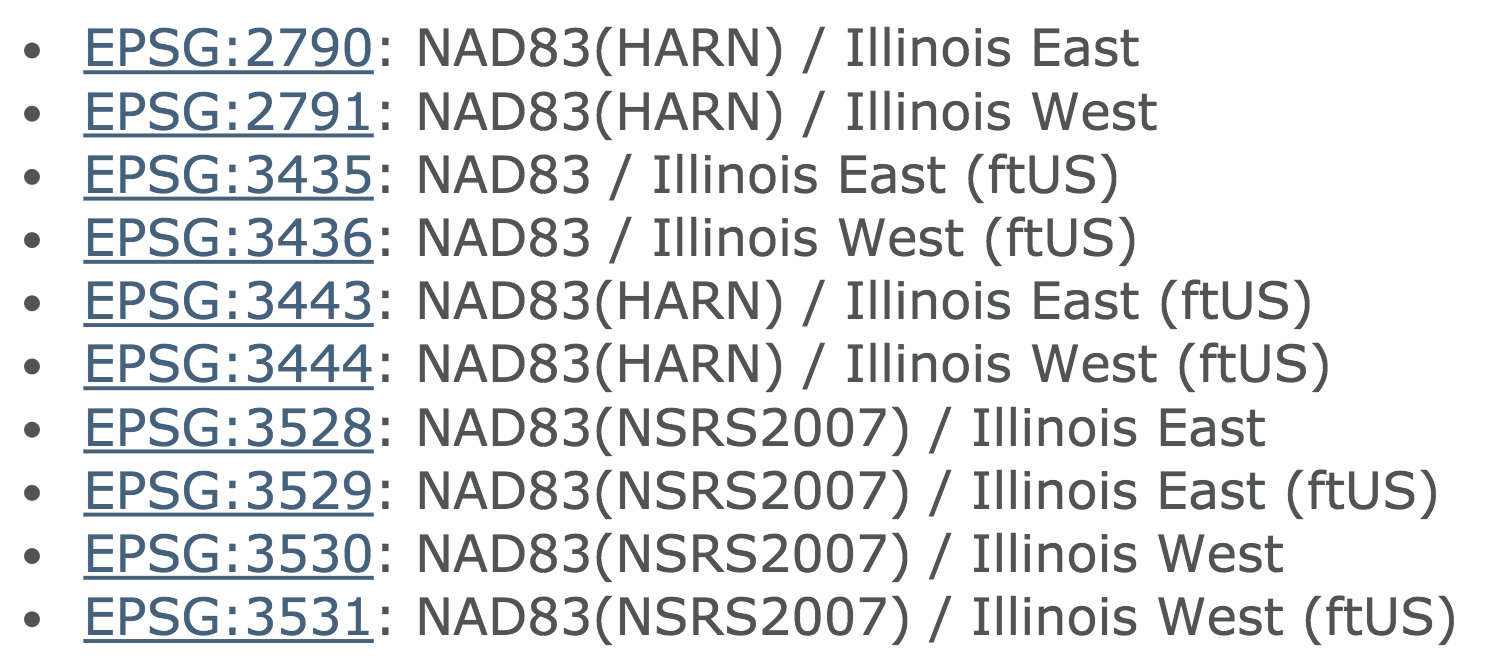
Illinois-specific SRIDs
Projections
- To go from three dimensions to two, we need to project
- Distortion tradeoffs

Backend Stores
- Prefer databases with plugins to support spatial datatypes
- ie, don't store latitude and longitude as two float columns. Store them as one Point column.
- PostGIS is the gold standard. Spatial MySQL is solid.
- There are also "big data" options

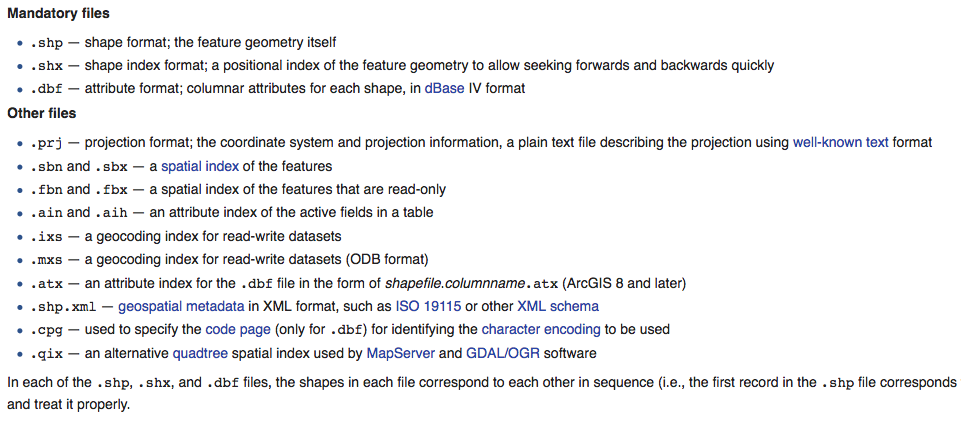
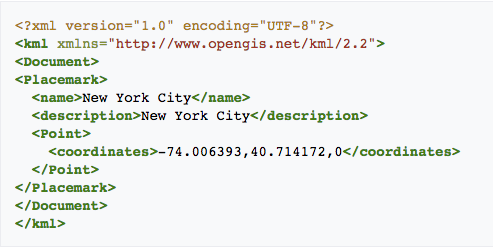
File Formats
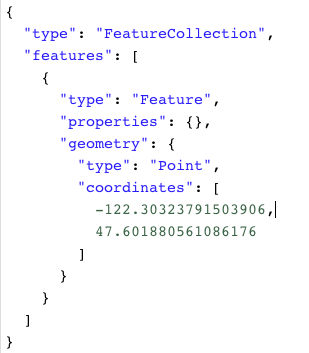
GeoJSON
KML
ESRI Shapefile
Powertools
- GDAL: C library that everything depends on
- ogr2ogr: Absurdly feature-rich command line utility for converting to and from different spatial formats
- QGIS: Open source GUI for viewing and editing spatial data
- GeoPandas: Python library. Enables Jupyter-driven data sciencey workflow for playing with spatial data. Similar bindings in R.
Backend to Frontend
- The backend passes 4326-projected data to the frontend, which shoves it into a Web Mercator map. How does that work?
- At render time, your map library of choice projects your data to Web Mercator
The Map and the Territory - Detroit
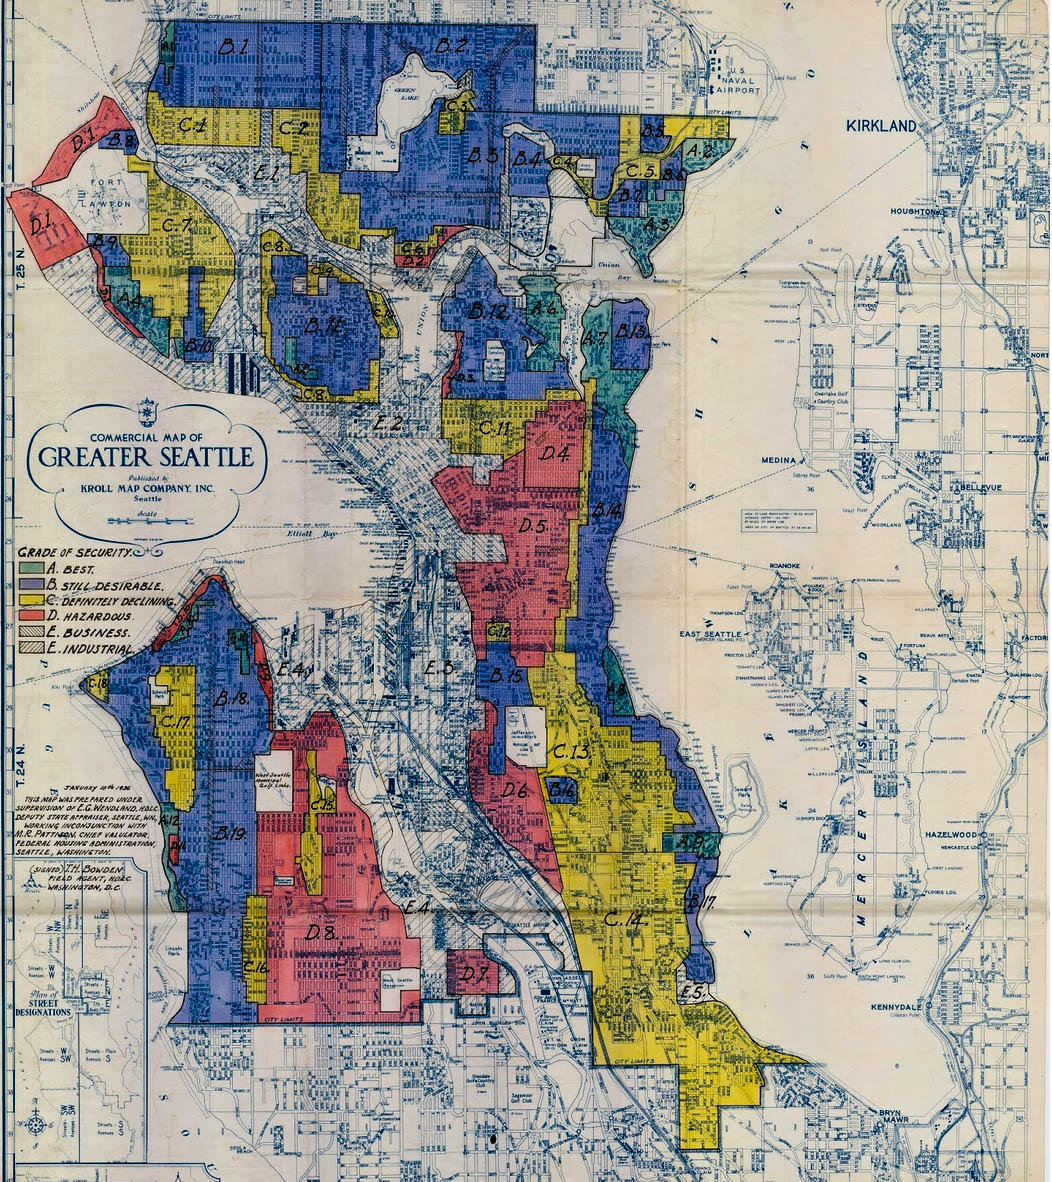
The Map and the Territory - Seattle
Maps in React.js
By Will Engler
Maps in React.js
- 1,429


