Using Chrome Devtools
Topics covered
- The Elements and console panel
- The Network panel
- Rendering, performance and Rails
Elements: review the html and css
Chrome devtools: Overall anatomy

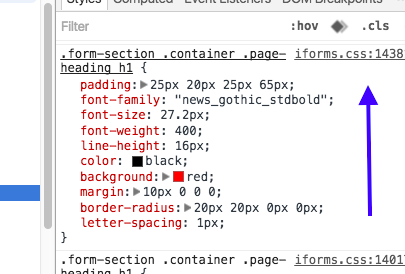
Elements: examine and edit css
Chrome devtools: Elements panel

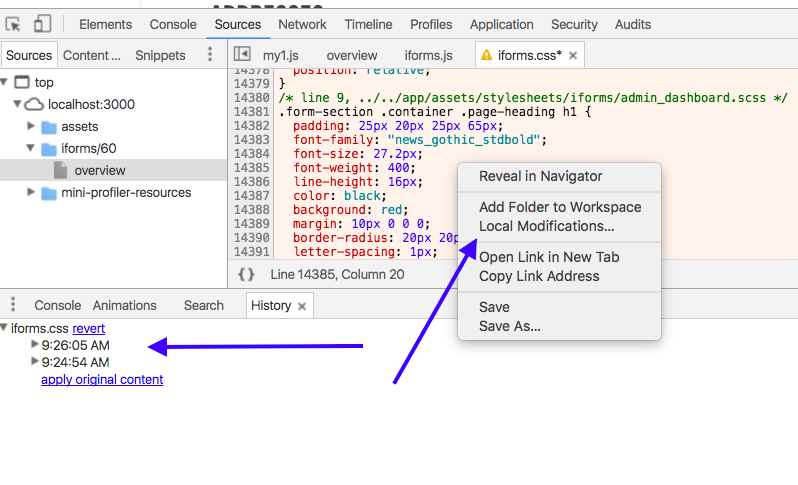
Elements: view local change history
Chrome devtools: Elements panel
Elements: examine event handlers
Chrome devtools: Elements panel

Console: debug javascript
Chrome devtools: Console panel
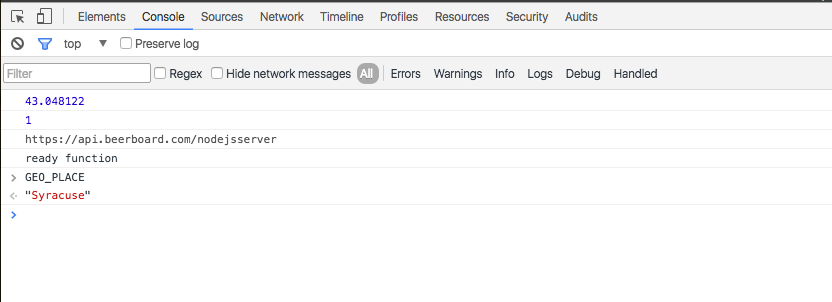
Note:
- Frames are separated environments in console
- This is Chrome's JS runtime (v8) . May not apply to our production runtime (exec.js)
Console: thing to notice
Chrome devtools: Overall anatomy: panels

- We can clear the console
- We can filter the output (filter panel not open by default)
- We can switch to iFrames
- We can persist the console (otherwise it clears on reload)
1
2
3
4
Console: utilities
Chrome devtools: Overall anatomy: panels
| $(css_selector) | gives first match (!= JQuery) |
| $$(css-selector) | gives all matches |
| $x(xpath) | gives all matches |
| $_ | last output |
| $0 ... $4 | last five used elements |
| copy(object) | copies object to clipboard |
| dir(object) | directory style listing (good for Dom) |
| inspect(object) | opens Element panel with object selected |
| getEventListeners(object) | shows all event listeners on the object |
| keys(object) | lists names of properties |
| monitor(function) | logs on console when function is called |
| monitorEvents(object, events) | logs Event object when event occurs on the object |
| table(data) | Log object data with table formatting |
| values(object) | array containing the values of all properties |
Ref: https://developers.google.com/web/tools/chrome-devtools/debug/command-line/command-line-reference?hl=en
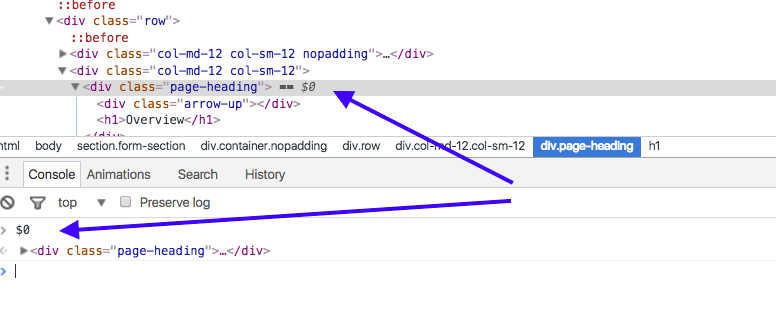
Console: $0
Chrome devtools: Console panel
$0 gives the currently selected element in Elements panel
Thanks to https://hackernoon.com/twelve-fancy-chrome-devtools-tips-dc1e39d10d9d#.t3icnbhze
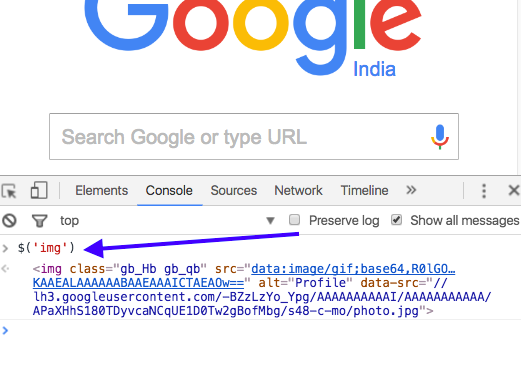
Console: $
Chrome devtools: Console panel
$0 gives the first selected element. No Jquery
Console: copy
Chrome devtools: Console panel
Copy the object to the clipboard
copy($0)
Console: $_
Chrome devtools: Console panel
Shows the last result
$_
Console: monitor
Chrome devtools: Console panel
console.log when the function is called
  function foo() { }
  monitor(foo)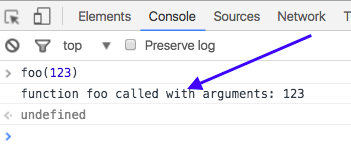
Console: some examples
Chrome devtools: Overall anatomy: panels
var names = {
  0: { nick: "Ji", person: "Praveen" },
  1: { nick: "Jeev", person: "J.P Robinson" } };
table(names);

monitorEvents(window, "resize");

function foo() { return "foo";}
monitor(foo);

getEventListeners(document);

document.body;
dir(document.body);

copy(names);

$('img');
$$('img');
$_
$0
$1
$2
$3
$4

i=$('img');
inspect(i);
Sources Panel
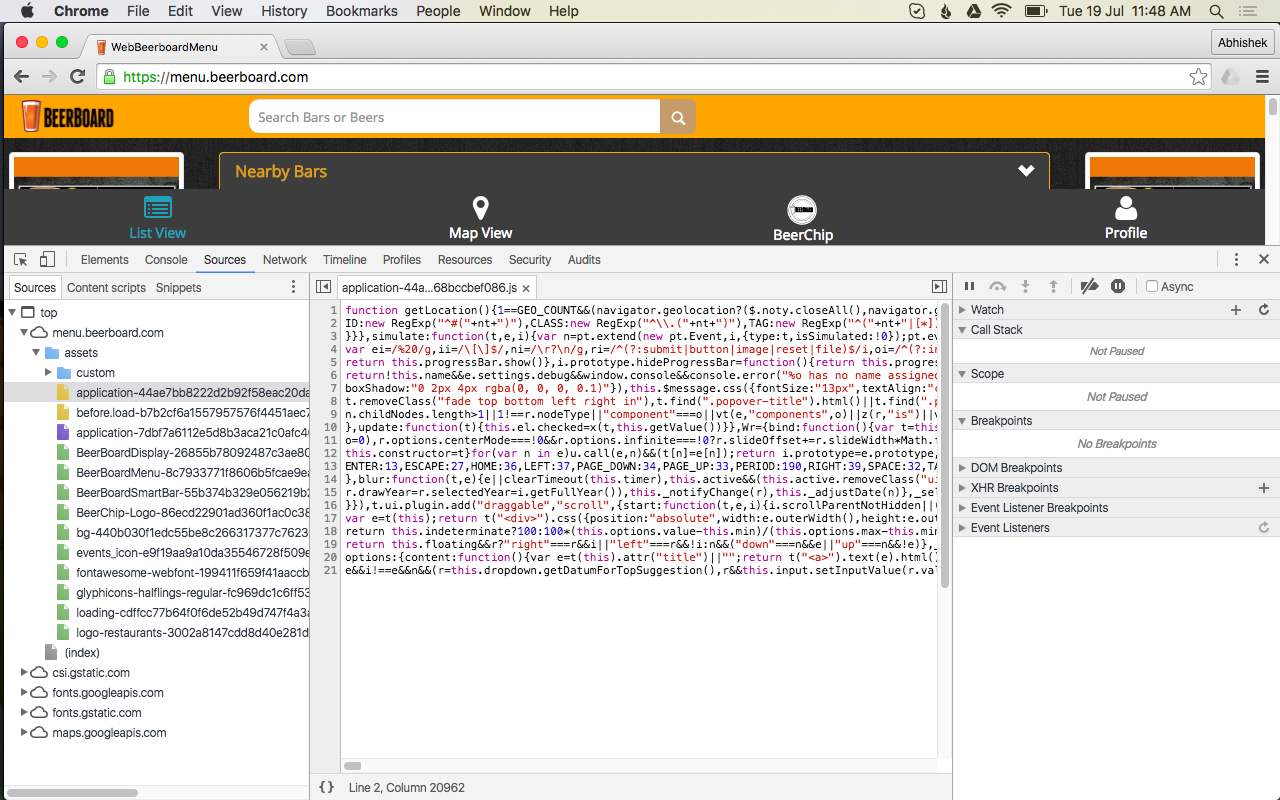
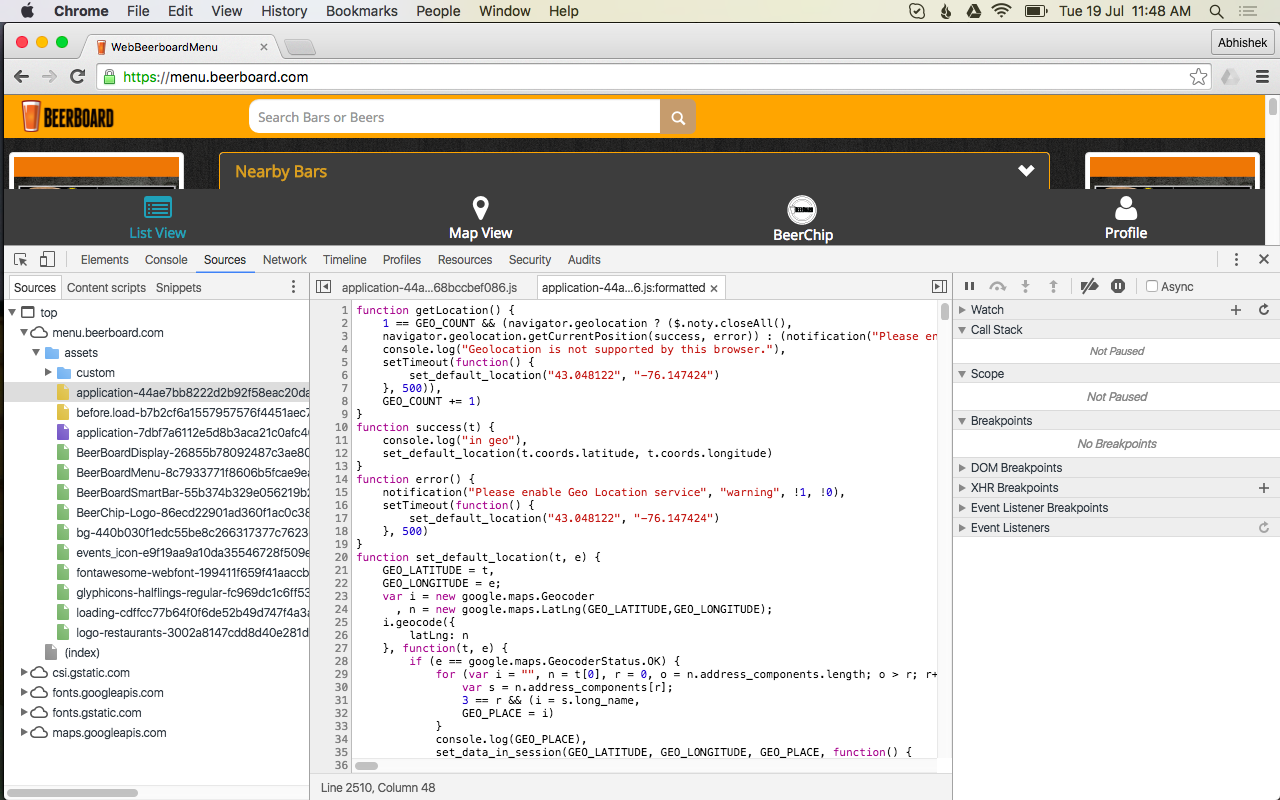
Sources: general view
Chrome devtools: Sources panel
Sources: CMD+P (like Sublime)
Chrome devtools: Sources panel
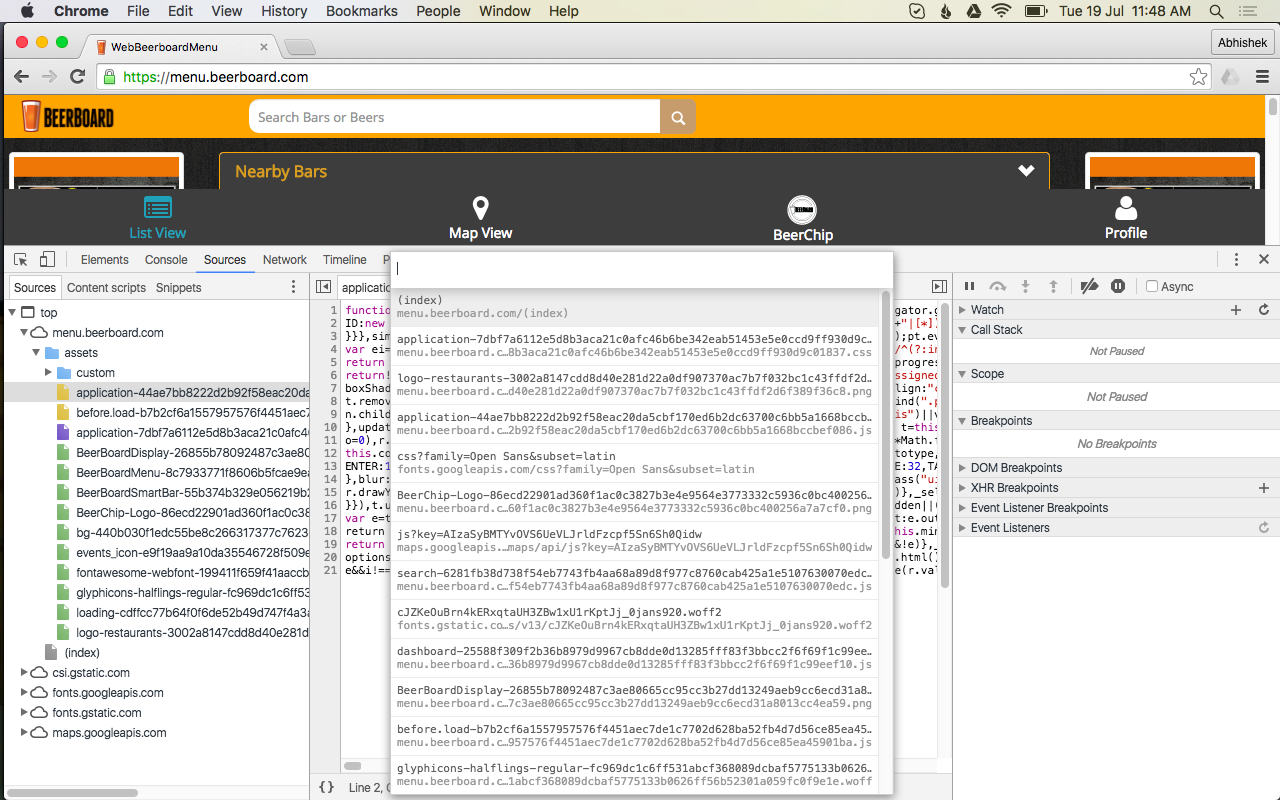
Cmd/Ctrl P
Format it
Sources: Make it pretty
Chrome devtools: Overall anatomy: panels
The network panel
The network panel
Chrome devtools
Customisations
Chrome devtools: Network panel
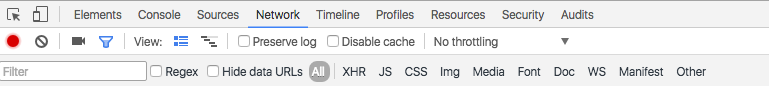
Disable the cache
Show Overview
Use small request rows
Capture screenshots
Customisations
Chrome devtools: Network panel
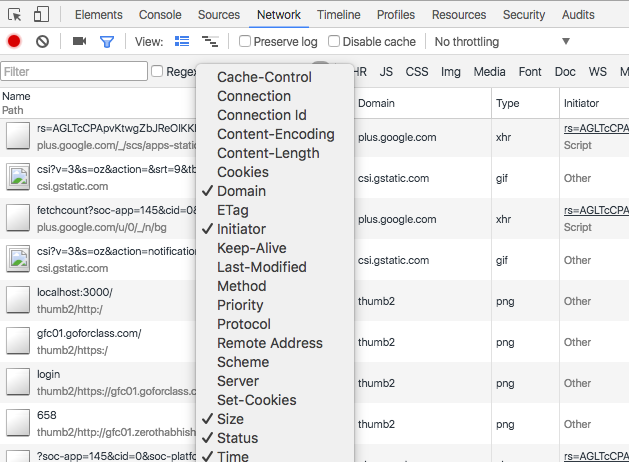
Add Domain column (right click here to add get the menu)
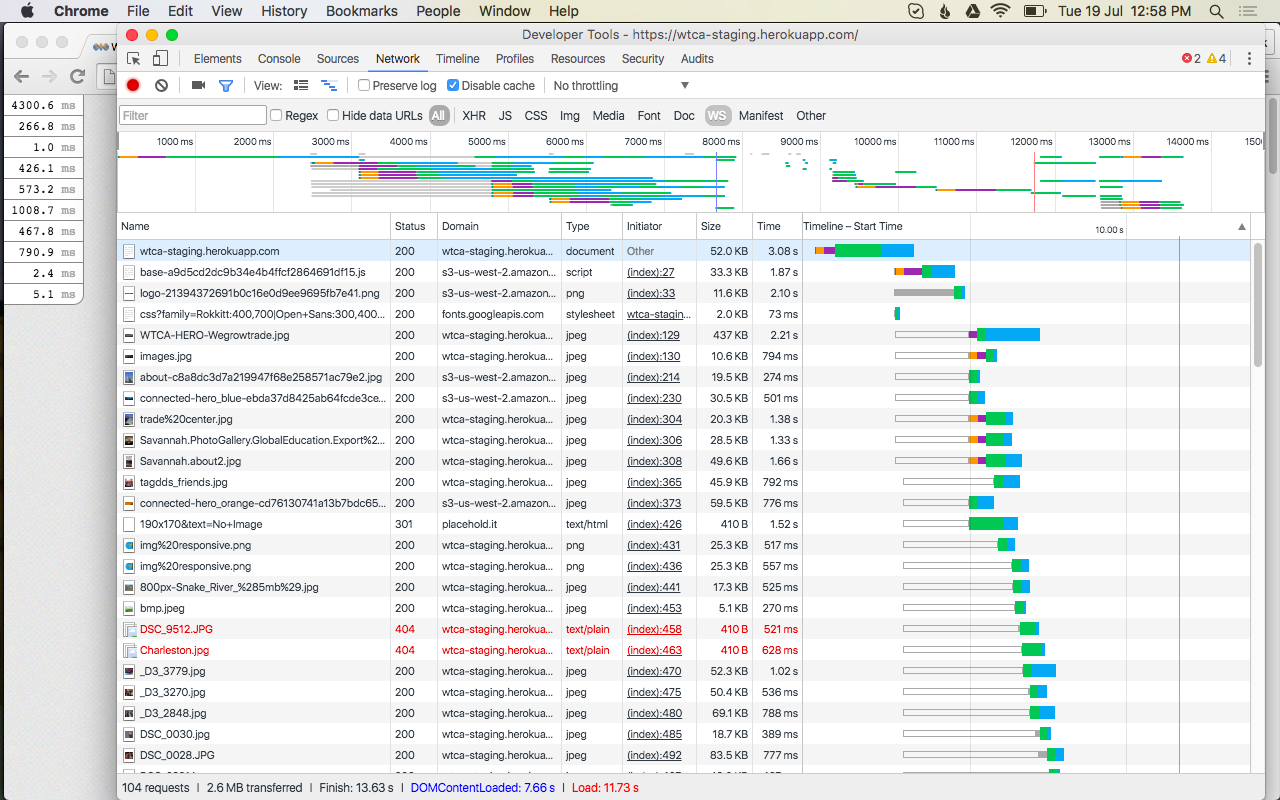
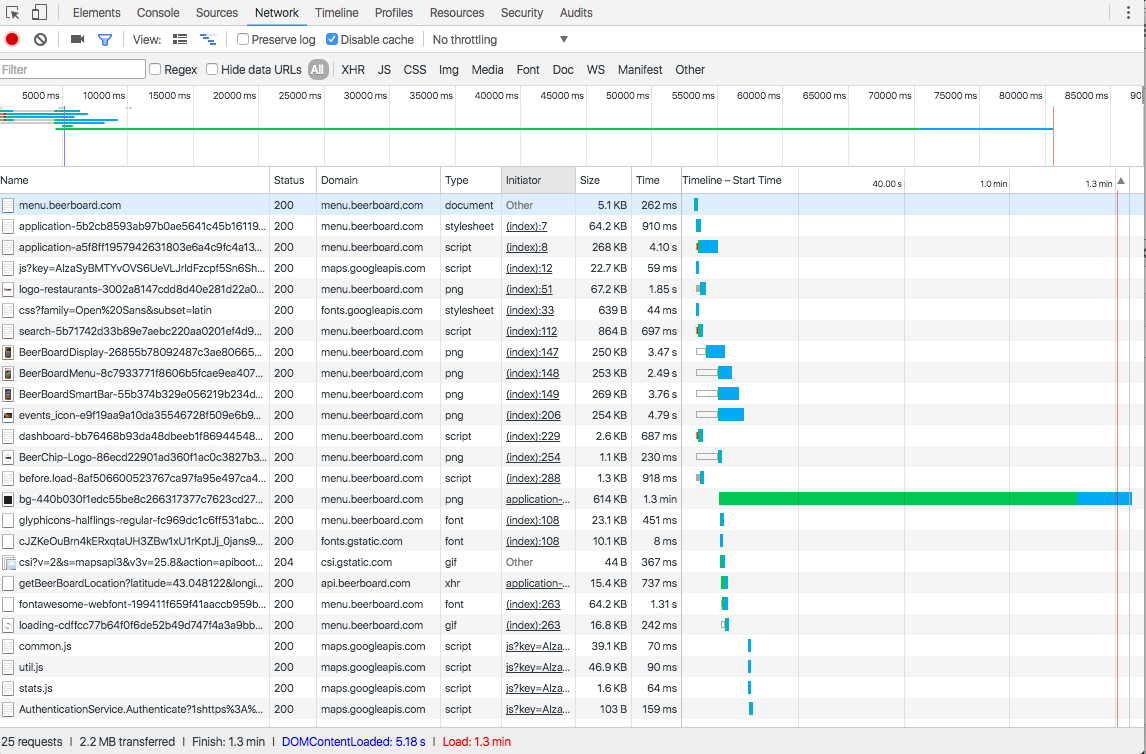
Chrome devtools: Network panel: example
overview
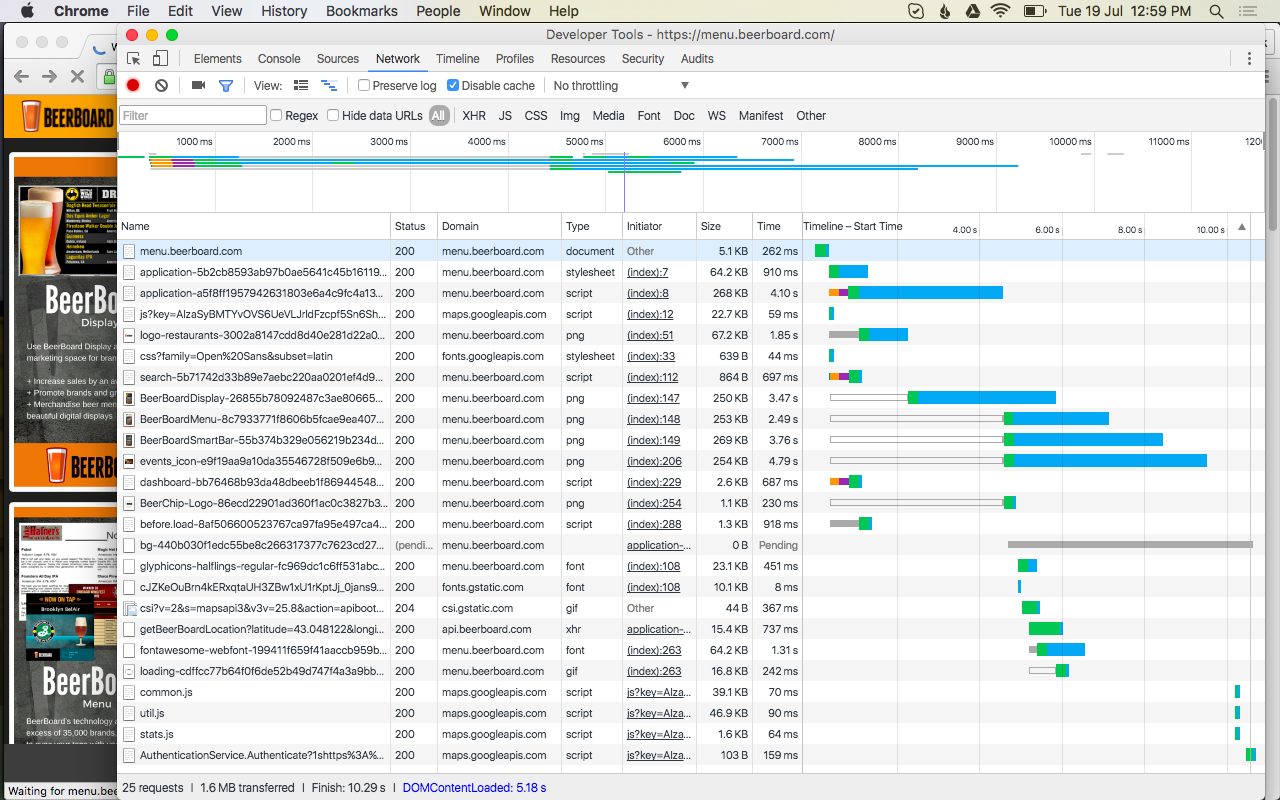
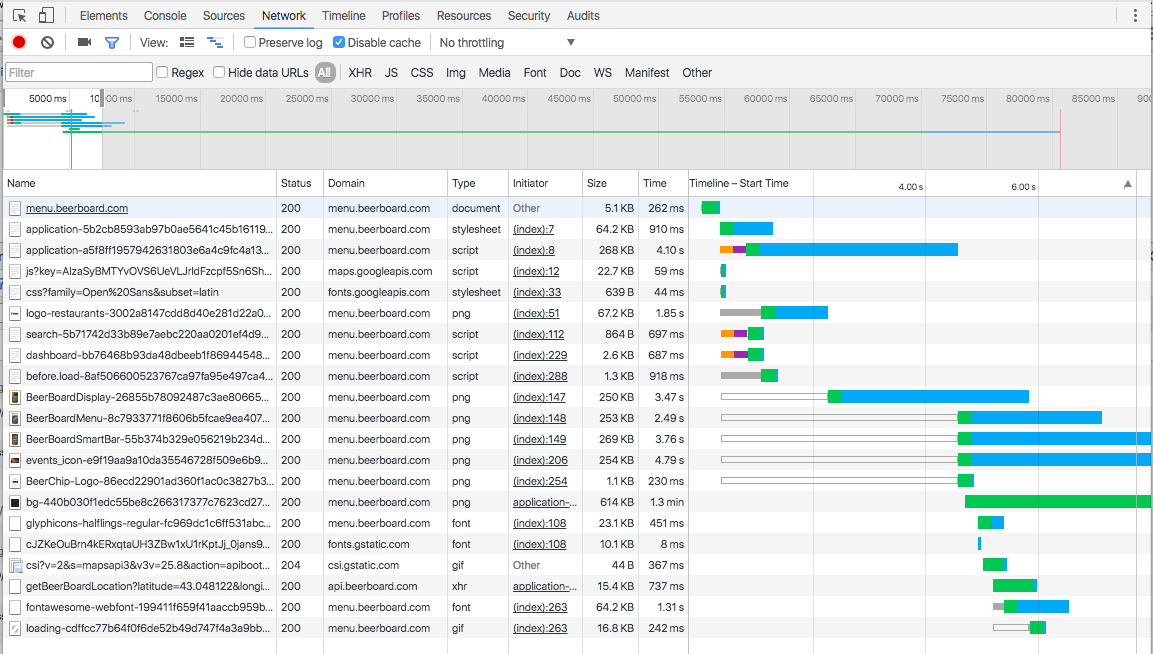
Chrome devtools: Network panel: example2
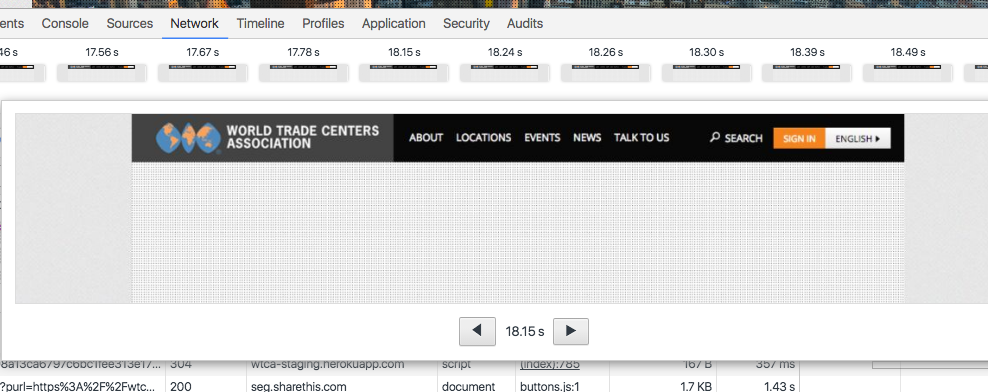
Chrome devtools: Network panel: with filmstrip
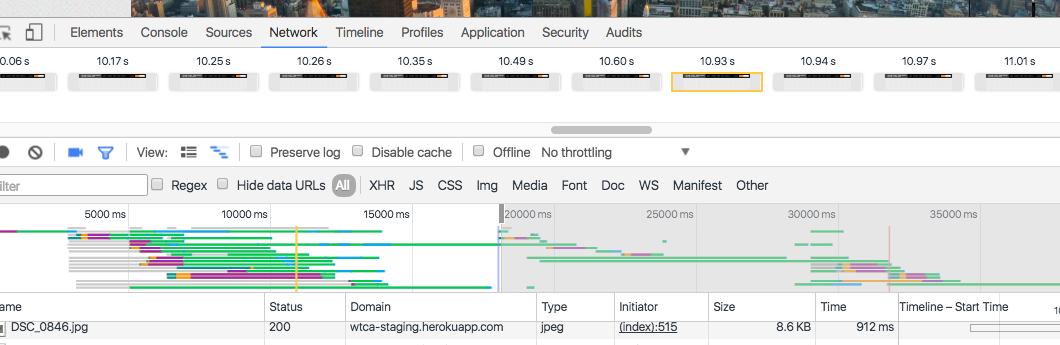
Chrome devtools: Network panel: with filmstrip
Detailed view
Timestamp
(around DomContentLoaded here)
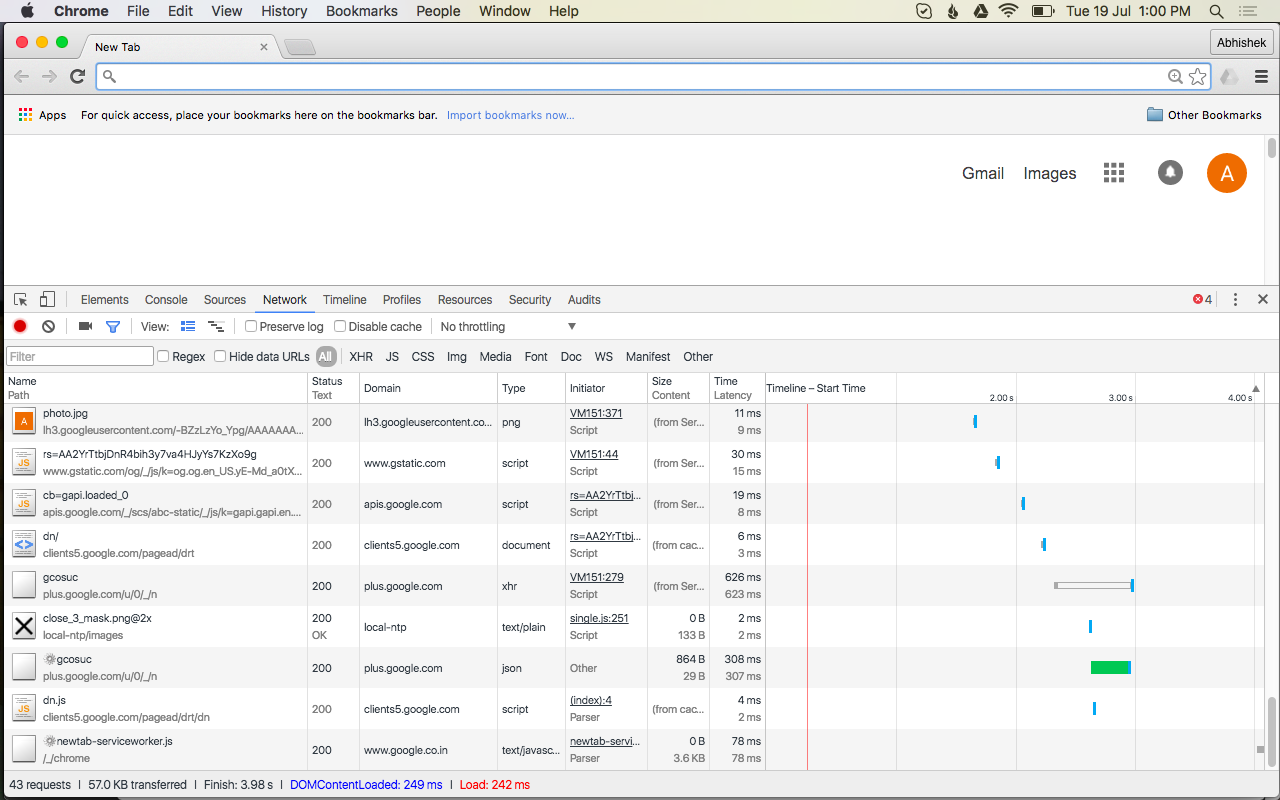
Things to Notice
Chrome devtools: Network panel
- No. of requests (The bottom bar)
- The blue line (DOMContentLoaded)
- The red line (load)
- Size and Time columns
- The document gap
- The timeline
- The statuses (try w/o disabling cache)
Chrome devtools: Network panel: Things to notice
DOMContentLoaded
DOMContentLoaded
Load
Load
Total requests
Statuses
Chrome devtools: Network panel: Things to notice
Zoomed in
The 'gap'
Sizes and Times
Rendering mechanics
Chrome devtools: Network panel
- HTMLs are fetched first (Doc)
- A HTML is parsed from top to bottom
- If a resource is invoked along the way, a request may be fired
- Resource may be Js, Css, Image, Font, Media etc
- For Js, the script is loaded and executed before it HTML parsing can continue (by default)
- Resources can be fetched in parallel
- There is a limit to number of parallel connections (TCP, 6) per domain.
Rendering mechanics : performance impact
Chrome devtools: Network panel
- Too many resources will slow down the page (unless its HTTP-2)
- Javascripts on top of the page can block rest of the page. Not if its on the bottom (application.js)
- Scripts/Css/Images consolidated across one file (asset-precompile, css-sprites) will work faster
- External scripts (Olark, Gmap, Analytics will add to load time)
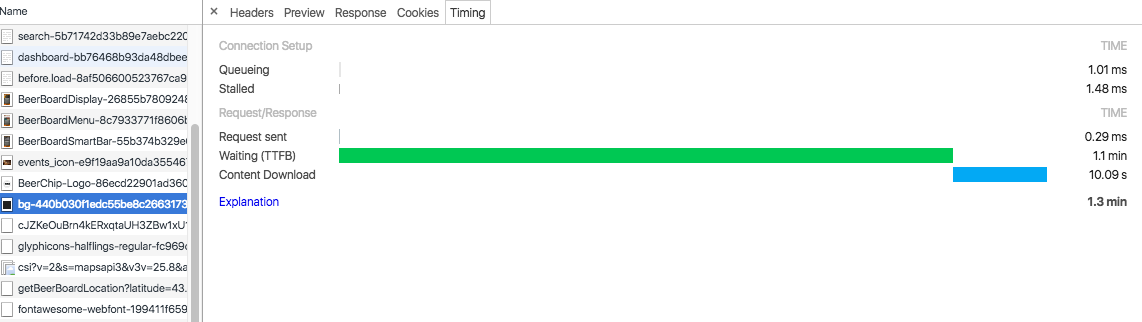
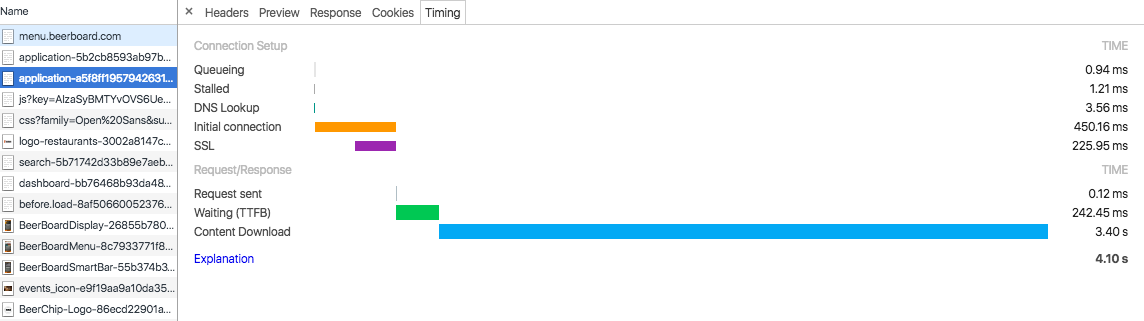
Network timeline details
Chrome devtools: Network panel
-
The anatomy
- Queueing, Stalled
- DNS Lookup, SSL
- Green: TTFB (~ same as server response time)
- Blue: Content Download (~ the size of resource)
-
What to look for?
- Big green - server side needs work
- Big Blue - content size need work
- Unusual value of DNS, SSL
Network timeline
Chrome devtools: Network panel
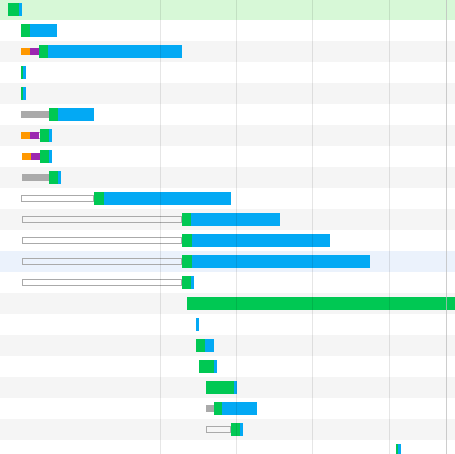
Stalled/Queued
Content download
TTFB
Gaps
Network timeline: TTFB
Chrome devtools: Network panel
More green: Slow network or slow serverside
Network timeline
Chrome devtools: Network panel
More blue: Heavy resource
Chrome devtools: Network panel: Tips
- Multi-select relevant tabs (eg: JS and Xhr)
- Zoom-in using Overview part
- Take screenshots
- Use Throttling to check responsive sites
- Sort by Size and Time to look for heavy resources
Chrome devtools: Network panel: Some Limitations
Limitations
- Network panel does not show javascript execution time
- Exact times are less useful - depend on network/computer
With Rails
Chrome devtools: Network panel
- Place application.js at the bottom if possible
- Use defer/async where possible
- Disallow inline Js
- Localize font css
- Use CDN
- Look for external references from css (esp in libraries)
easier said than done :)
Thanks
@h6165
Abhishek Yadav
ரூபீ ப்ரோக்ராமர்
Co-organizer: Chennai.rb
Chrome devtools-2
By Abhishek Yadav


