Turn on your
data visualization brain
Anita Lillie
December 8, 2015
Who am I?
- Previously: Exploratorium, Practice Fusion, LinkedIn, Nokia, MIT Media Lab, Stanford
- Music, social networks, genetics, healthcare
- Now: Data/UX Lead at Vida Health
I design and develop data interfaces.
How to think about data stories
Where I find inspiration...
The bulk aisle


Wear on doors


Footsteps after a puddle


Tennis


Tans.


Carnegie Mellon fence

Carnegie Mellon fence

Carnegie Mellon fence


Evidence of something interacting with something else
...leaving its mark.
All of these examples are
Why physical metaphors?
- Human cognition is built for these physical things. We see these kinds of patterns easily.
- Thinking in this way helps you choose visual mappings that make sense.
- Making something mimic the real world gives it meaning.
What physical metaphors are used here?
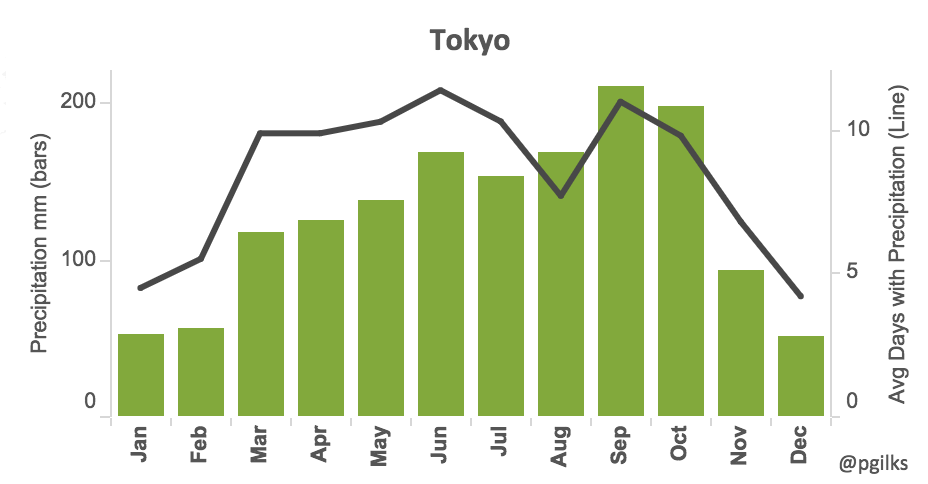
What physical metaphors are used here?
Weather in Austin, Texas
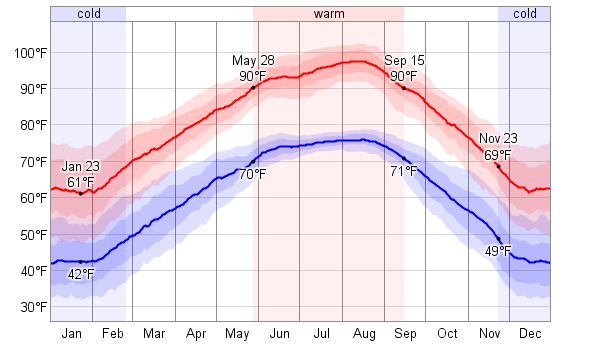
What physical metaphors are used here?

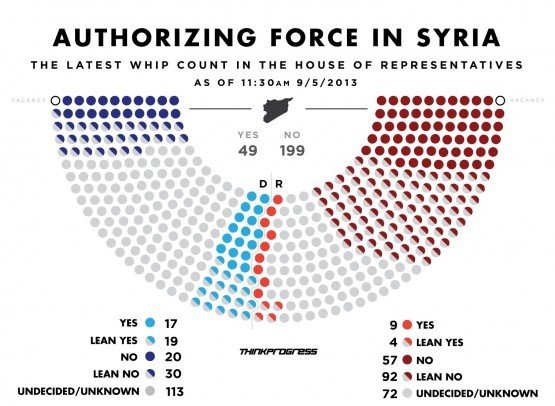
A little more abstract...
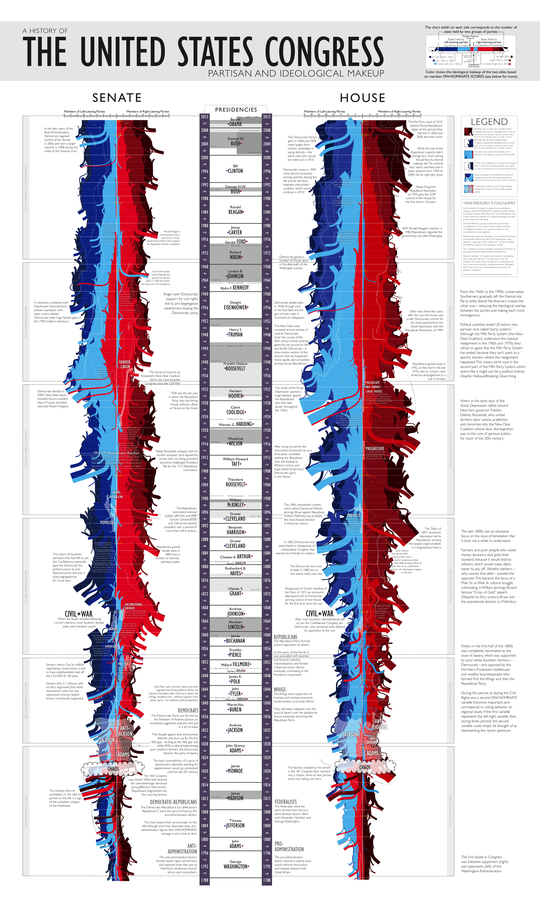
How can we inform our own visualizations?
Keep things in context
When you get data, don't forget where it came from.

Keep things in context
When you get data, don't forget where it came from.


Keep things in context

Transitions are physical, too
Maintain object permanence as much as possible.

Practice
backwards-engineering naturally-occurring visualizations.
- You will ask the right questions.
- You will come up with better data stories.
- You will tell them in a more intuitive way.
@anitalillie
anitalillie@gmail.com
http://www.linkedin.com/in/alillie/

Data vis brain
By Anita Lillie


