Data vis thinking
Anita Lillie
September 24, 2015
Who am I?
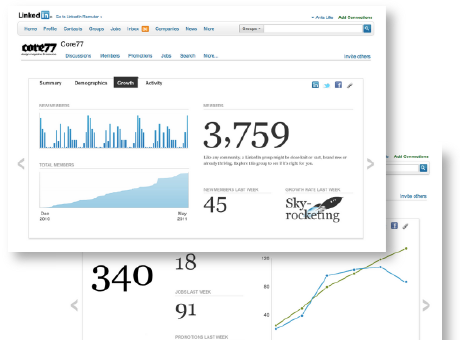
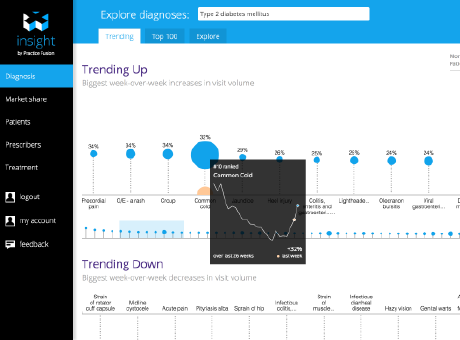
- Previously: Exploratorium, Practice Fusion, LinkedIn, Nokia, MIT Media Lab, Stanford
- Music, social networks, genetics, healthcare
- Now: Data/UX Lead at Vida Health
I design and develop data interfaces.
How to think about data stories
Where I find inspiration...
The bulk aisle


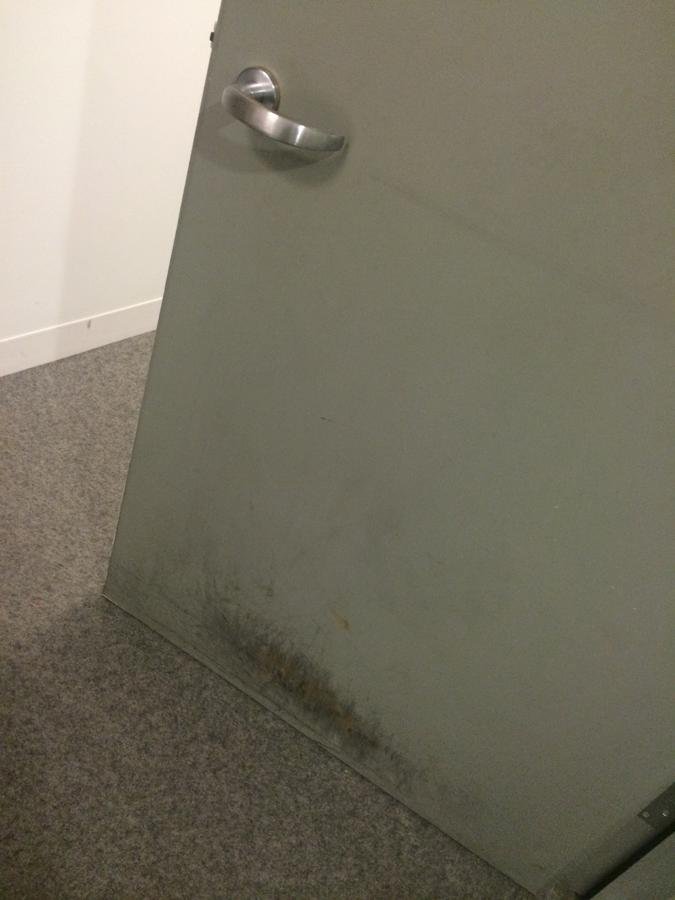
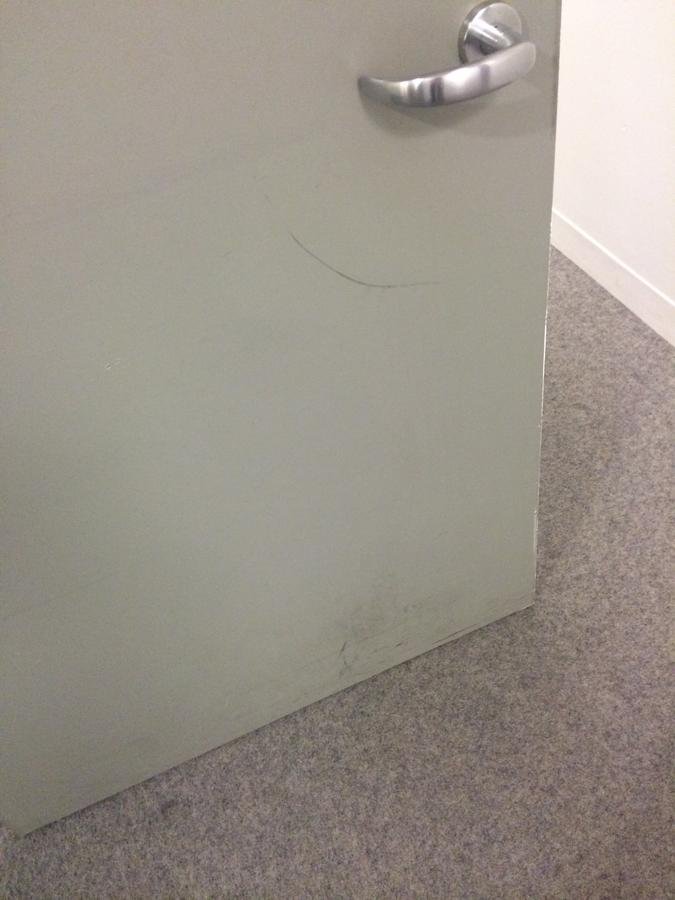
Wear on doors


Footsteps after a puddle


Tennis


Tans.


Carnegie Mellon fence

Carnegie Mellon fence

Carnegie Mellon fence


Evidence of something interacting with something else
...leaving its mark.
All of these examples are
Why physical metaphors?
- Human cognition is built for these physical things. We see these kinds of patterns easily.
- Thinking in this way helps you choose visual mappings that make sense.
- Making something mimic the real world gives it meaning.

Practice
backwards-engineering naturally-occurring visualizations.
- You will ask the right questions.
- You will come up with better data stories.
- You will tell them in a more intuitive way.
@anitalillie
anitalillie@gmail.com
http://www.linkedin.com/in/alillie/
Data
Visualization
Design
Data
Visualization
Design
Data
- What data do you have?
- Can you get more?
- Where is it broken? Missing?
Data...
- How capable is your user with data?
- How about statistics?
- How deep to go?
for your users.
Your story
- What does your data say?
- Test with REAL data EARLY.
Visualization
What visuals make sense for your data?
Do you need a visualization?
Privacy
- Showing too little data
- Adapting to different volumes of data
Iteration
...usually happens in code.
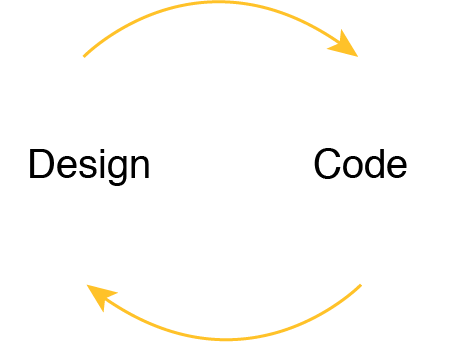
Can your designers write code?
@anitalillie
anitalillie@gmail.com
http://www.linkedin.com/in/alillie/
Data vis thinking
By Anita Lillie


