


Andreas Park PRO
Professor of Finance at UofT
Andreas Park and Jinhua Wang
SAFE Microstructure Conference 2020
August 18, 2020
more marketplaces
new rules
trading technology advances
new players
"higher market quality"
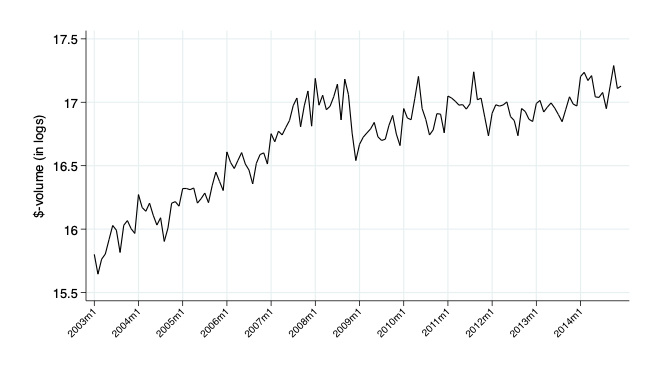
more liquidity (shares to trade)
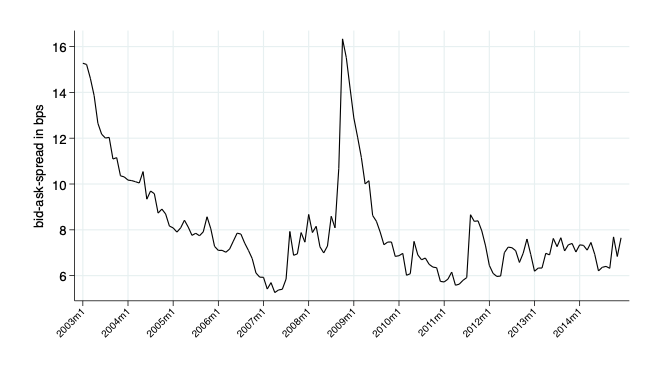
lower transaction costs
higher price efficiency
both long-term and at the margin for rule changes (e.g., automated quotes)
Rosu, Solji, Tham (JFQA 2020)
operate autonomously
show/have no feelings
can implement complex strategies across many markets and assets
\(\Rightarrow\) better/faster/stronger "align" prices?
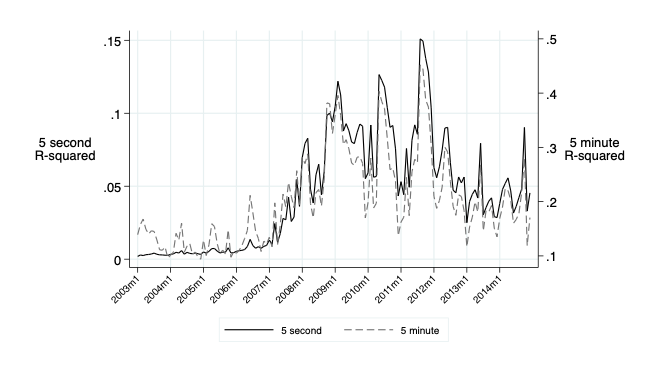
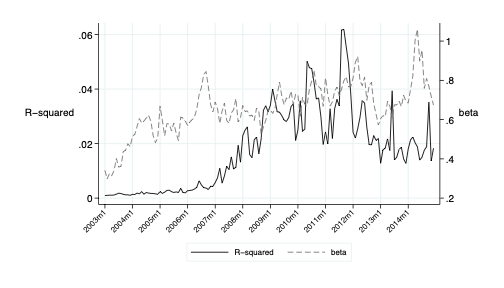
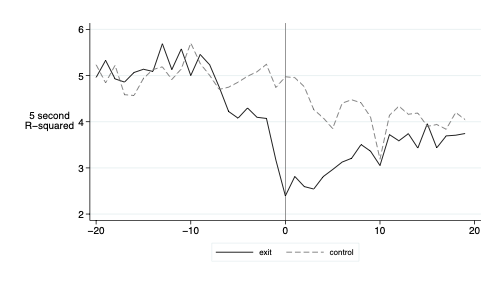
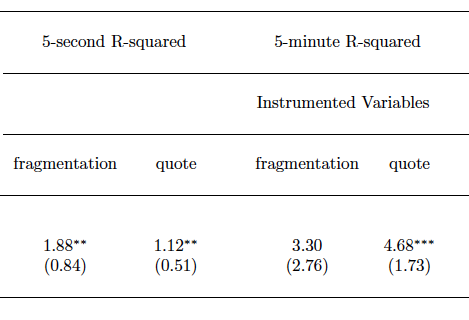
\(R_{it}=\alpha_i+\beta_iR_{mt}+\epsilon_{it} ~~\Rightarrow~~~\mathbb{R}^2\)
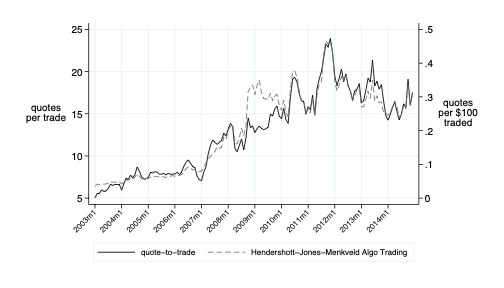
correlation of monthly series: .56
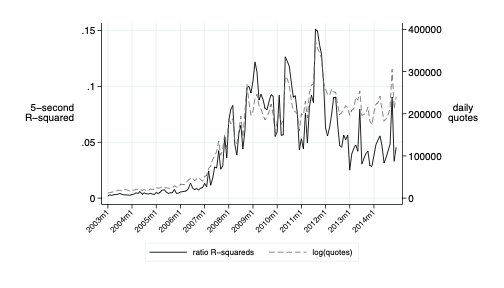
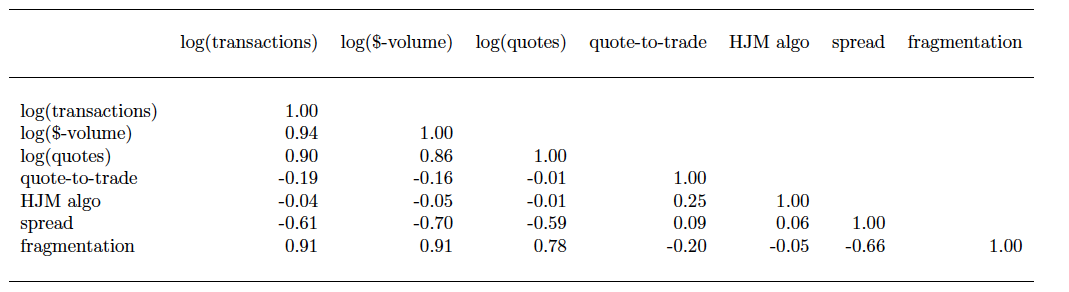
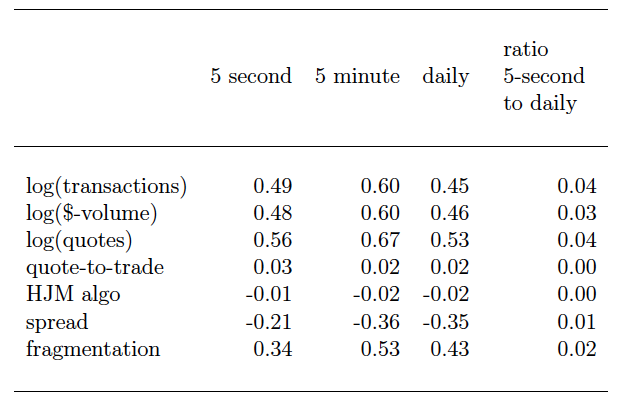
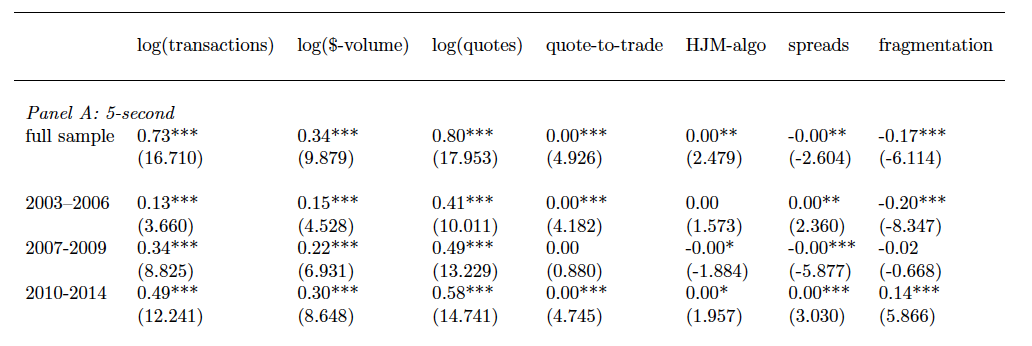
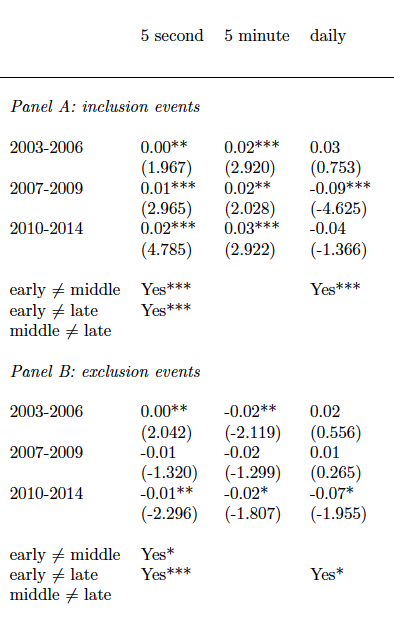
Introduce a "new" (not quite, but not done before) measure to capture impact of bots
Document the substantial change in the measure across time
Develop a machine learning tool to further underline the causal relationship ("instrumental causal random forests")
Show with traditional means that the shift in the measure was caused by bots
\(R_{it}=\alpha_i+\beta_iR_{mt}+\epsilon_{it} .\)
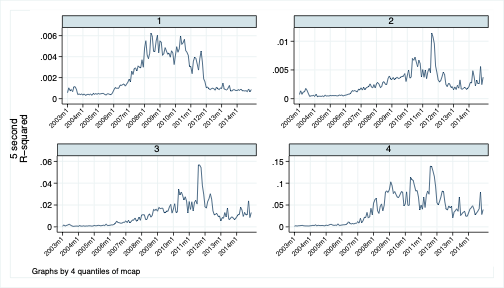
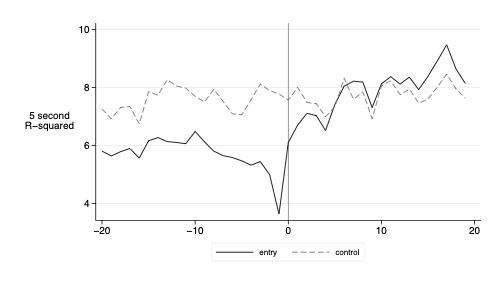
Still: the increase in R-squared over time is persistent and robust across all kinds of subsamples and splits of the data
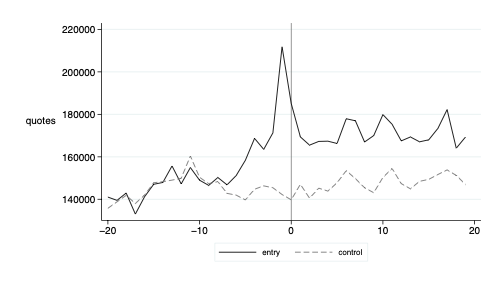
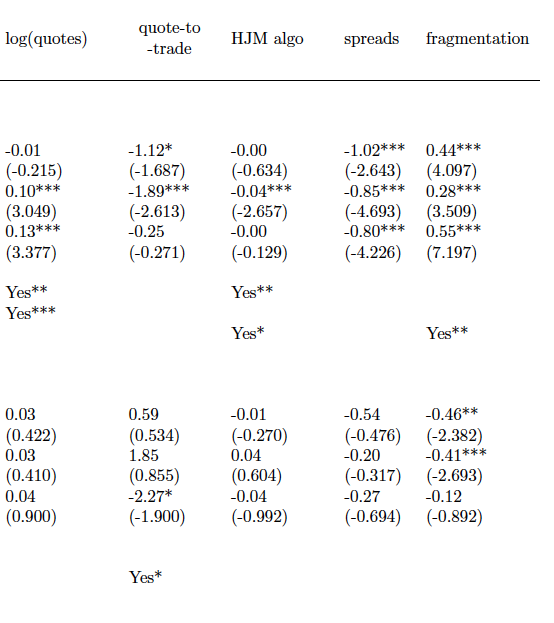
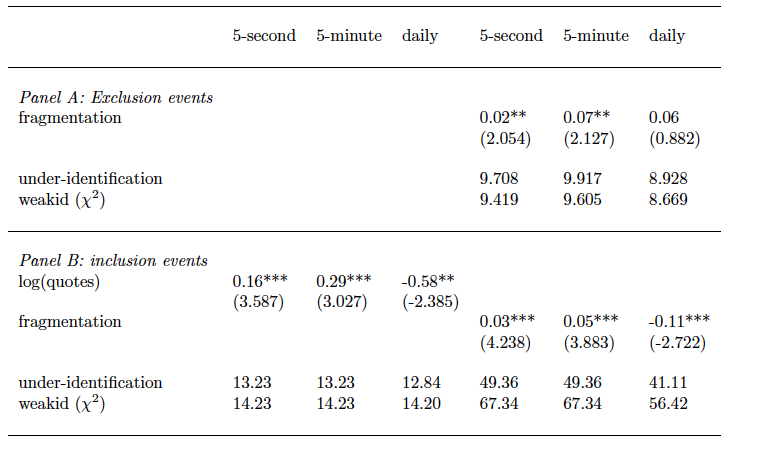
Entry
Exit
effect strongest later in sample
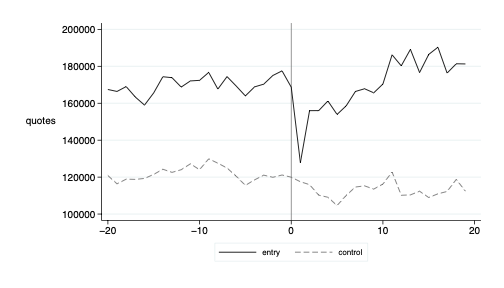
Entry
Exit
effect strongest later in sample
statistically not significant
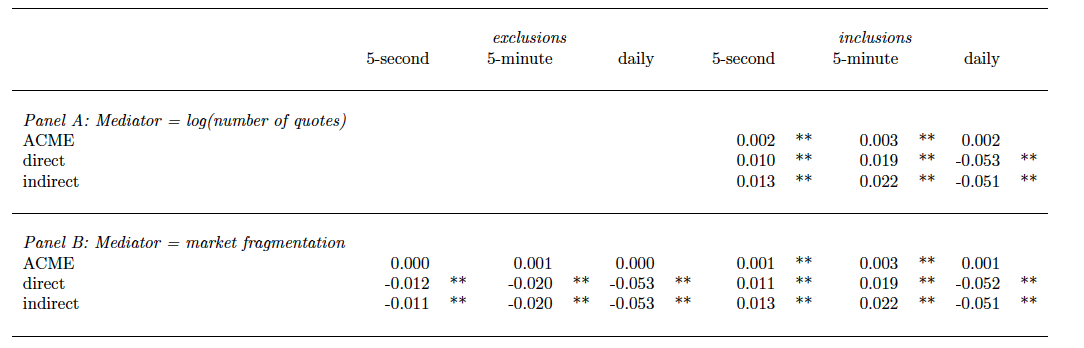
Idea: Mediation analysis allows both a direct and an indirect effect
*ACME=Average Causal Mediation Effect (the mediated effect)
*
*
Linear Model relies on correctness of functional form specification.
Linear causal effect models can only estimate average treatment effect at aggregate level & ignores heterogeneity
Preserves treatment effect heterogeneity
NB: methods and tools developed here are all available on Jinhua's GitHub
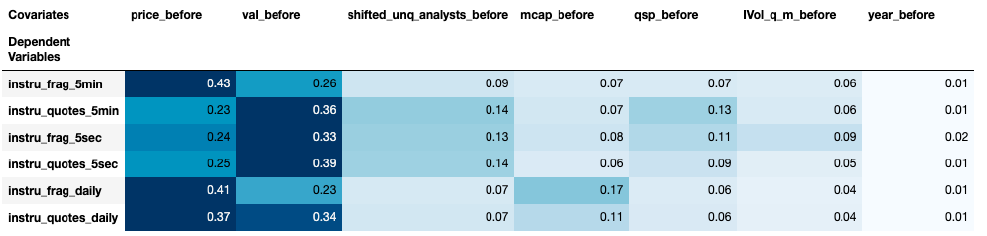
The numbers in the table are the percentage splits on a particular covariate. The higher the percentage, the deeper the gradient in the cell, and the more important the variable is in the causal forest.
Introduce a "new" (not quite, but not done before) measure to capture impact of bots
Document the substantial change in the measure across time
Develop a machine learning tool to further underline the causal relationship ("instrumental causal random forests")
Show with traditional means that the shift in the measure was caused by bots
@financeUTM
andreas.park@rotman.utoronto.ca
slides.com/ap248
sites.google.com/site/parkandreas/
youtube.com/user/andreaspark2812/
identified a shift in "explainability of intra-day market model"
linked this shift to bot trading, with indications of causality from index inclusions
explainability seems a prerequisite for any "real" asset pricing model
still open questions and many avenues for possible future research
Hendershott, Jones, Menkveld (JF 2011)
correlation of monthly series: .56
By Andreas Park


