

Gleb Bahmutov PRO
JavaScript ninja, image processing expert, software quality fanatic
Dr. Gleb Bahmutov PhD
Kensho, Boston / NYC
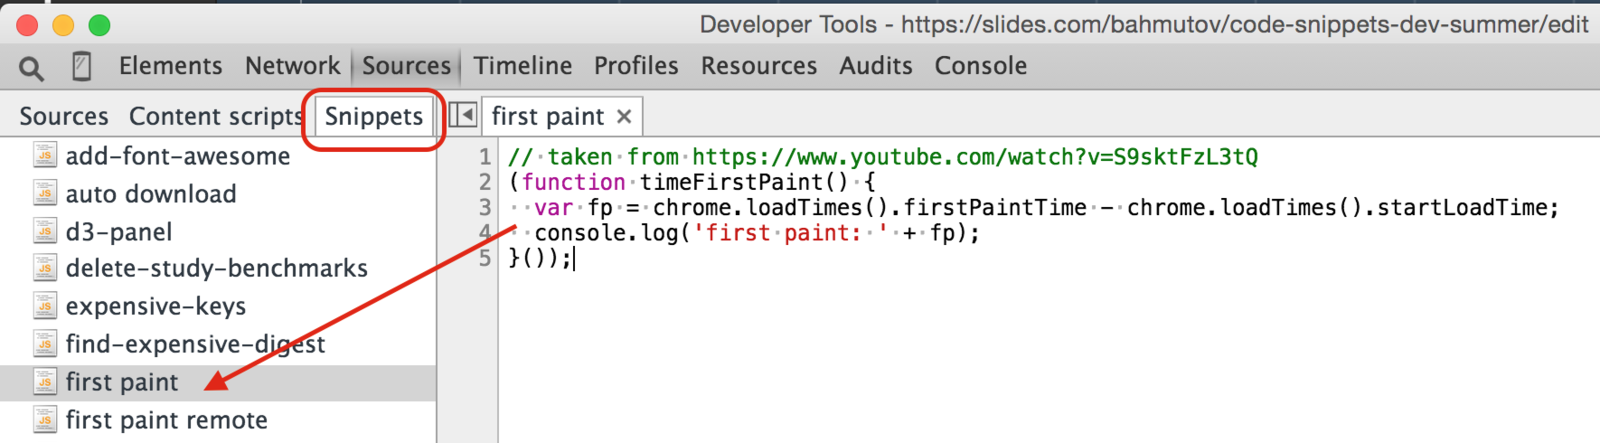
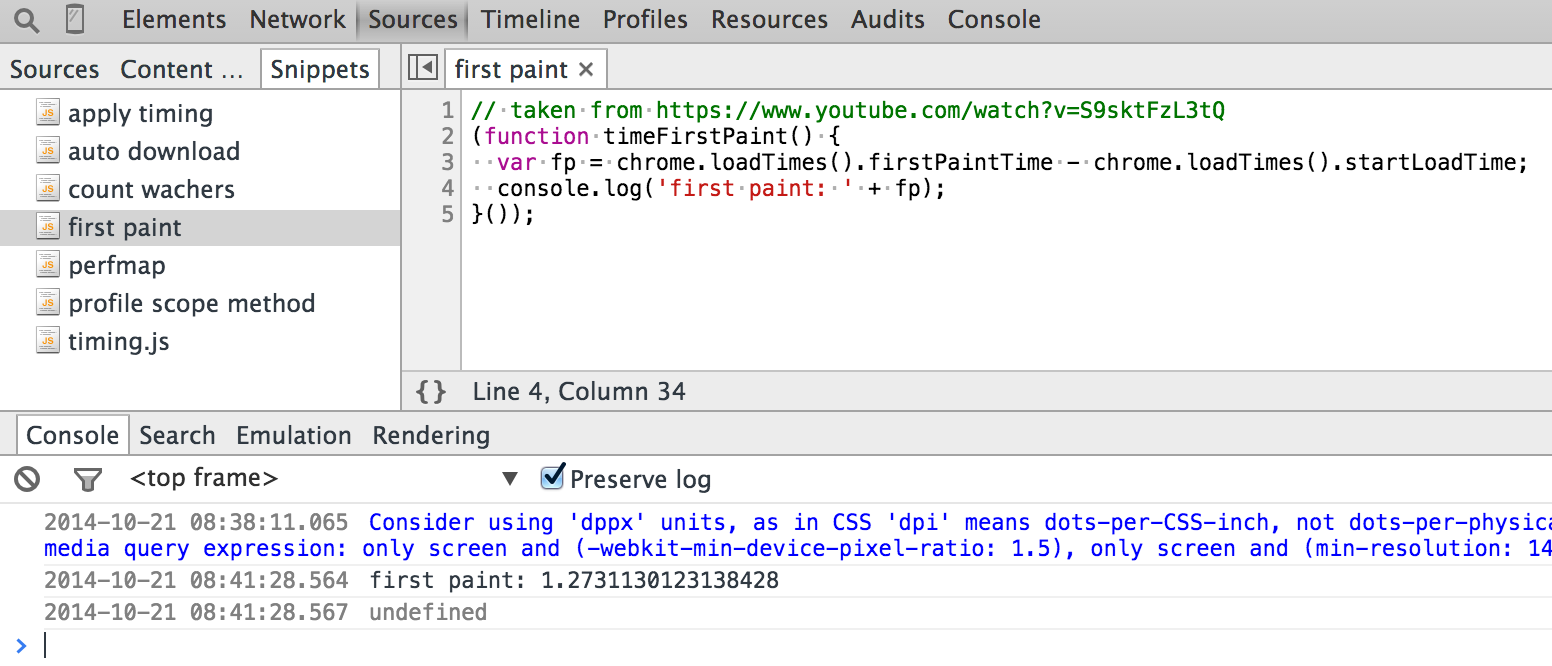
(function timeFirstPaint() {
  var fp = chrome.loadTimes().firstPaintTime -
    chrome.loadTimes().startLoadTime;
  console.log('first paint: ' + fp);
}());
Copy / paste this code into the Chrome browser console
<h1>
    <i class="fa fa-flag"></i> Include missing styles
    <i class="fa fa-heart"></i>
</h1>
(function addFontAwesomeCssLink() {
var ss = document.createElement('link');
ss.type = 'text/css';
ss.rel = 'stylesheet';
ss.href = '//maxcdn.bootstrapcdn.com/font-awesome/4.3.0/css/font-awesome.min.css';
document.getElementsByTagName("head")[0].appendChild(ss);
}());// "app" code
function add(a, b) {
return a + b;
}
// "user" code
function onClick() {
  console.log(add(2, 3));
}
// click!
// 5
within 0.1 second ?
// "app" code
function add(a, b) {
  var started = Number(new Date());
  var sum = a + b;
  var finished = Number(new Date());
  console.log('add took',
    finished - started, 'ms');
  return sum;
}
// "user" code
function onClick() {
  console.log(add(2, 3));
}
// click!
// add took 10ms
// 5// "app" code
function add(a, b) {
return a + b;
}
// "user" code
function onClick() {
  var started = Number(new Date());
  console.log(add(2, 3));
  var finished = Number(new Date());
  console.log('add took',
    finished - started, 'ms');
}
// click!
// 5
// add took 10ms// "app" code
function add(a, b) {
return a + b;
}
// "user" code
function onClick() {
  console.log(add(2, 3));
}
// code snippet
function profileAdd() {
  var _add = add;
  add = function profiledAdd(a, b) {
    var started = Number(new Date());
    var sum = _add(a, b);
    var finished = Number(new Date());
    console.log('add took', finished - started, 'ms');
    return sum;
  };
}// "app" code
function add(a, b) {
return a + b;
}
// "user" code
function onClick() {
  var todo = add.bind(null, 2, 3);
  console.log(todo();
}
// code snippet
function profileAdd() {
  var _add = add;
  add = function profiledAdd(a, b) {
    ...
  };
}// "app" code
function add(a, b) {
return a + b;
}
var calc = {
add: add
};
// "user code"
function click(calc) {
console.log(calc.add(2, 3));
}
// code snippet
var _add = calc.add;
calc.add = function () {
console.log('adding', arguments);
return _add.apply(calc, arguments);
}
// adding { '0': 2, '1': 3 }
// 5var selector = 'load';
var methodName = 'load';
var el = angular.element(document.getElementById(selector));
var scope = el.scope() || el.isolateScope();
var fn = scope[methodName];
var $timeout = el.injector().get('$timeout');
var $q = el.injector().get('$q');
scope[methodName] = function () {
console.profile(name);
console.time(name);
// method can return a value or a promise
var returned = fn();
$q.when(returned).finally(function finishedMethod() {
console.timeStamp('finished', methodName);
$timeout(function afterDOMUpdate() {
console.timeStamp('dom updated after', methodName);
console.timeEnd(name);
console.profileEnd();
scope[methodName] = fn;
}, 0);
});
};// tough cases like jQuery plugins
new Photostack(document.getElementById('photostack-3');
function profile(proto, methodName) {
var originalMethod = proto[methodName];
function restoreMethod() {
console.timeEnd(methodName);
proto[methodName] = originalMethod;
}
proto[methodName] = function () {
console.time(methodName);
originalMethod.apply(this, arguments);
restoreMethod();
};
}
// where we want to profile Photostack.prototype._rotate
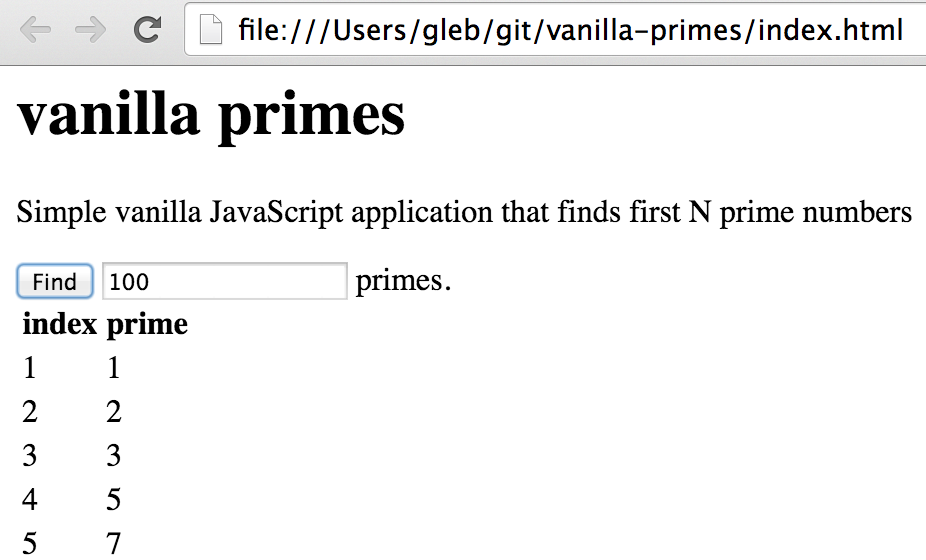
profile(Photostack.prototype, '_rotate');example: github.com/bahmutov/vanilla-primes
arguments = arguments || []
delete foo.bar
function add(a, b) {
    return a + b;
}
add(2, 3);
add('foo', 'bar');iojs 1.8.1 has more than 300 switches. A lot related to performance tuning
iojs --v8-options
var worker = new Worker('worker.js');
function renderPrimes(primes) {
    var html = primes.map(primeToRow).join('\n');
    document.querySelector('#results').innerHTML = html;
}
worker.onmessage = function (e) {
    console.log('worker has finished');
    renderPrimes(e.data);
};
var primesApp = {
    worker: worker,
    findFirstPrimes: function (n) {
        console.log('finding first', n, 'primes');
        worker.postMessage({ cmd: 'primes', n: n });
    }
};
document.querySelector('#find').addEventListener('click', function () {
    var n = Number(document.querySelector('#n').value);
    primesApp.findFirstPrimes(n);
});var m1 = obj1[methodName1];
var m2 = obj2[methodName2];
obj1[methodName1] = function () {
console.profile('separate');
console.time('separate');
m1.apply(obj1, arguments);
};
obj2[methodName2] = function () {
console.timeEnd('separate');
console.profileEnd('separate');
m2.apply(obj2, arguments);
};
// call with
// obj1 = primesApp.worker, methodName1 = 'postMessage'
// obj2 = primesApp.worker, methodName2 = 'onmessage'
// "user" code
webWorker.computePrimes(10000)
    .then(render);
// can be wrapped easily in a code snippet
var started = Number(new Date());
var result = webWorker.computePrimes(1000);
if (isPromise(result)) {
  return result.tap(function () {
    var finished = Number(new Date());
  });
} else {
  ... // time normally
}Weird behavior when trying to start from a code snippet (or browser console)
MUST watch: "DevTools: State of the Union" by @addyosmani
This presentation at
slides.com/bahmutov/code-snippets-dev-summer
By Gleb Bahmutov
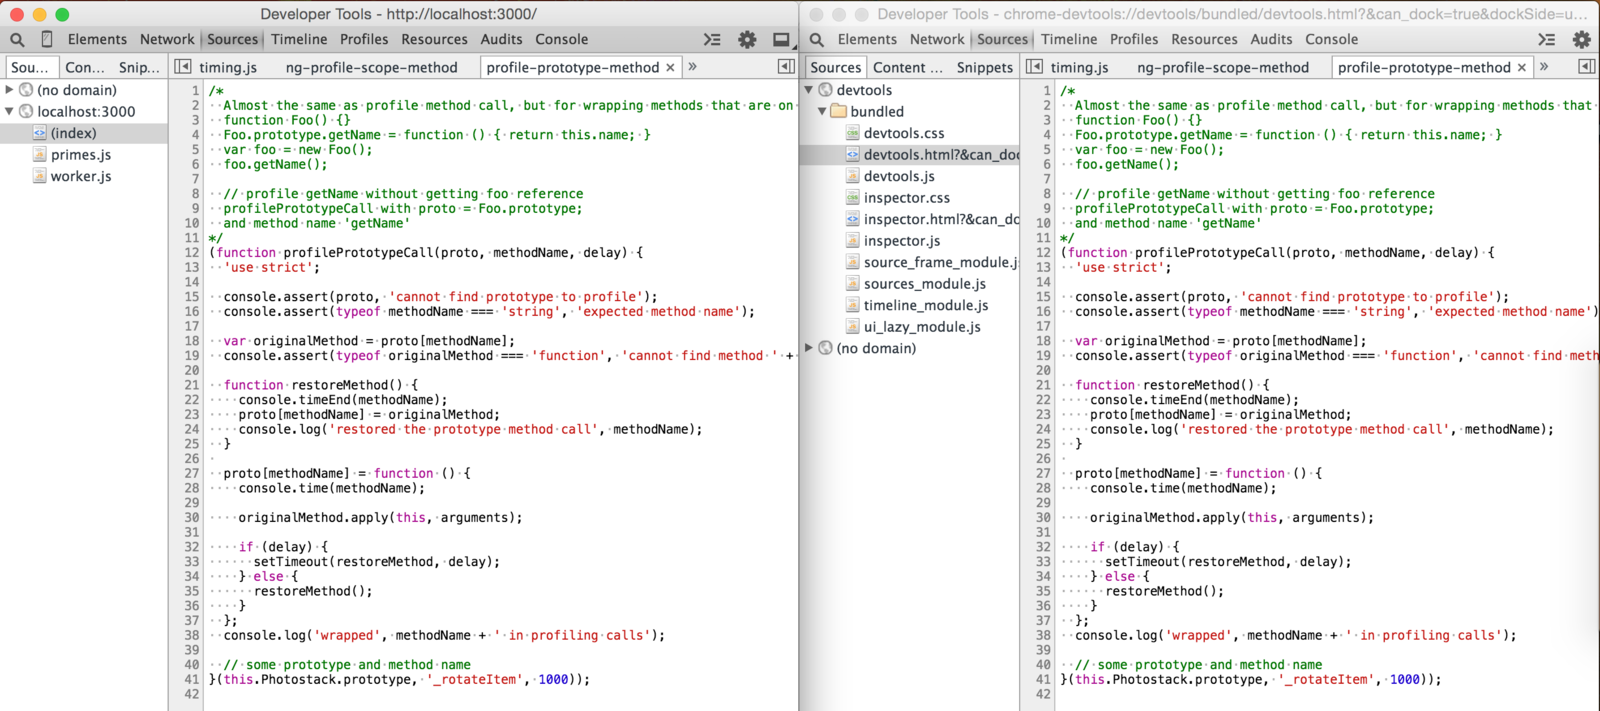
Chrome DevTools code snippets became my favorite tool when investigating performance bottlenecks in web applications. A JavaScript fragment can be stored as a named snippet in the "Sources" DevTools panel and executed in the current page's context, just as if it were a code executed in the browser's console.


