Mathematical models to quantify and optimize HIV intervention in British Columbia
CMS Meeting Hamilton
2014-12-07
UBC: Bernhard Konrad, Daniel Coombs
BCCDC: Warren Michelow, Mark Gilbert

General background
HIV in Canada
Canada
- 70,000 HIV+ (2009)
- 2,500 new diagnosis every year
- one new infection every 3h
BC
- 400 new diagnosis every year
- 3500 unaware of infection (25%)
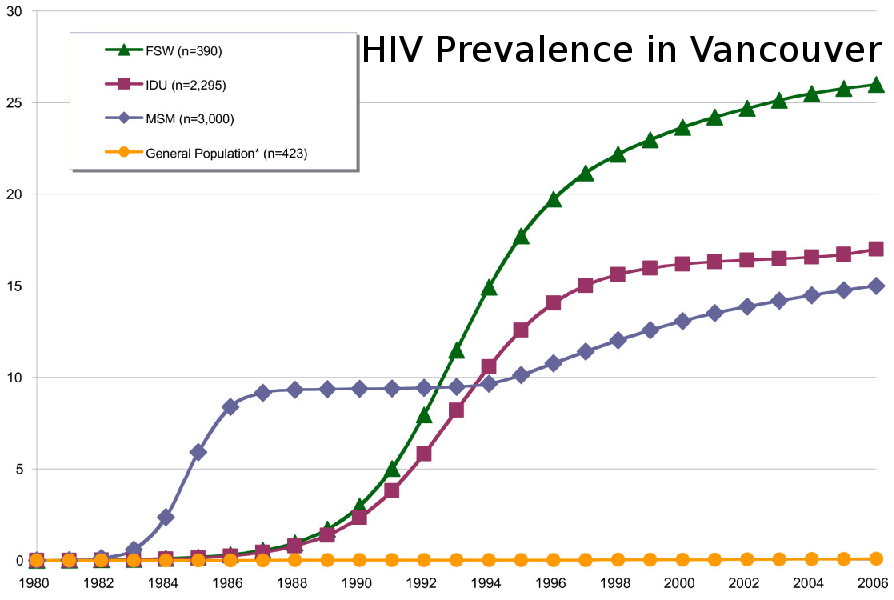
Vancouver
- 6000 HIV+ (1.2%)
- 250 new diagnosis every year
- ~50% MSM, ~25% IDU, ~25% HET
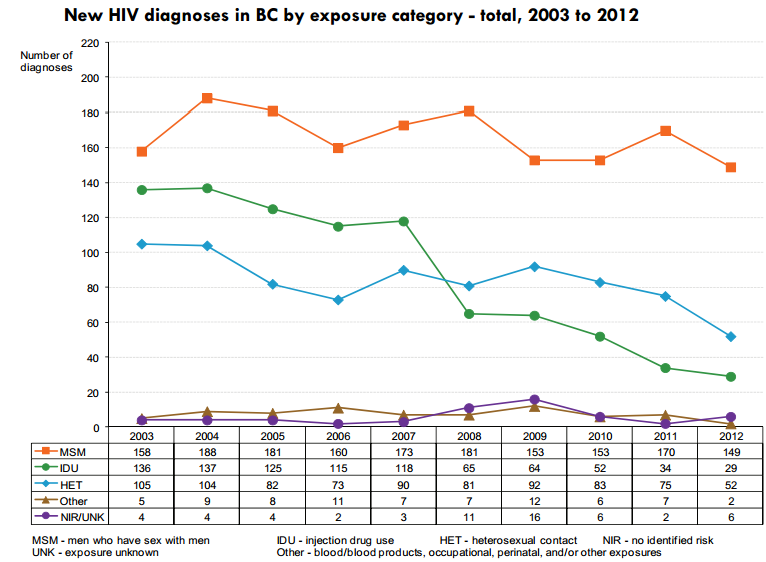
Goal: Understand the non-improvement for MSM
Modelling Epidemics

\frac{dS}{dt} = -\beta SI/N
dtdS=−βSI/N
\frac{dI}{dt} = \beta SI/N - \gamma I
dtdI=βSI/N−γI
\frac{dR}{dt} = \gamma I
dtdR=γI
Find parameters for Vancouver MSM population
Infection rate = (Rate of contact) x (Per-contact risk)
Removal rate
- Death and anti-retroviral treatment
- Sexually active
- Stable partnerships
- Number of sexual contact
- Network of contacts
- Type of exposure
- Serosorting
Study 1: TasP
Treatment as prevention:
- Treatment for personal and population benefits
- Infectiousness correlates with viral load
- Treatment decreases VL => less infectious

Study 1: TasP
Study 1: TasP
- BC Centre for Excellence in HIV/AIDS
- Vancouver resource rich
- Free treatment by universally accessible health care
- centralized laboratory monitoring
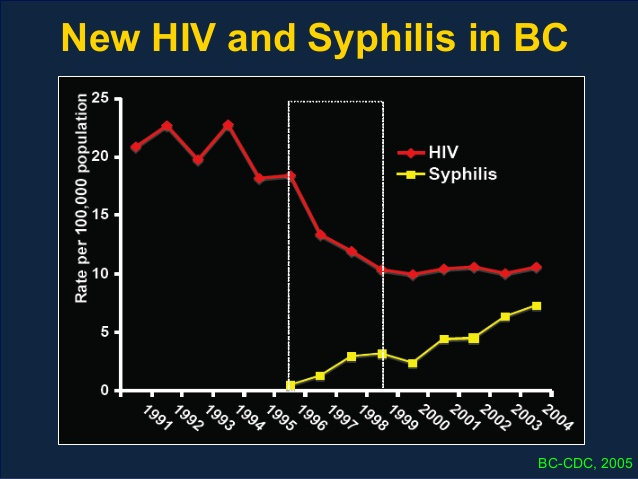
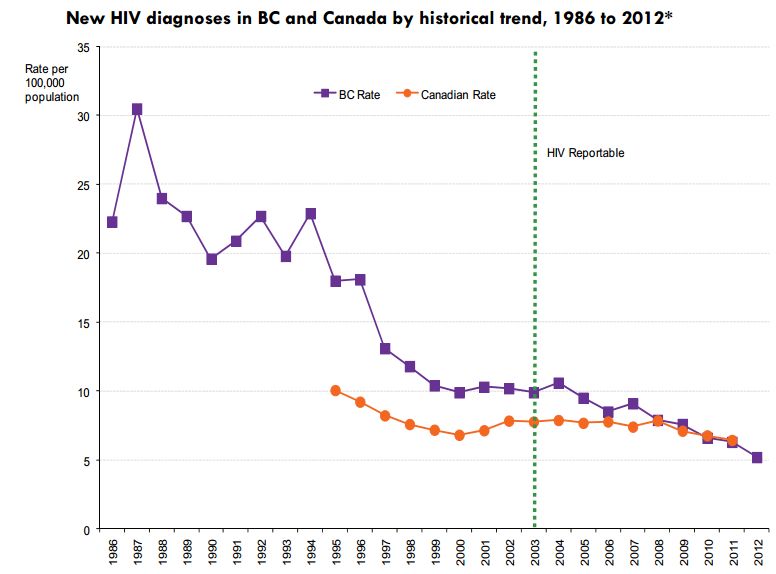
- For every 1% increase in number of individuals on suppressed HAART, HIV incidence rate decreased by 1%
- Declining trend in new HIV diagnosis in BC unique in Canada
- TasP favourable cost-benefit ratio
Study 1: TasP
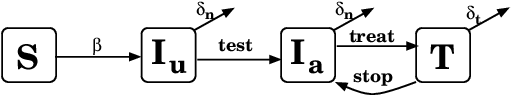
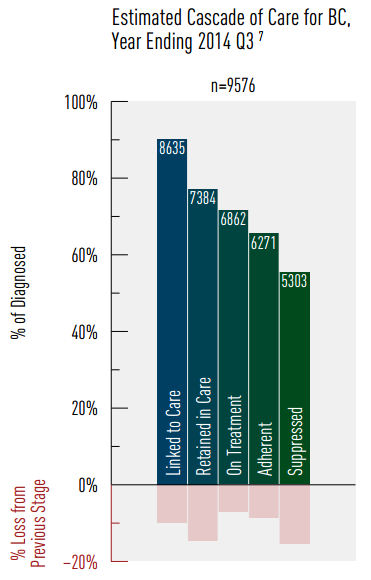
Choose parameters to fit Vancouver MSM:
- Infection rate <--> Prevalence
- Testing rate <--> HIV awareness
- Treatment rate <--> Treatment percentage
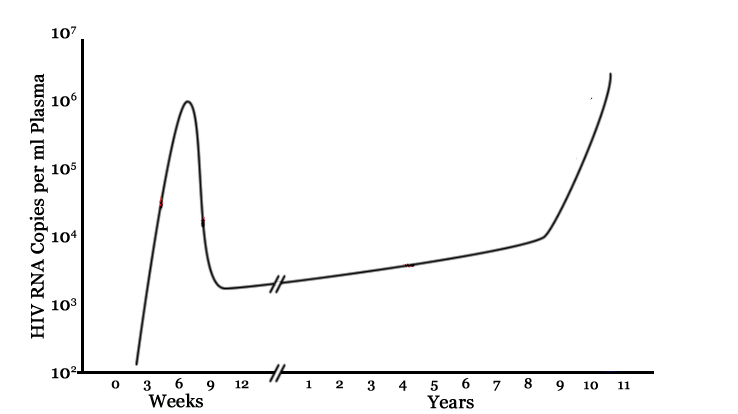
Study 2: Acute infection
- Infectiousness correlates with viral load
- Viral load very high shortly after exposure
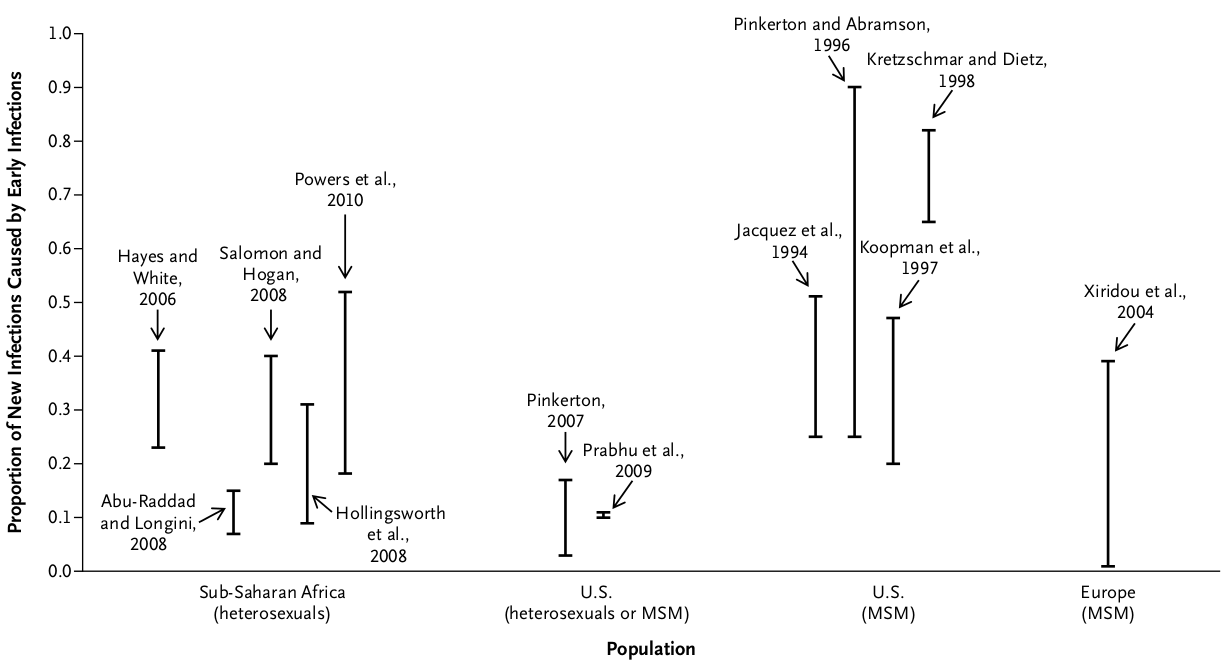
- How much of the epidemic is driven by acute infections?
Study 2: Acute infection
- Pooled NAAT tests at HIV testing clinics
- Recruitment between April 2009 and June 2012
- Very difficult to catch early infections:
- 13 participants with acute infection
- 12 with early infection
- Questionnaires on sexual activity, number of partners, use of condoms, etc.
Goal: Find acute/early infections in Vancouver
Study 2: Acute infection
Findings:
- 64% were not expecting a positive result
- Likelihood of "risky sex" decreased for first 3 months after diagnosis, remained low during follow-up, but increased over time
- All participants eventually resumed sexual activity, 92% resumed anal sex
- The 25 cases would not have been detected otherwise, hence prevented secondary cases.
Study 2: Acute infection
Study 2: Acute infection
Choose parameters to fit Vancouver MSM:
- # acute infections found
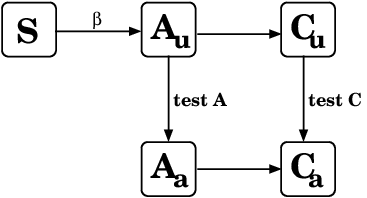
Study 2: Acute infection

Choose parameters to fit Vancouver MSM:
- Effect of recent diagnosis
- Difficult to find early infections
- Are there any differences between the infected and non-infected group?
Study 3: Negative cohort
Why study HIV negative cohort?
- 166 HIV- MSM (tested at health clinic in Vancouver)
- 1 year follow-up with 4 questionnaires
- Questions similar to positive cohort
- 33 men reporting risky sex in the past 6 months, those invited to interview.
Study design
Study 3: Negative cohort
- Have you had a HIV test in the LAST 5 months?
- How many men have you had anal sex with in the LAST 3 months?
- How often do you use condoms when you are the top when having anal sex?
Example questions:
Findings: ??? - in progress
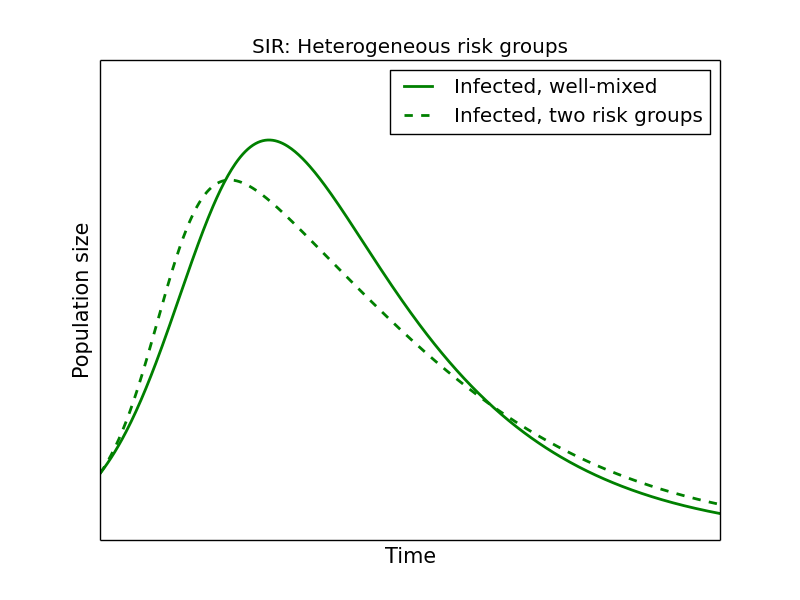
- Is the at-risk population homogeneous?
- If not,
- how much do they differ?
- how stable are the compartments?
Study 3: Negative cohort
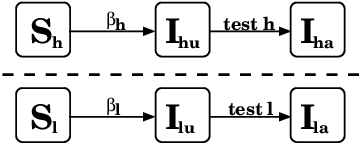
Distinguish between high-risk, low-risk
Different infection rate and testing behaviour
Study 3: Negative cohort
(How often) Do people switch between groups?
Current and Future Work
- Learn from HIV negative cohort
- Characterize, quantify risk groups
- How stable are risk groups?
- Combine study results into single model(s)
- Are ODEs the best choice?
- Exponential rates
- Relatively small populations
- Predict outcome of interventions
Thank you!
Mathematical models to quantify and optimize HIV intervention in British Columbia
By Bernhard Konrad