pharmdout
Classifying and predicting active pharmaceutical ingredient shortages
Bernhard Konrad
Insight Data Science


Distributor
Manufacturer
Pharmacies, Hospitals

- Partner is big pharmaceutical distributor
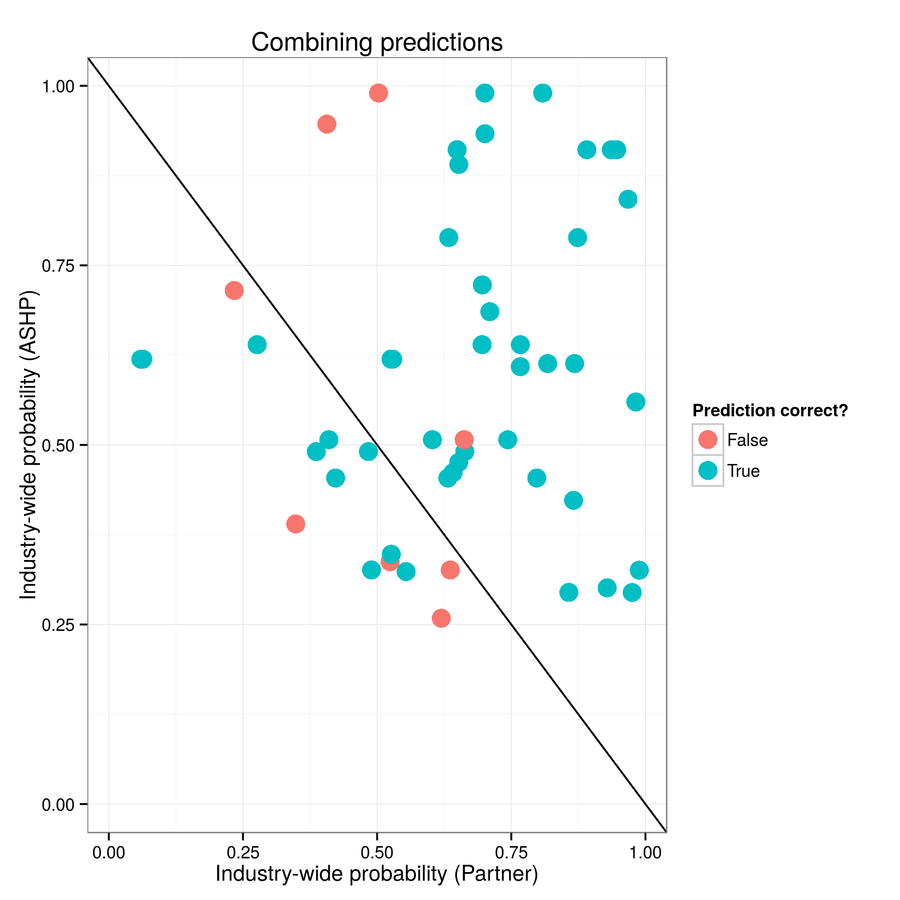
The classification problem
Distributor
Manufacturer
Pharmacies, Hospitals
The classification problem


- Manufacturer-specific: Find alternative supplier or pay fee.
- Industry-wide: Convince client that it's not your fault.
?
/
$
$
Predicting upcoming shortages
Time-series analysis looking for leading indicators
Past
Future
?
Today
Will be short in the near future?
Time-series analysis looking for leading indicators
\text{Prob}(\ \ \ \ (t+\tau)\,|\,\ \ \ \ (t))
Prob( (t+τ)∣ (t))
- Use Pearson's correlation to find best indicators.
- Rank drugs by likelihood of upcoming shortage.
Past
Future
2 weeks
2 weeks
2 weeks
Today
Predicting upcoming shortages
Impact:
Potential in savings and increase in revenue:
+$4.5M
3 correctly predicted new shortages in January 2015 watch list
(0.8 expected matches if watch list is chosen randomly)
Predicting upcoming shortages
Verification:
Action:
Check internal supply, demand and price
Bernhard Konrad
Mathematical Biology


Details Classification Problem
Data from Distributor
(historic)
Data from ASHP
(current)
classes balanced
classes unbalanced
#51
#409
#594
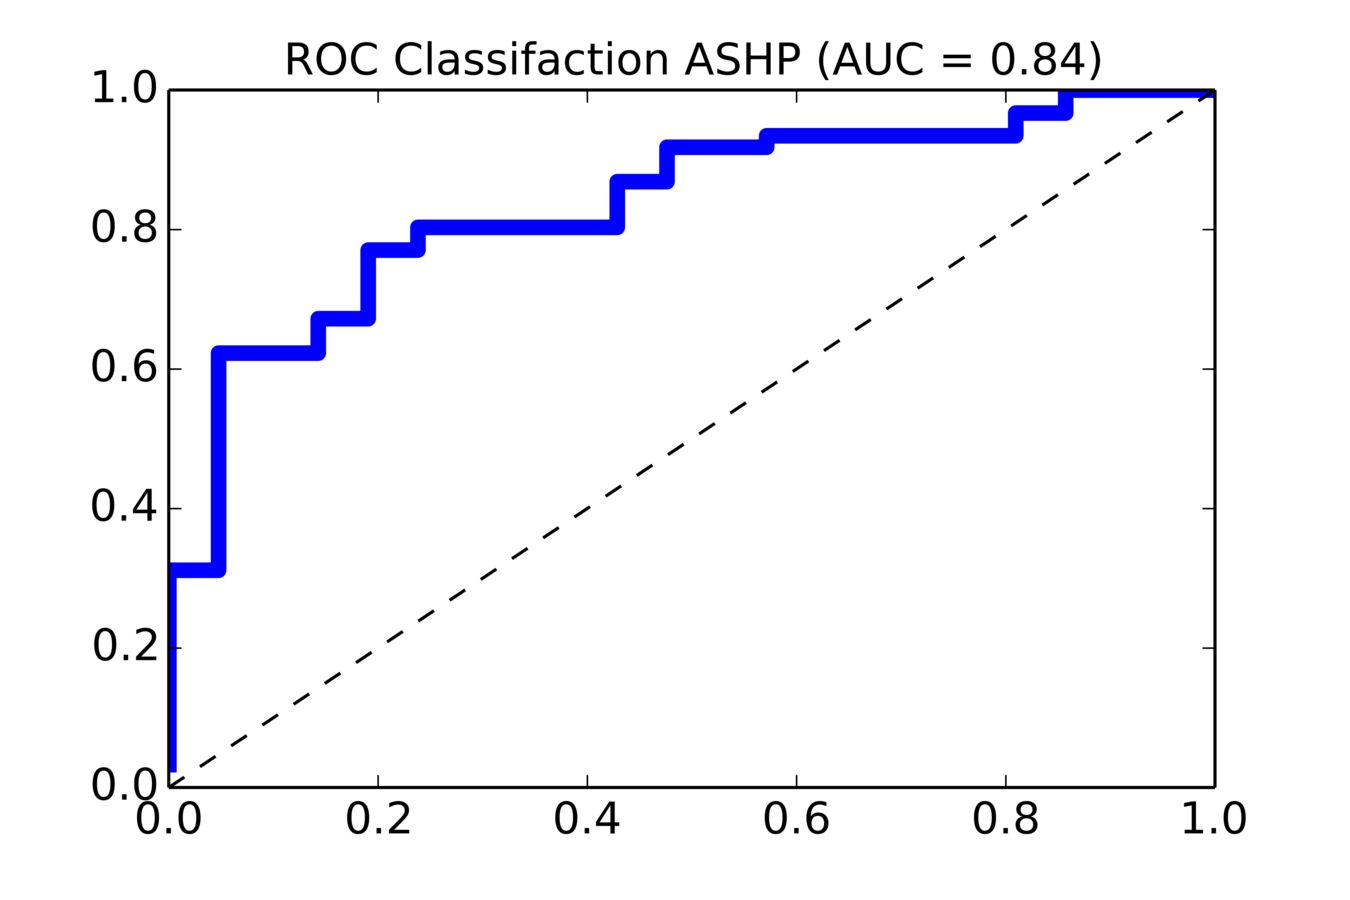
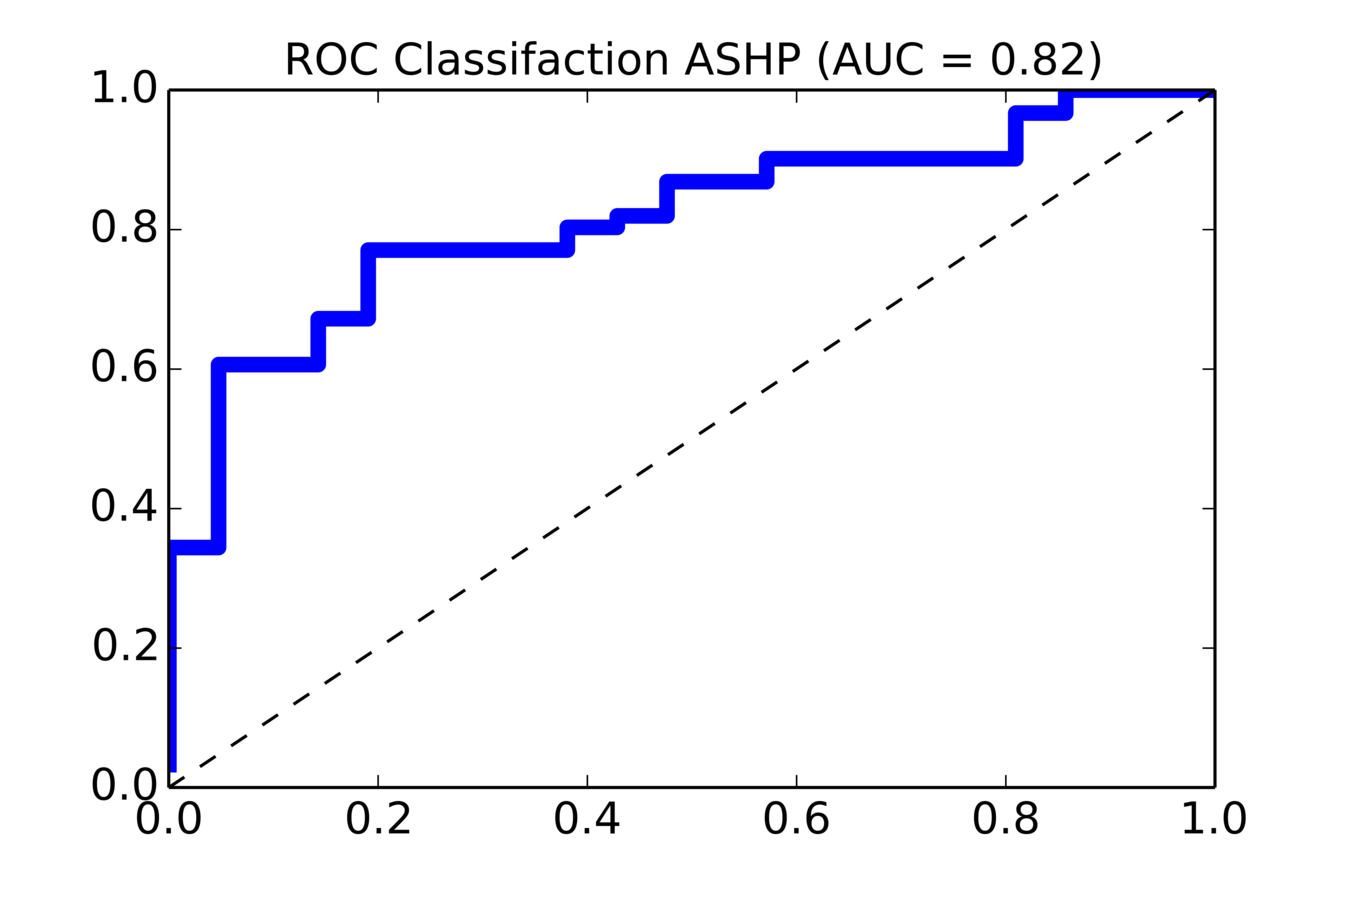
Classifier Performance
85% of current shortages correctly classified
Unbalanced classes
Before balancing
After balancing
<
| precision | recall | |
| MS | 1.00 | 0.14 |
| IW | 0.77 | 1.00 |
| precision | recall | |
| MS | 0.46 | 0.81 |
| IW | 0.91 | 0.67 |
1:3 ratio of manufacturer:industry-wide on ASHP
Choice of classifier: Distributor
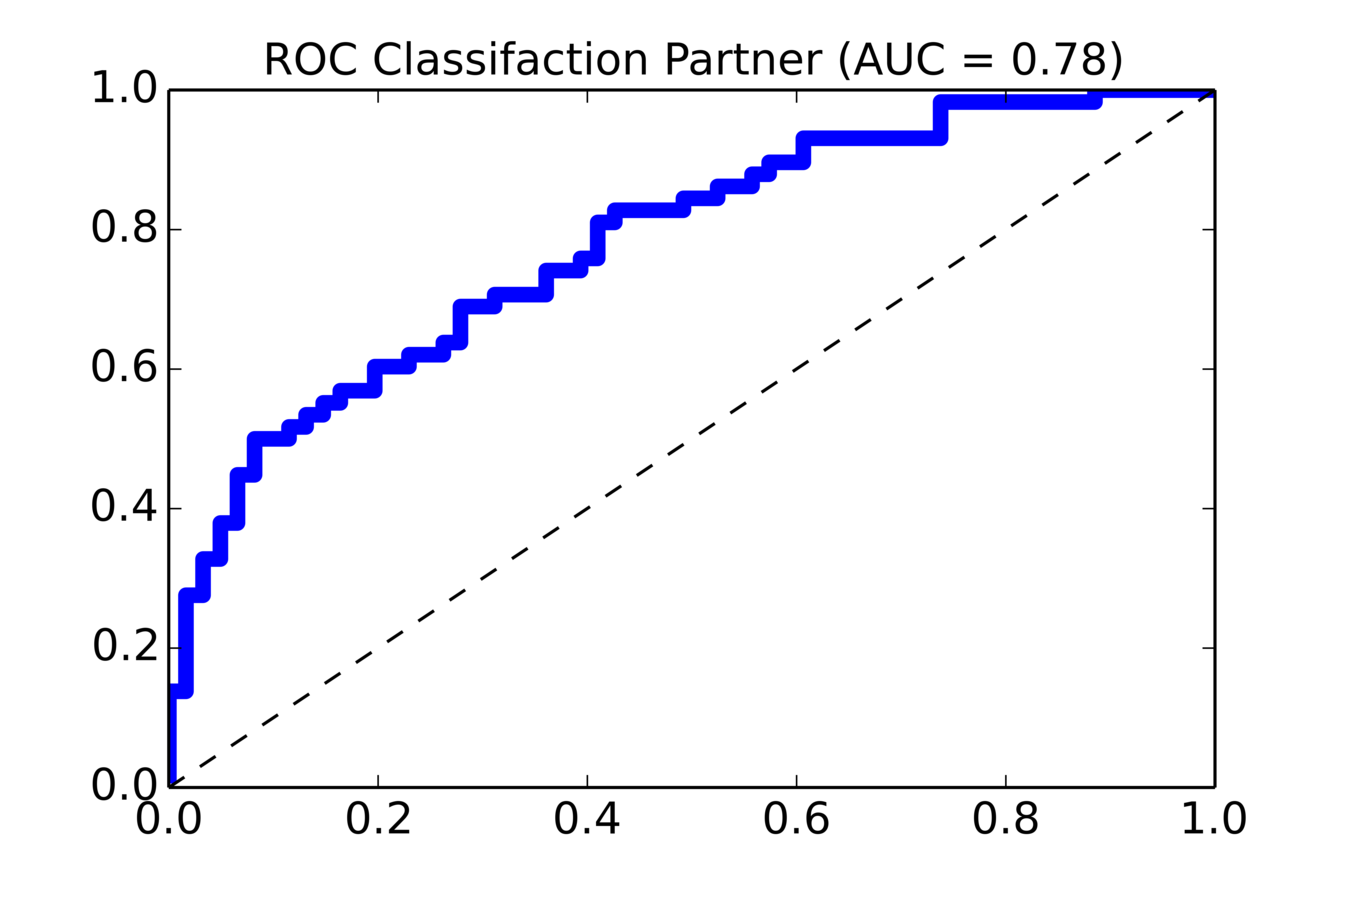
Logistic Regression
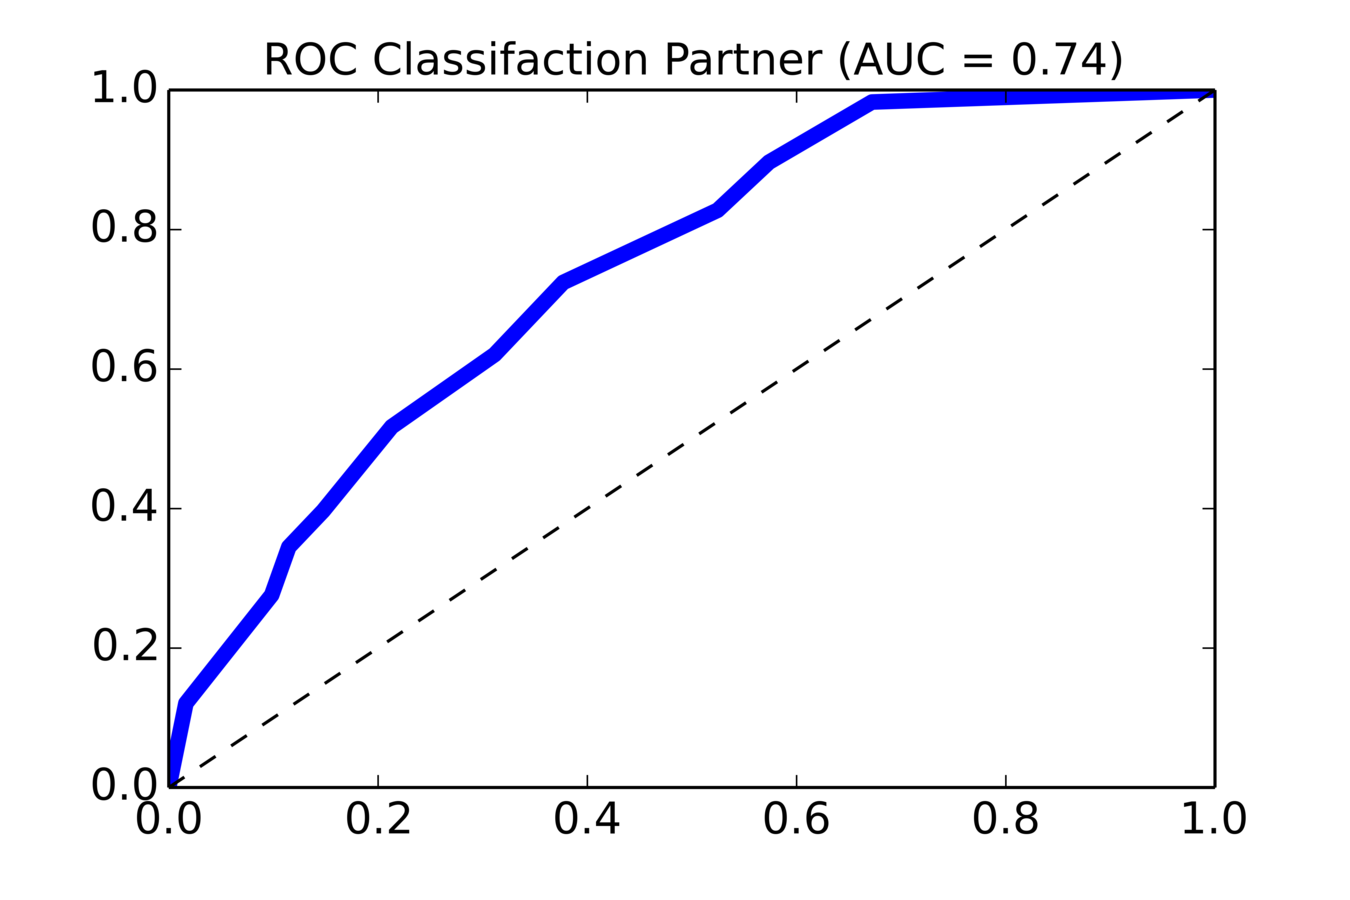
Random Forest
- Precision: 0.69
- Recall: 0.69
- Precision: 0.66
- Recall: 0.66
>
Feature importance
Important features
Less important
- Average # manufacturers who can not deliver
- "raw material" in reason
- # page updates
- Total # shortages
- Time since last shortage
- # affected drugs
How Indicators are used
P({\color{blue}A}) = P({\color{blue}A}\,|\,{\color{red}B})P({\color{red}B})
+ P({\color{blue}A}\,|\,\overline {\color{red}B})P(\overline {\color{red}B})
P(A)=P(A∣B)P(B)+P(A∣B)P(B)
B today
A in future
From historical time series data
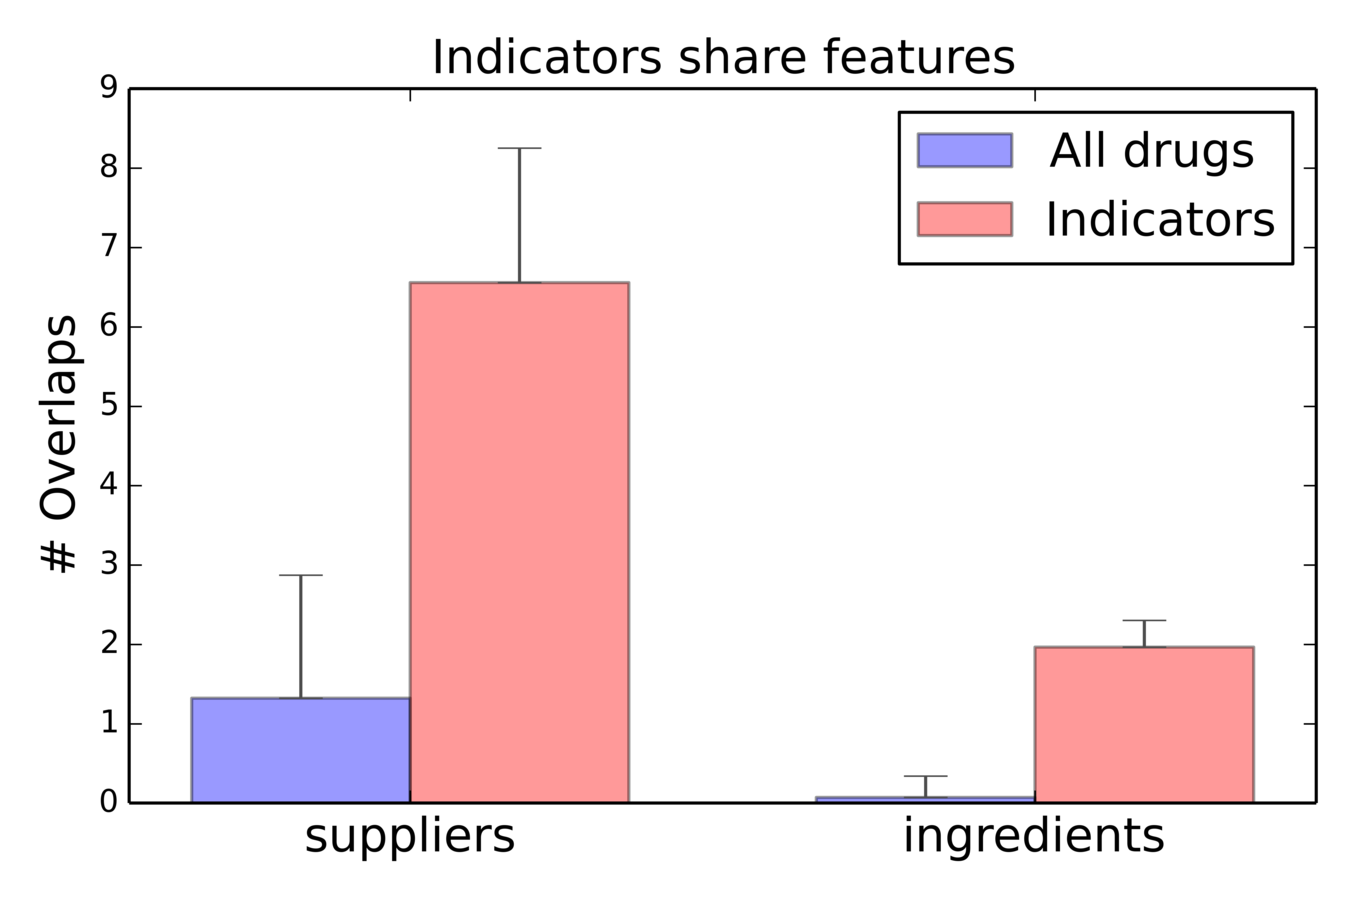
Examples of Indicators
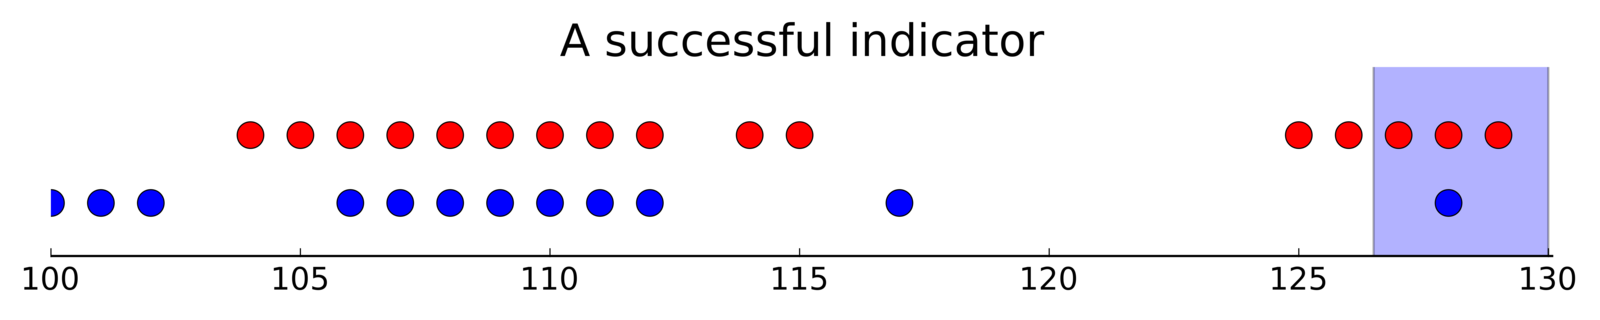
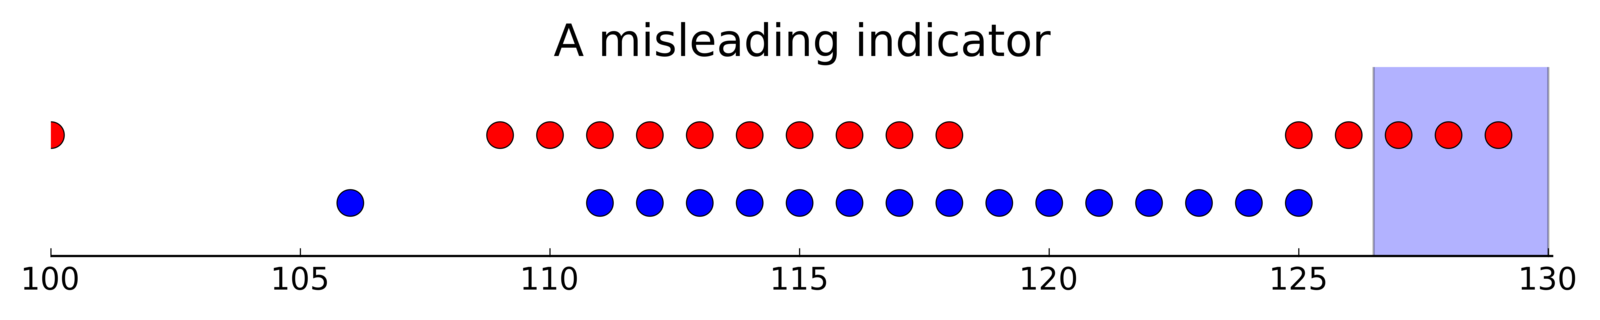
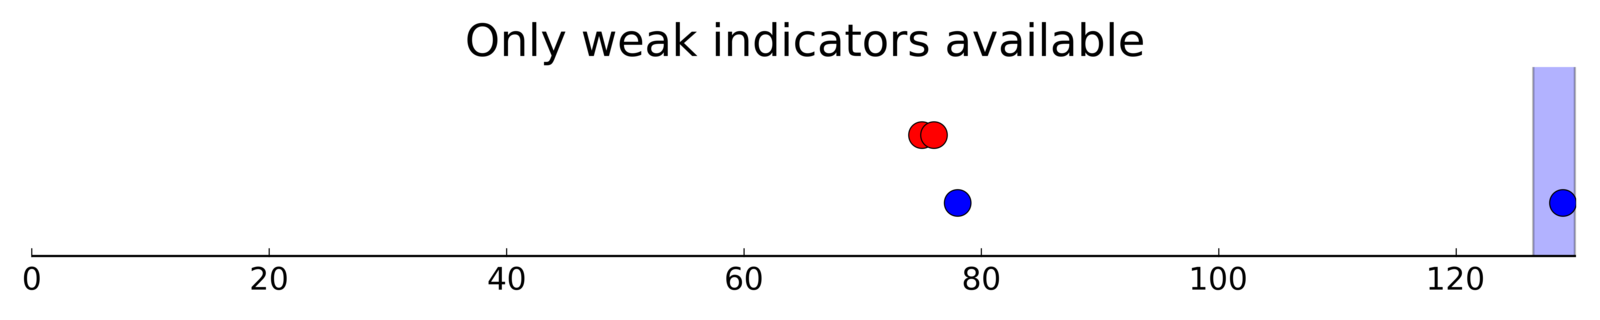
Understanding Indicators
Technical Details on Indicators
- Use Pearson's correlation coefficient to rank lagged time series for different lag values.
- For each drug and lag, use n best predictors in forecast.
- For each drug, average n predictions by strength of correlation.
Pharmdout
By Bernhard Konrad