Data Visualization
Why data visualization?
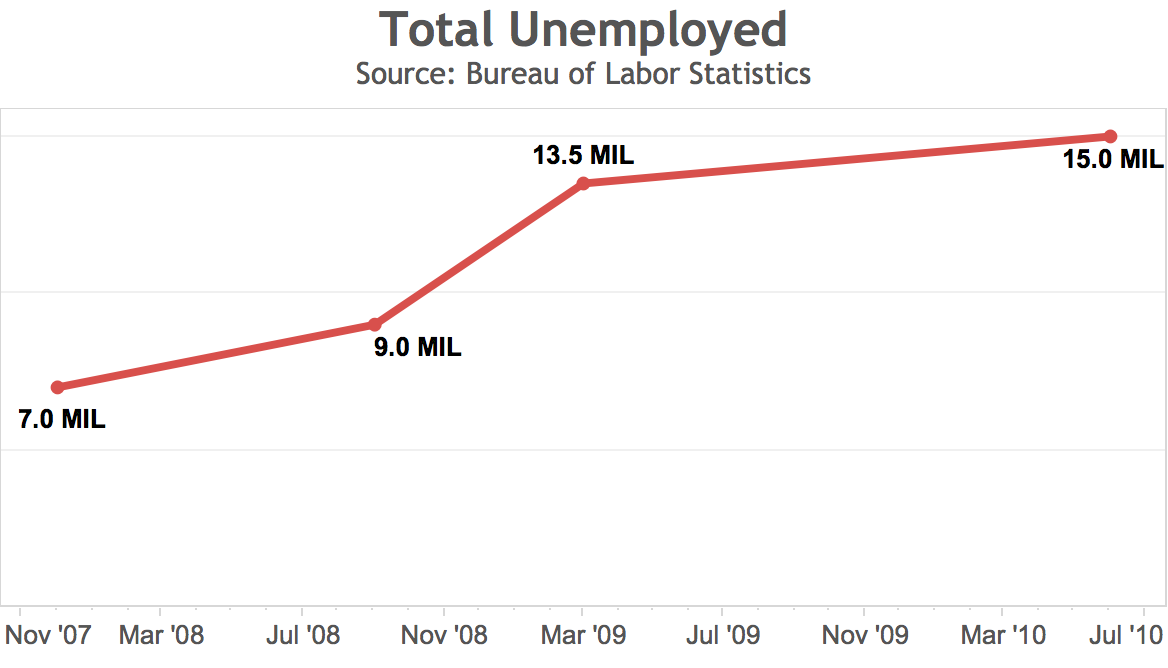
Data visualization is used to answer questions quickly

How are we trending?
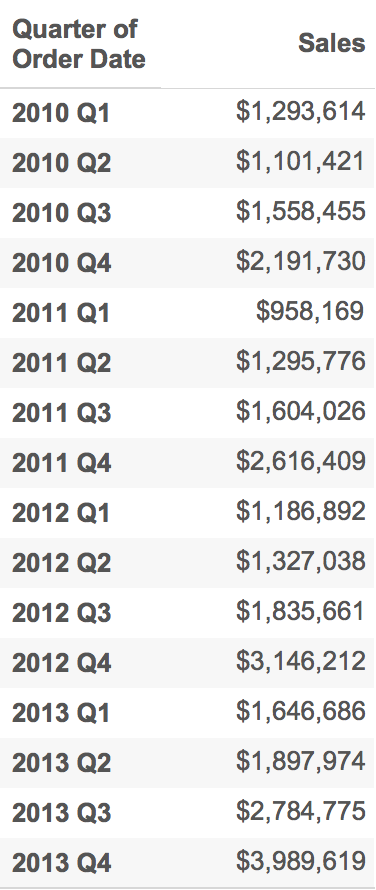
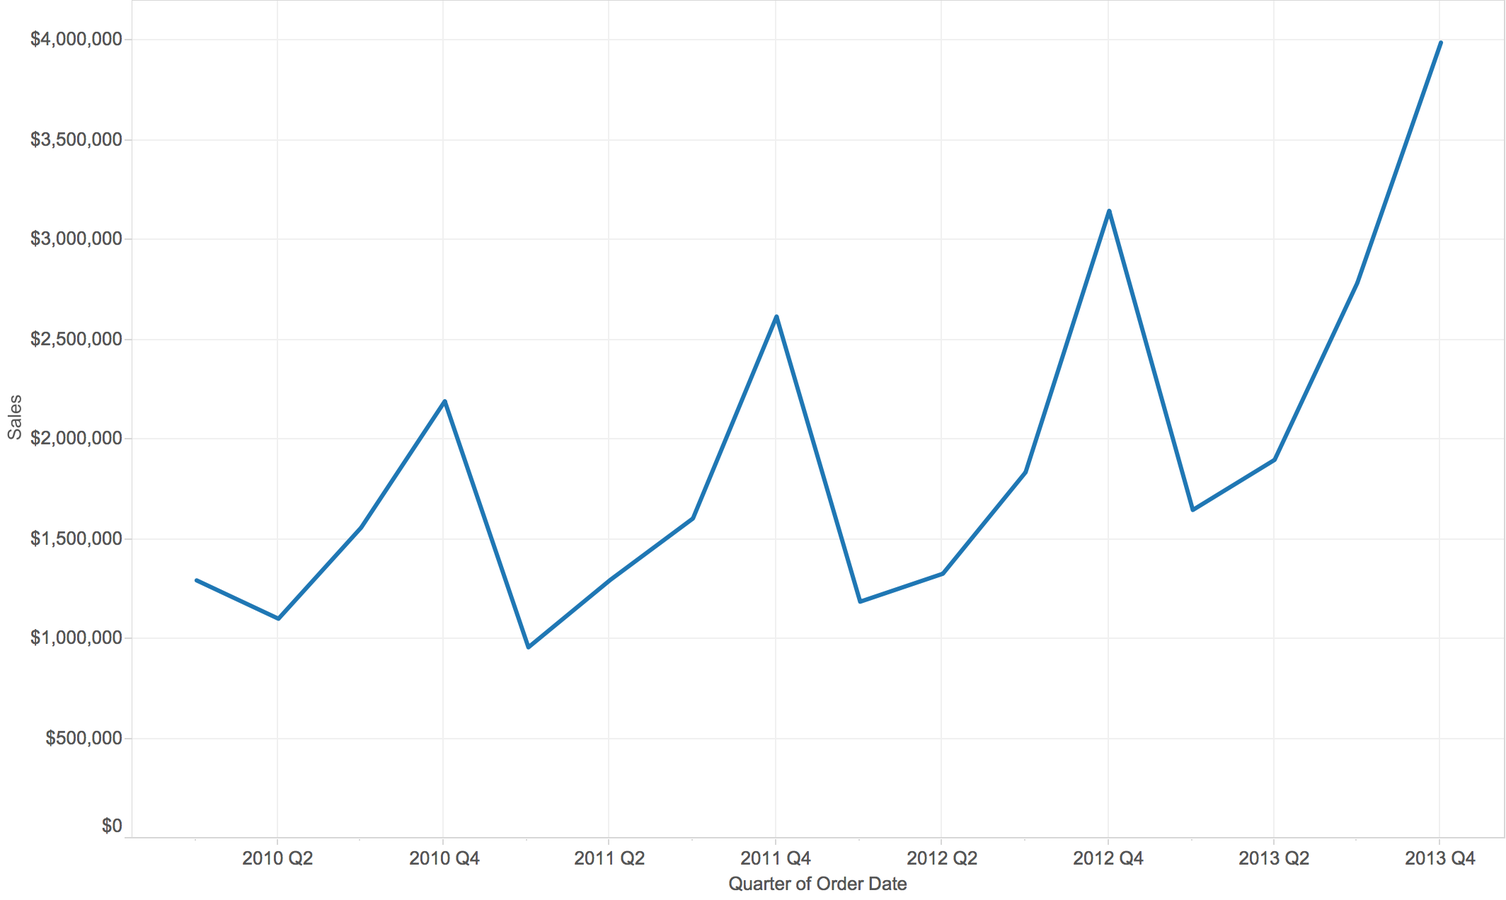
How about now?
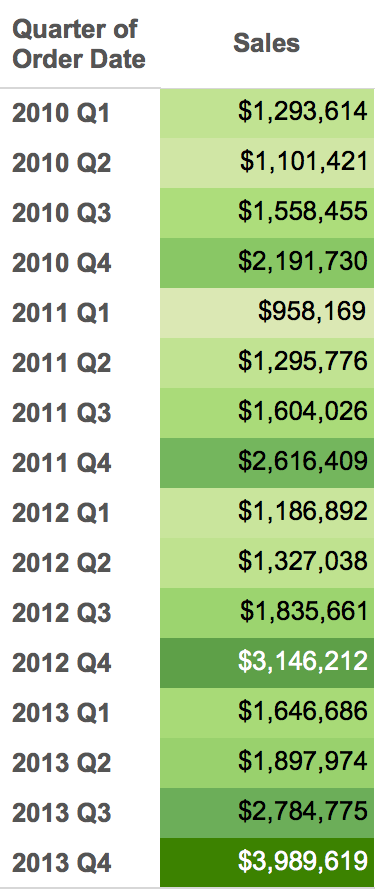
How about now?
Why Data Visualization?
The human brain automatically interprets what we see without thinking

Data Visualization Tools
Color
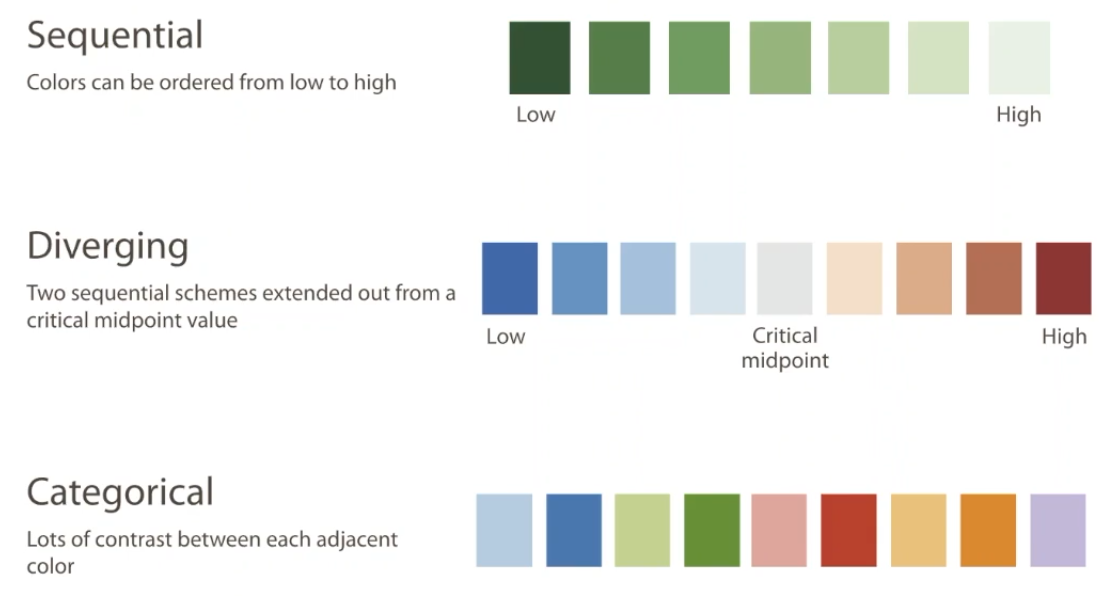
Data Visualization Tools
Color
Associates with
Feelings

Data Visualization Tools
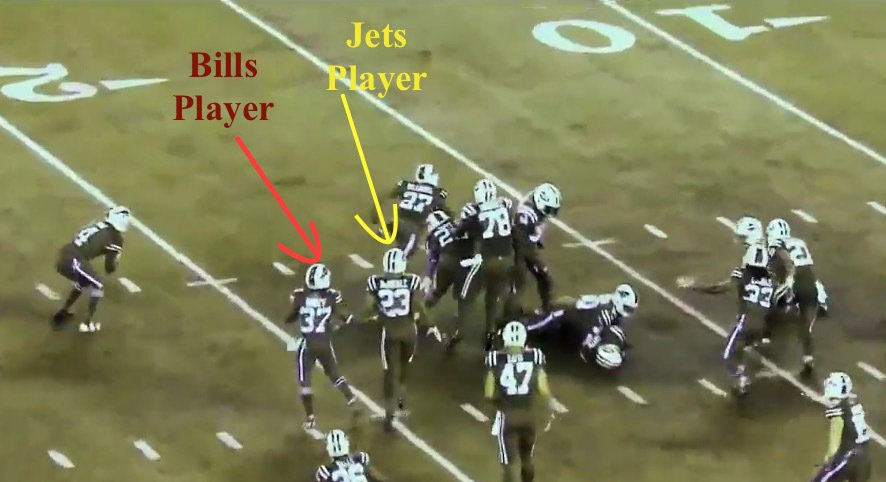
Color
Accessibility - Color Blind (508 Compliant) and make sure your colors have enough contrast (black and white print out)

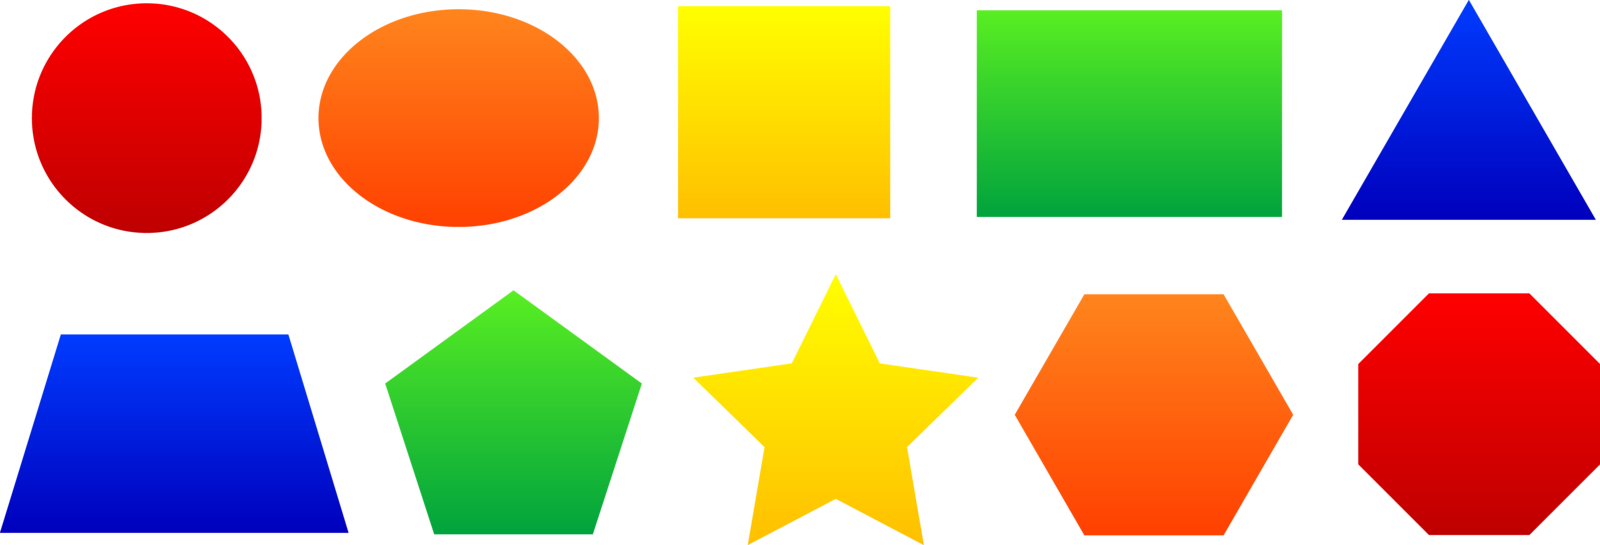
Data Visualization Tools
Shape
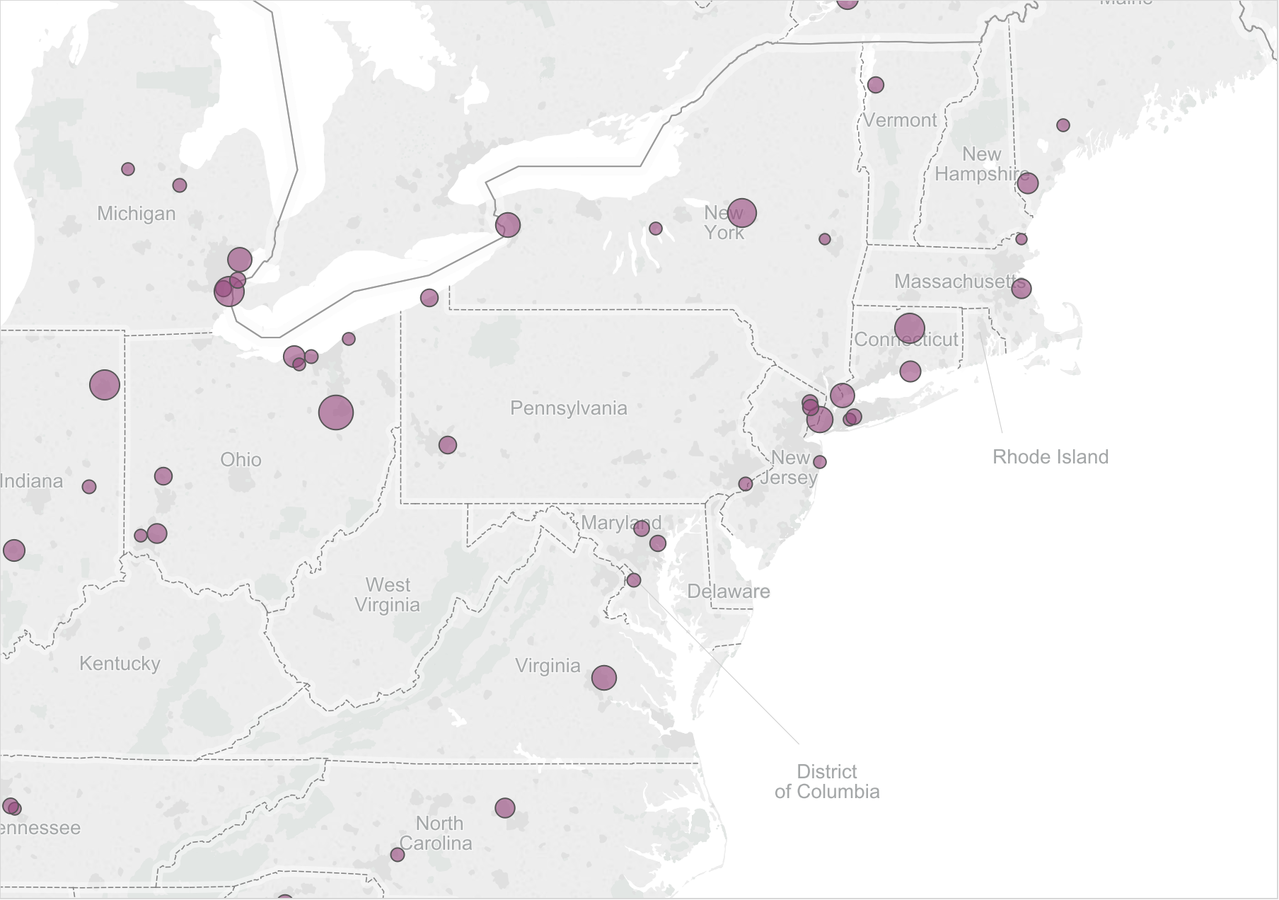
Data Visualization Tools
Size
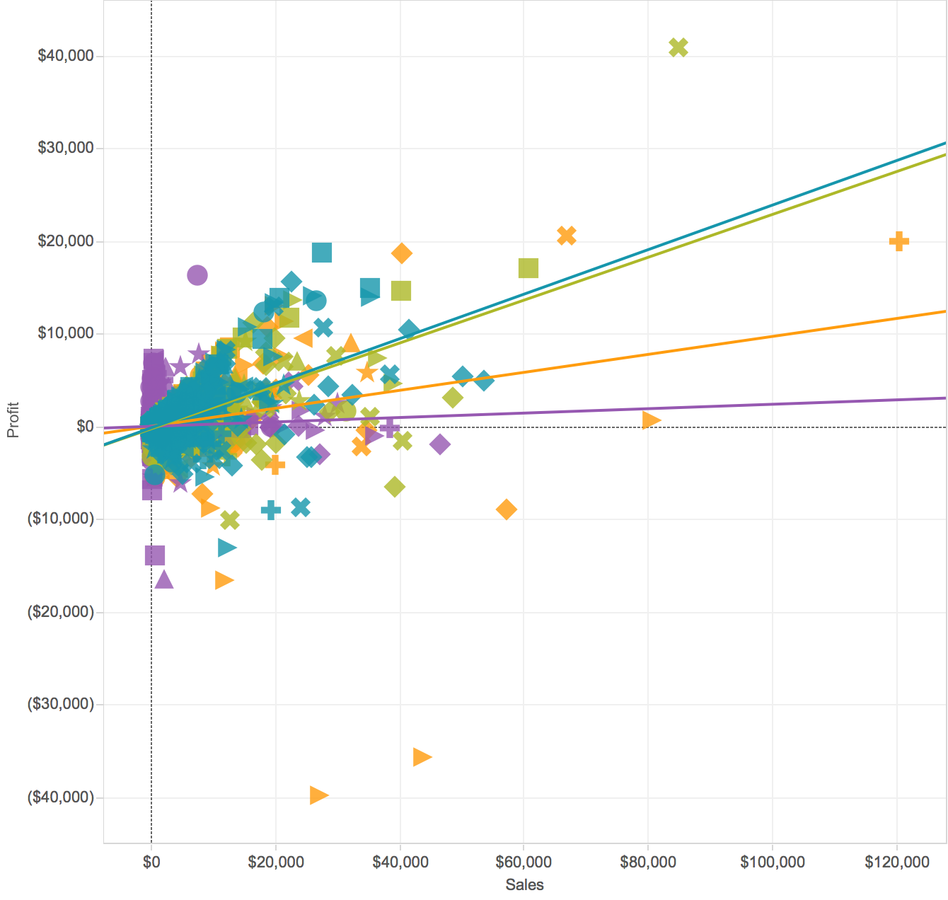
Data Visualization best practices
Why are Best Practices important?
So We don't end up here!
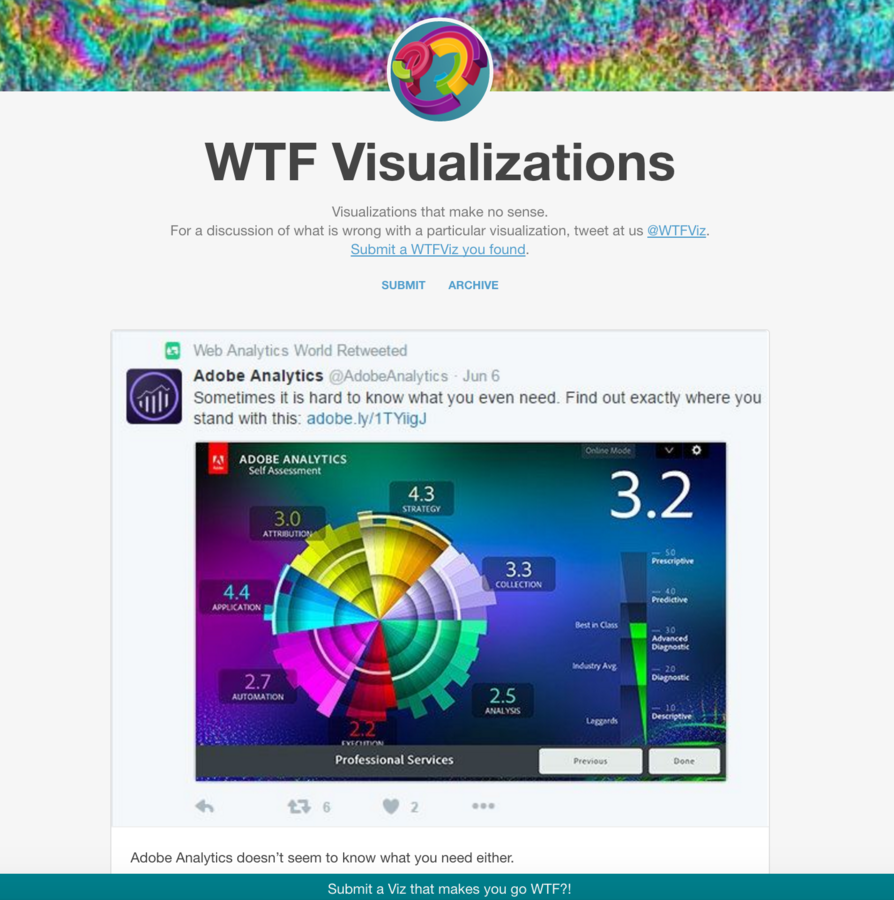
viz.wtf
Ease of Understanding
Make the visualization as easy as possible to read and understand
Ease of Understanding
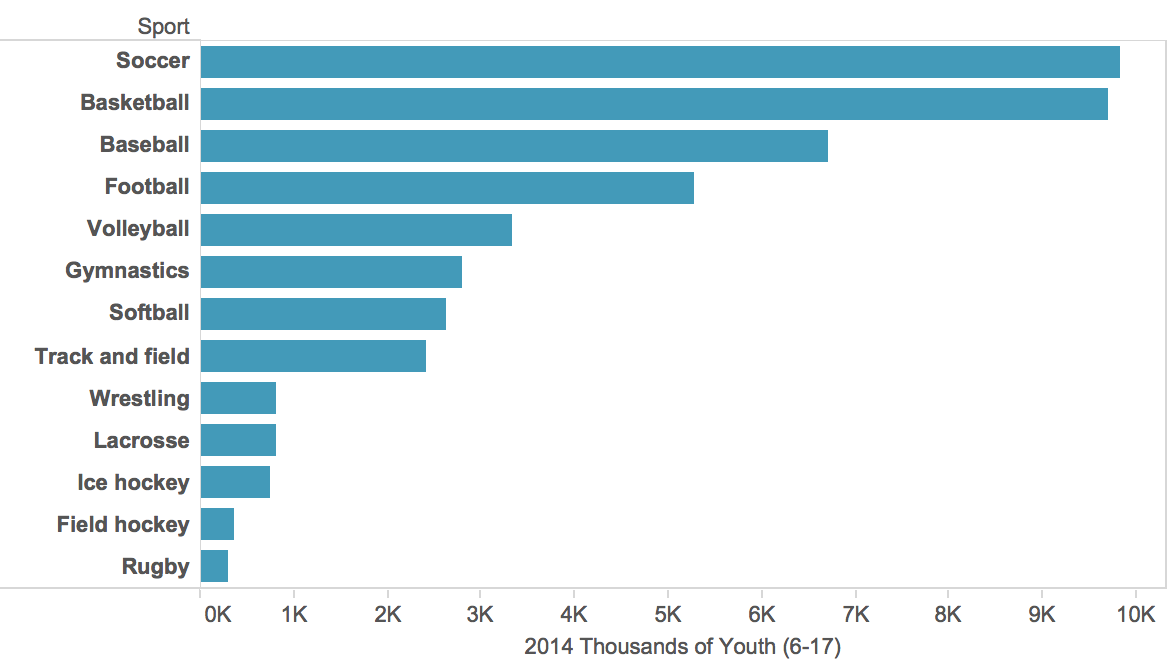
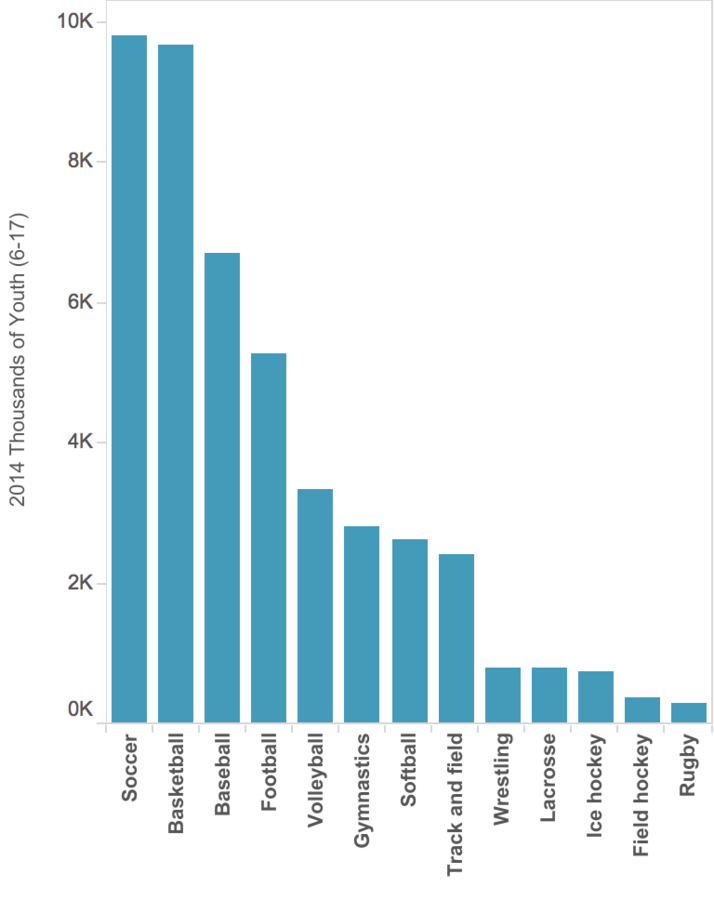
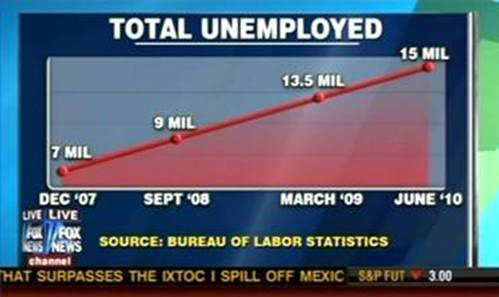
Keep axes clear and consistent
Avoid skipping numbers and Always start from 0
Ease of Understanding
Clearly label visualizations
Titles, sub-titles, axes, legends, data source, outliers (if necessary)
Try the 30 second test
Ease of Understanding
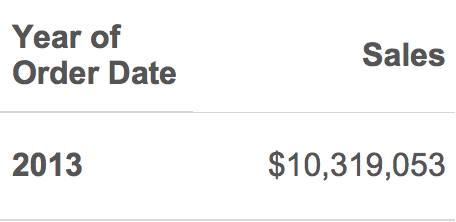
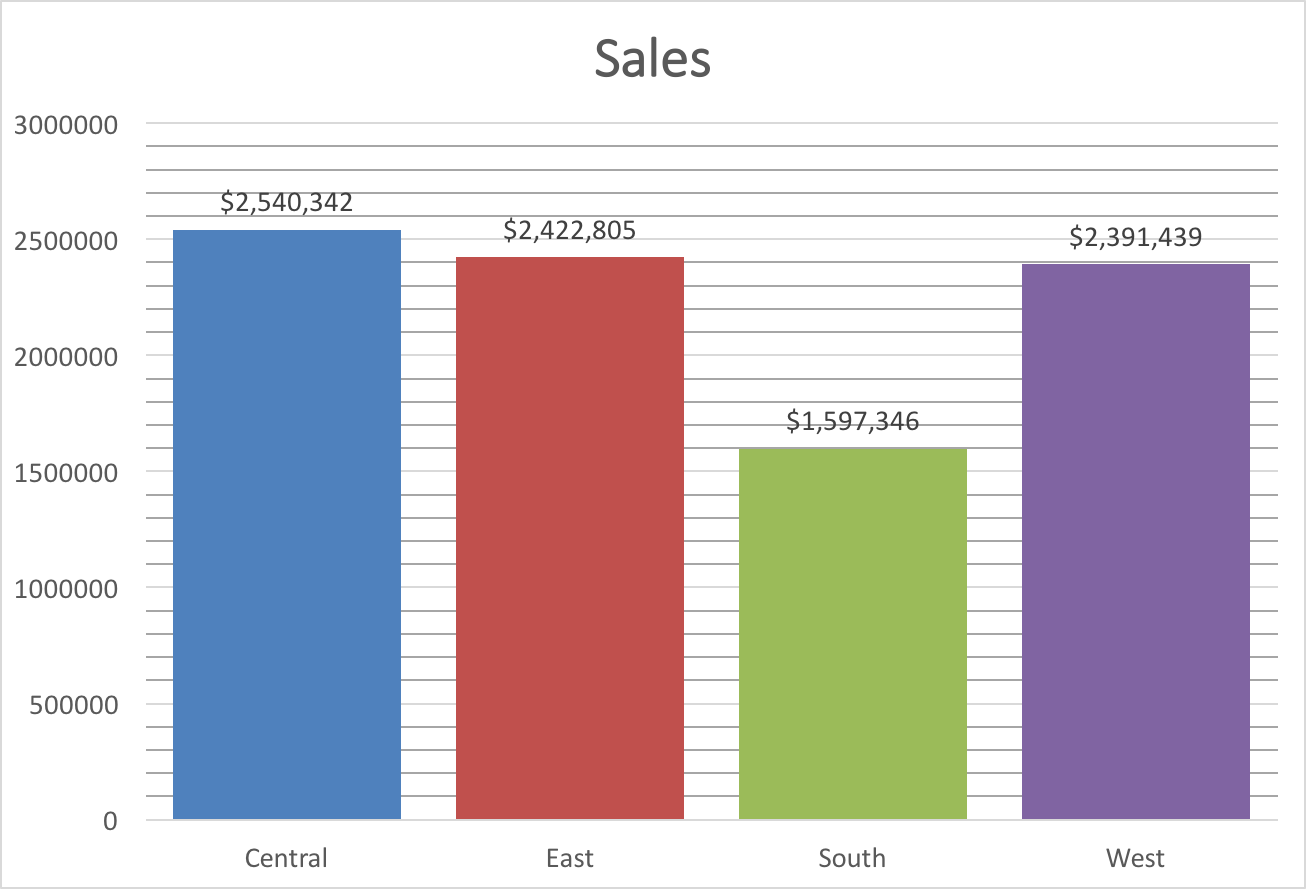
Provide Context
How do I know if this number is good or bad? I need some sort of reference.

Keep it simple
DON'T ADD COLORS WHEN IT'S NOT NECESSARY
IF it doesn't help explain the visual get rid of it
Don't add too many labels

Keep it simple
Just because you can doesn't mean you should
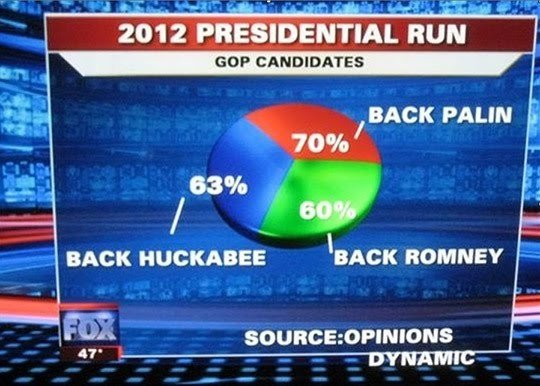
Check your work
Does the visualization logically make sense? If you must use a pie chart it better add up to 100%
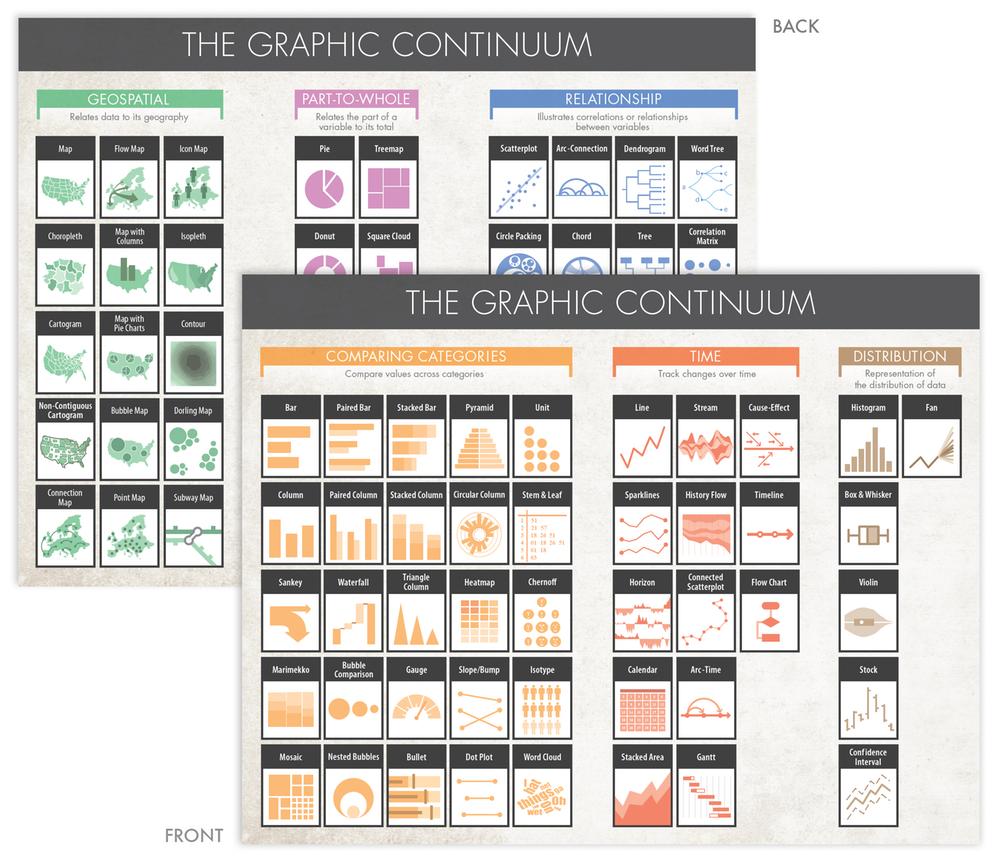
Use the right graph
Jon Schwabish's Graphic Continuum
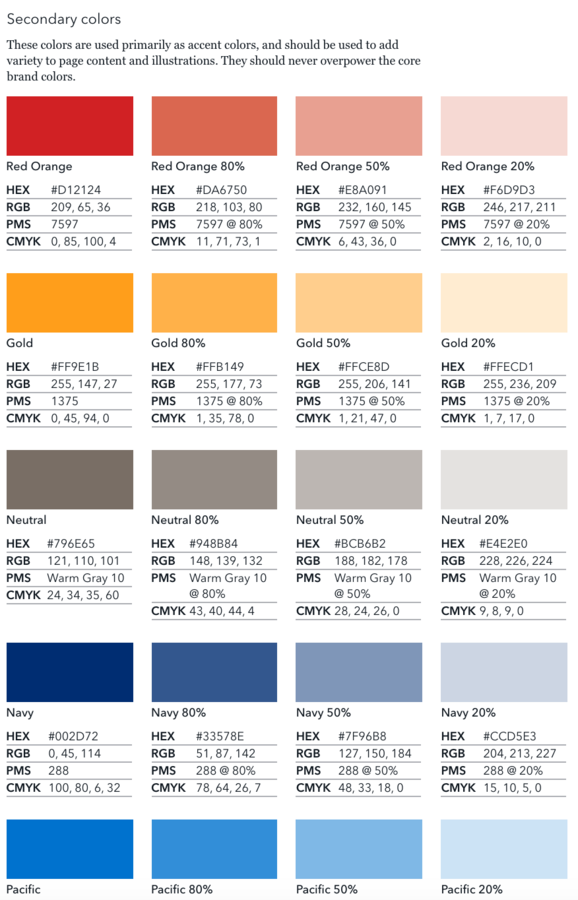
What Can I do?
Style Guides with Brand compliant color palettes
Data Visualization Best Practices
By bfongdata


