Statistical analysis of the mid-latitude ionospheric trough
Introduction
- The mid-latitude ionospheric trough is a region of depleted plasma densities in the F-region observed persistently at the sub-auroral latitudes.
- The is completely understood.
-
Two important factors in the region are expected to influence formation of trough :
- Stagnation of flows (in the region between inner and outer magnetosphere).
- Strong electric fields (SAPS ?).
- The goal of this study is to develop a statistical characterization of the trough and its relation with the mid-latitude trough.
Automatic detection of the mid-latitude trough
Identifying the mid-latitude trough
-
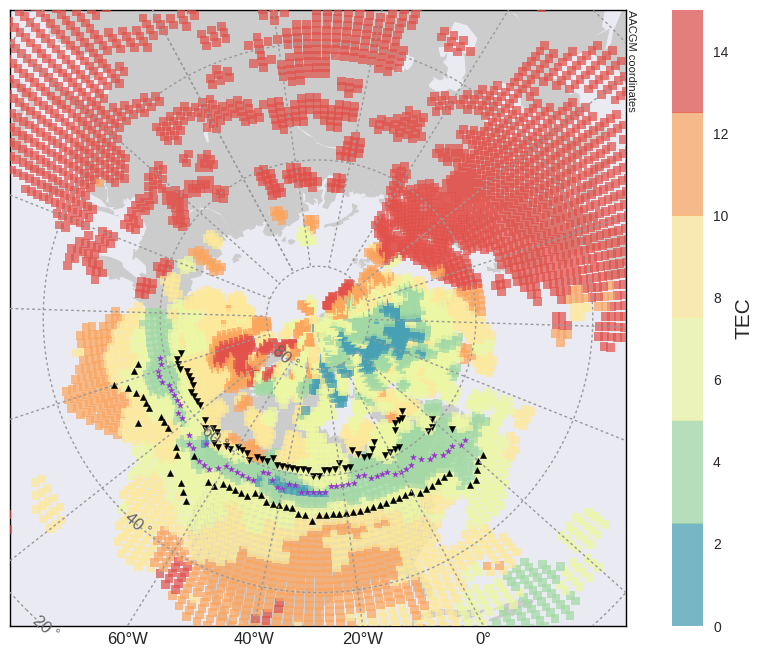
Figure presents median filtered (Evan's method) GPS TEC data (Apr 9, 2011 at 0900 UT) [Clausen et al., 2011].
-
The boundaries of the trough and min trough location are automatically identified using the method described before.
-
We automatically detected troughs during SAPS periods between 2011 and 2014. The trough detection technique worked well for quite a few examples and didn't for some.
Trough occurrence statistics during SAPS periods.
-
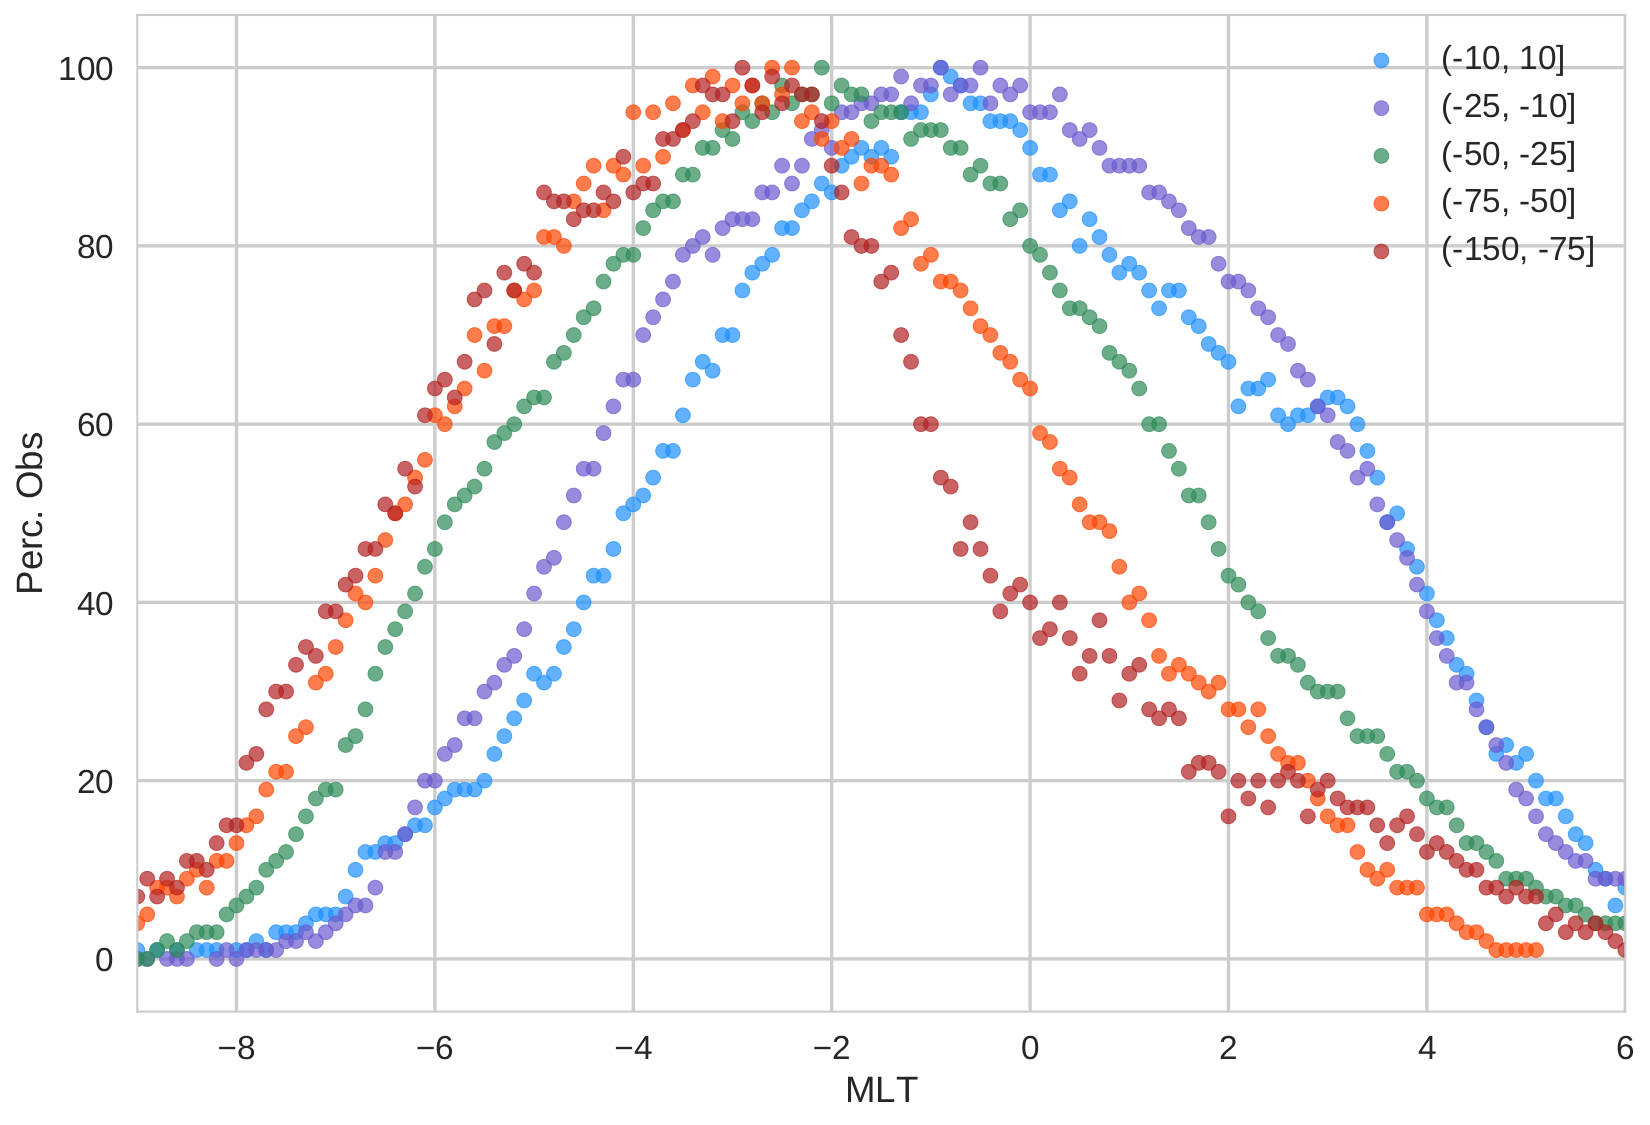
Figure, presents normalized data counts at different MLTs and Dst-bins, where the trough was identified.
-
For example, trough was successfully identified the most number of times (100%) near -1 (23) MLT when Dst is between -10 and 10 nT.
-
The peak trough location moves duskwards with increasing geomagnetic activity.
-
The pattern is similar to the one observed with SAPS location.
Mid-latitude Trough grouped by Dst
-
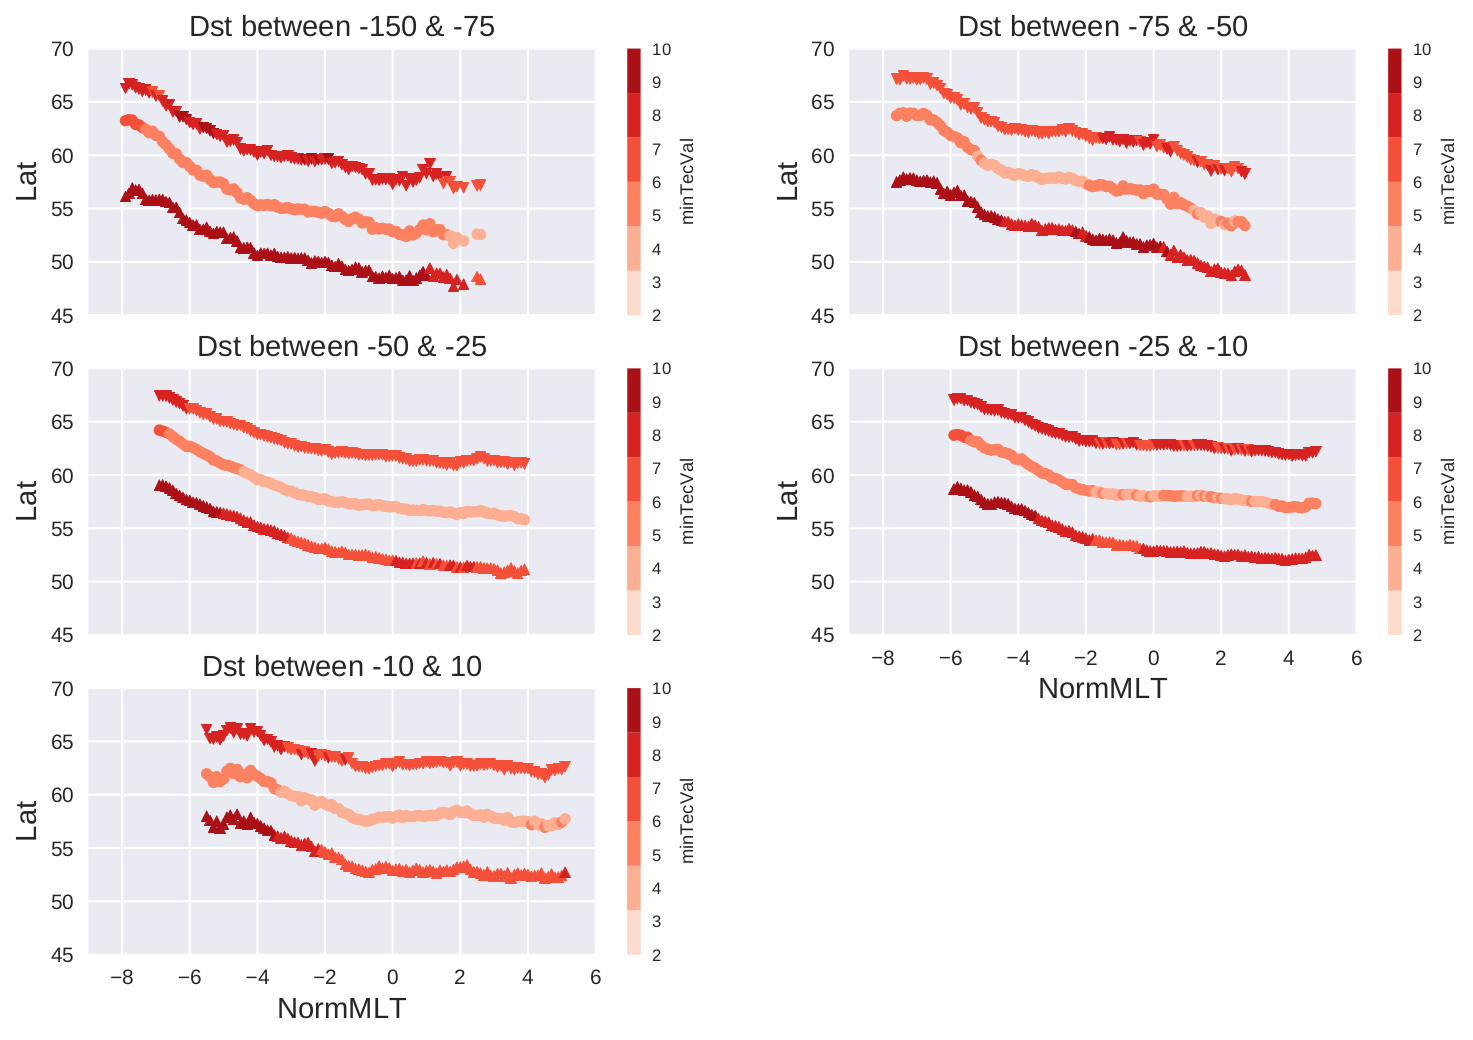
Mean location and TEC values of trough boundaries and minimum location grouped by Dst.
-
Trough location moves equatorward and duskwards with increasing geomagnetic activity.
Variations in TEC values with MLT
-
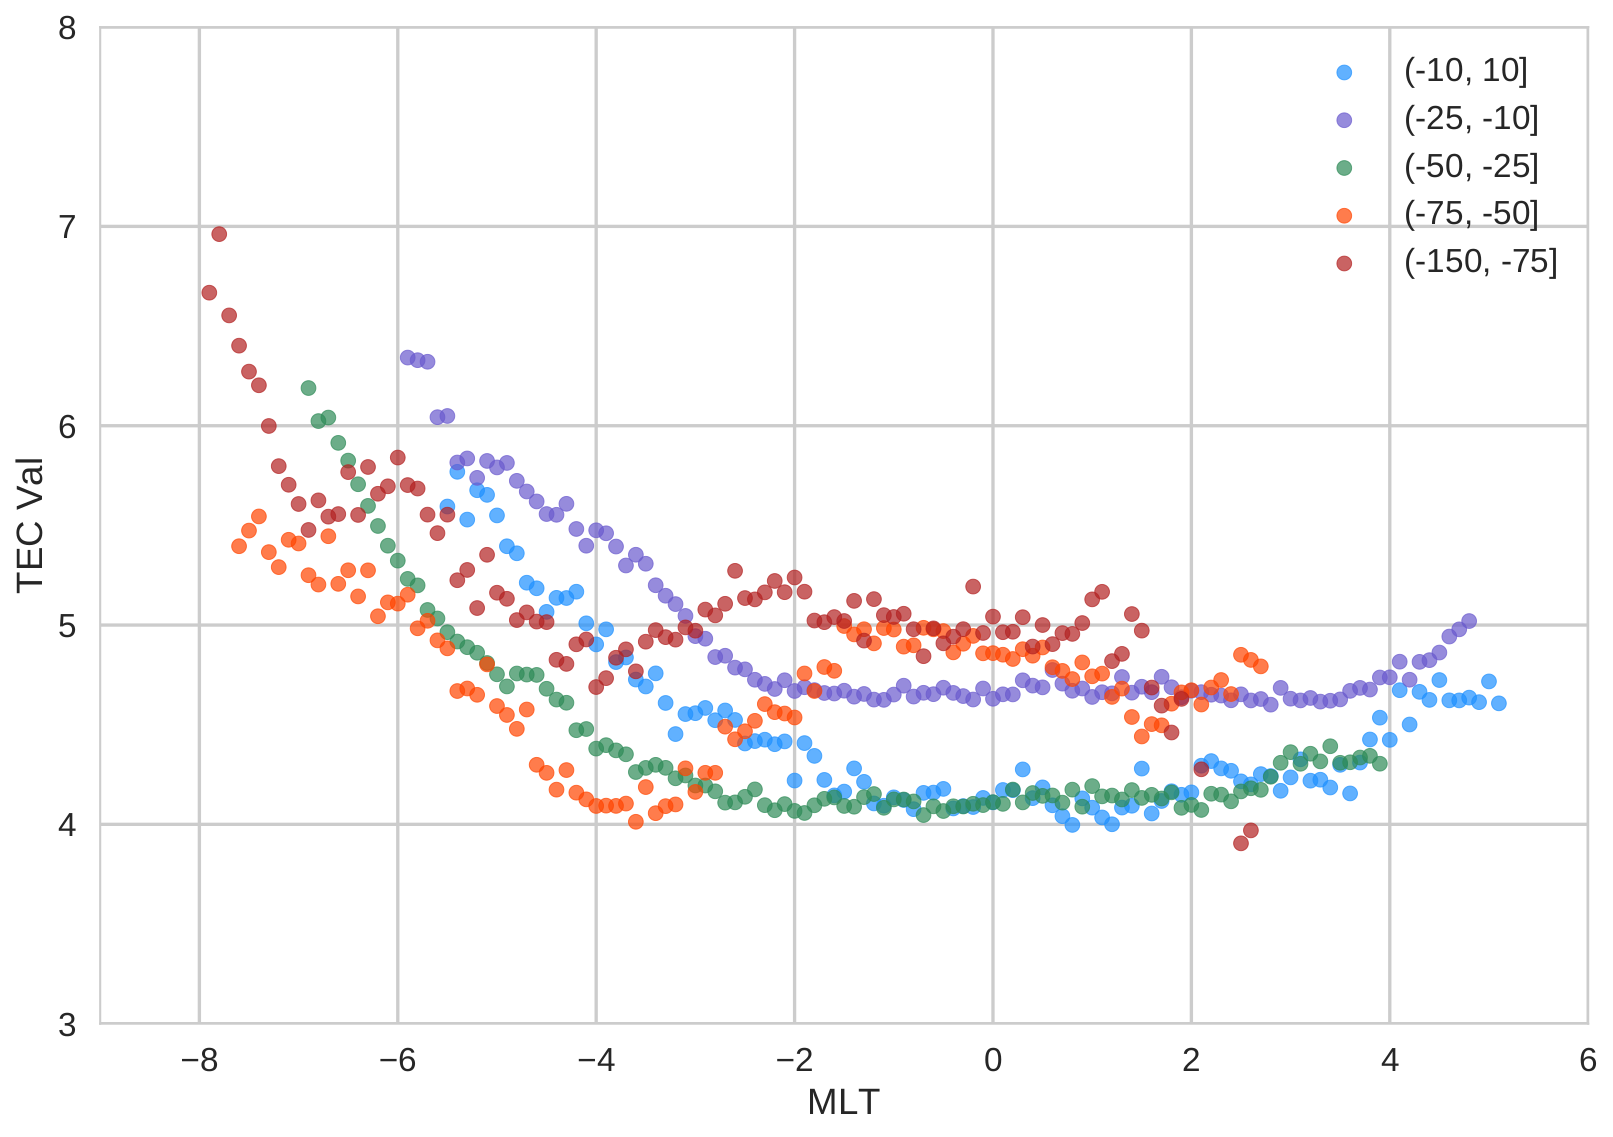
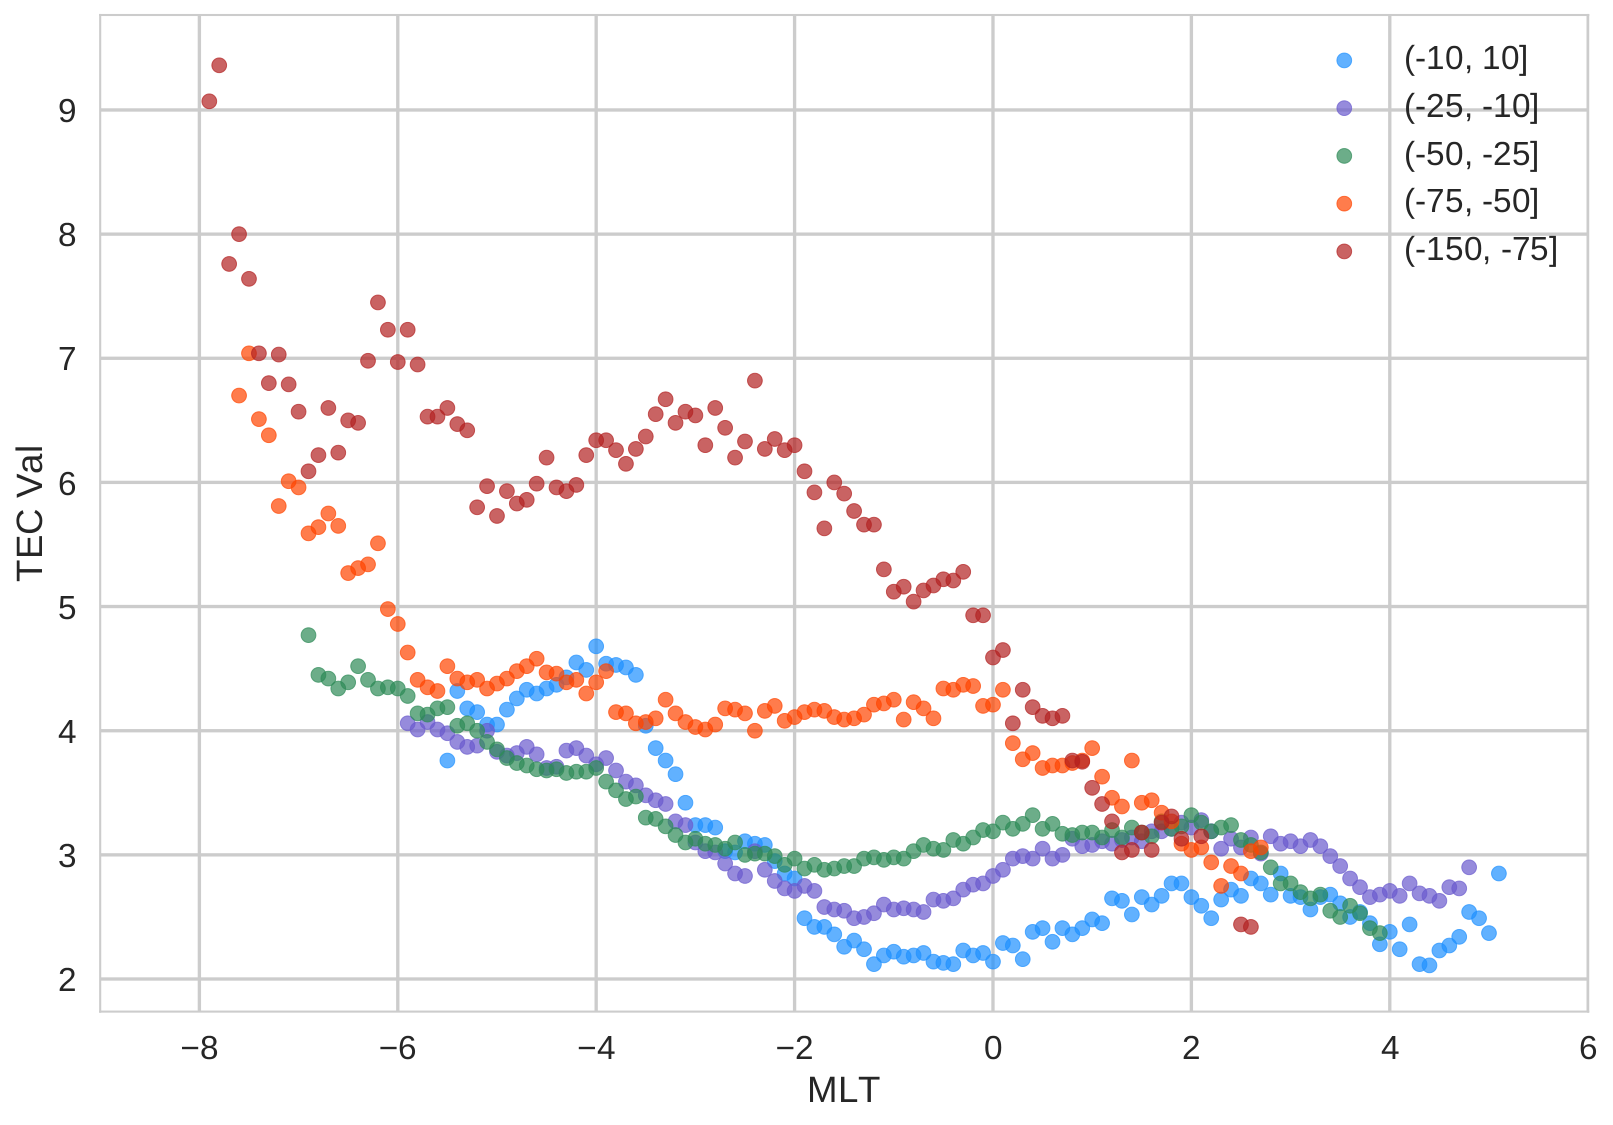
Mean TEC values at trough minimum vs MLT at different Dst levels.
-
No pattern in particular, TEC values are higher near dusk (day-night terminator ?).
-
Mean TEC values are between 4 and 5 for all Dst bins near mid-night and some what higher near dusk.
Trough location with respect to SAPS
-
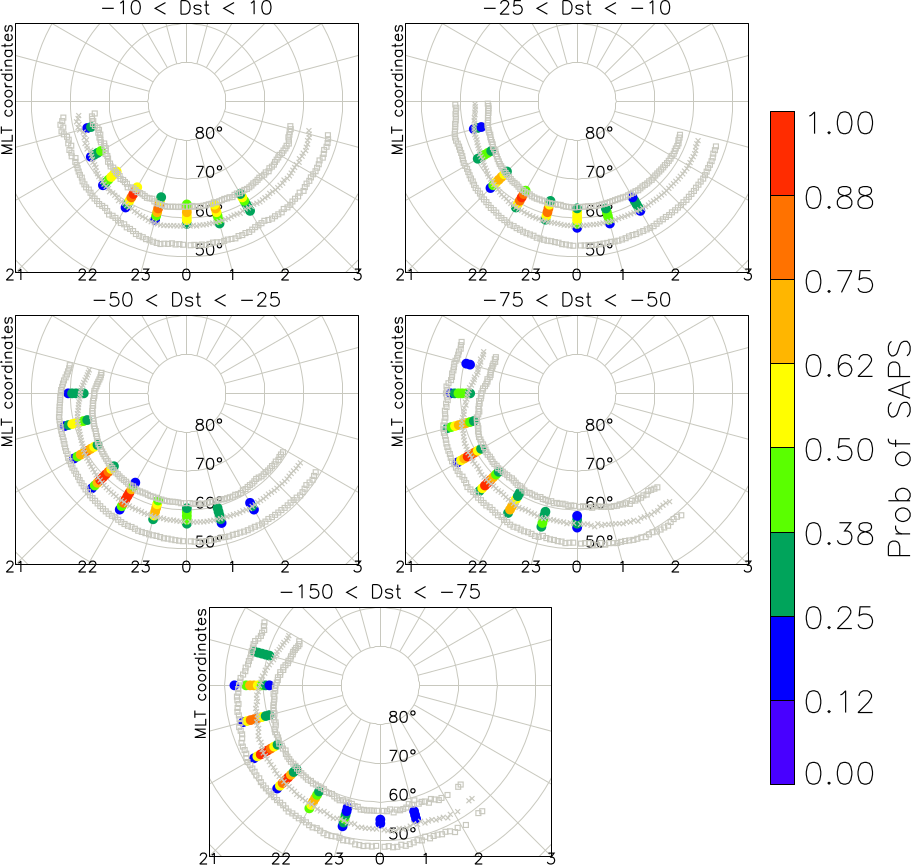
Figure presents SAPS prob of occurrence plots ( Kunduri et al [2017] ) overlaid along with trough edges and minimum location.
-
Although takes from different datasets, SAPS and the mid-latitude trough show a great degree of alignment.
-
Also, interestingly for bins where Dst > -25 nT, SAPS is located between minimum and poleward edge. For higher disturbance levels SAPS is located between both the edges.
Equatorward trough depth with Dst-index
-
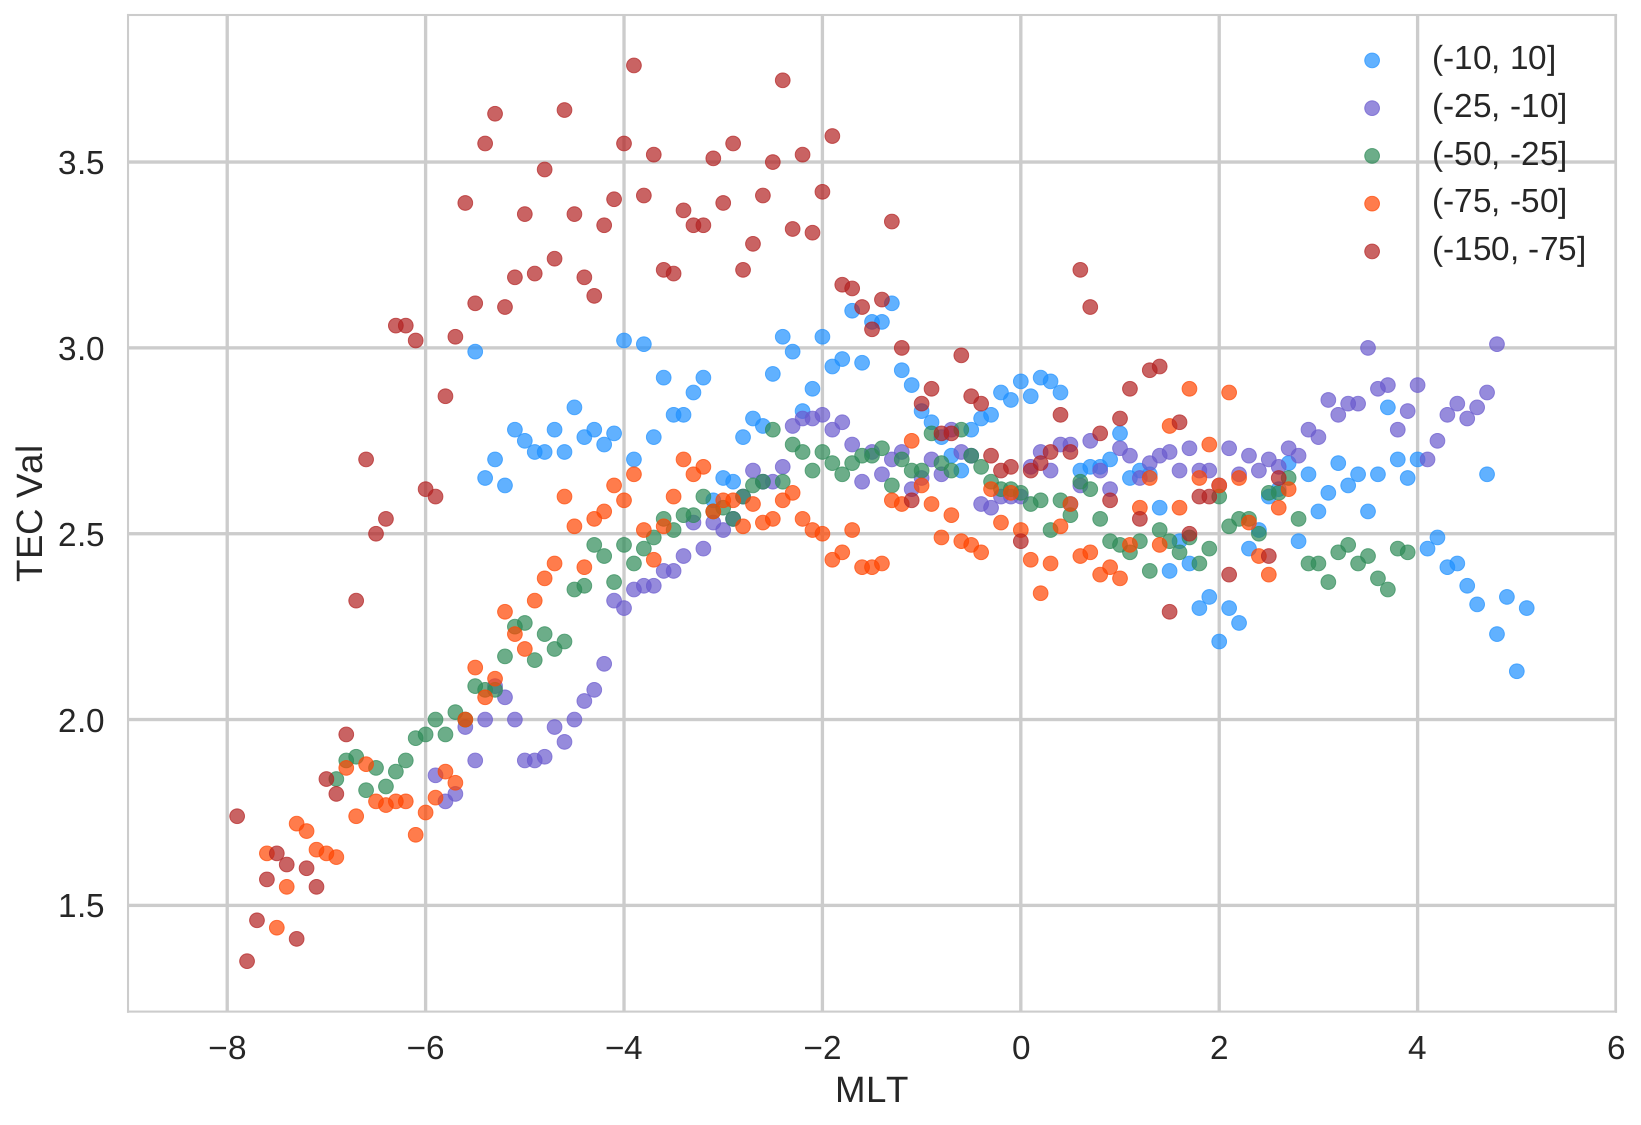
Figure presents mean difference between TEC at equatorward edge of trough and trough min.
-
Generally, the trough is deeper towards dusk and at disturbed geomagnetic activity levels.
-
A deeper trough is associated with stronger SAPS electric fields (SAPS velocities are stronger towards dusk and at more negative Dst levels) ?
Poleward trough depth with Dst-index
-
Difference between TEC at poleward edge of trough and trough min.
-
The trough is not as deep as the one observed on the equatorward edge. Missing data at higher latitudes in the candian sector?
-
Contrary to equatorward edge, appears to be slightly deeper moving away from dusk.
Trough Occurrence Probability model
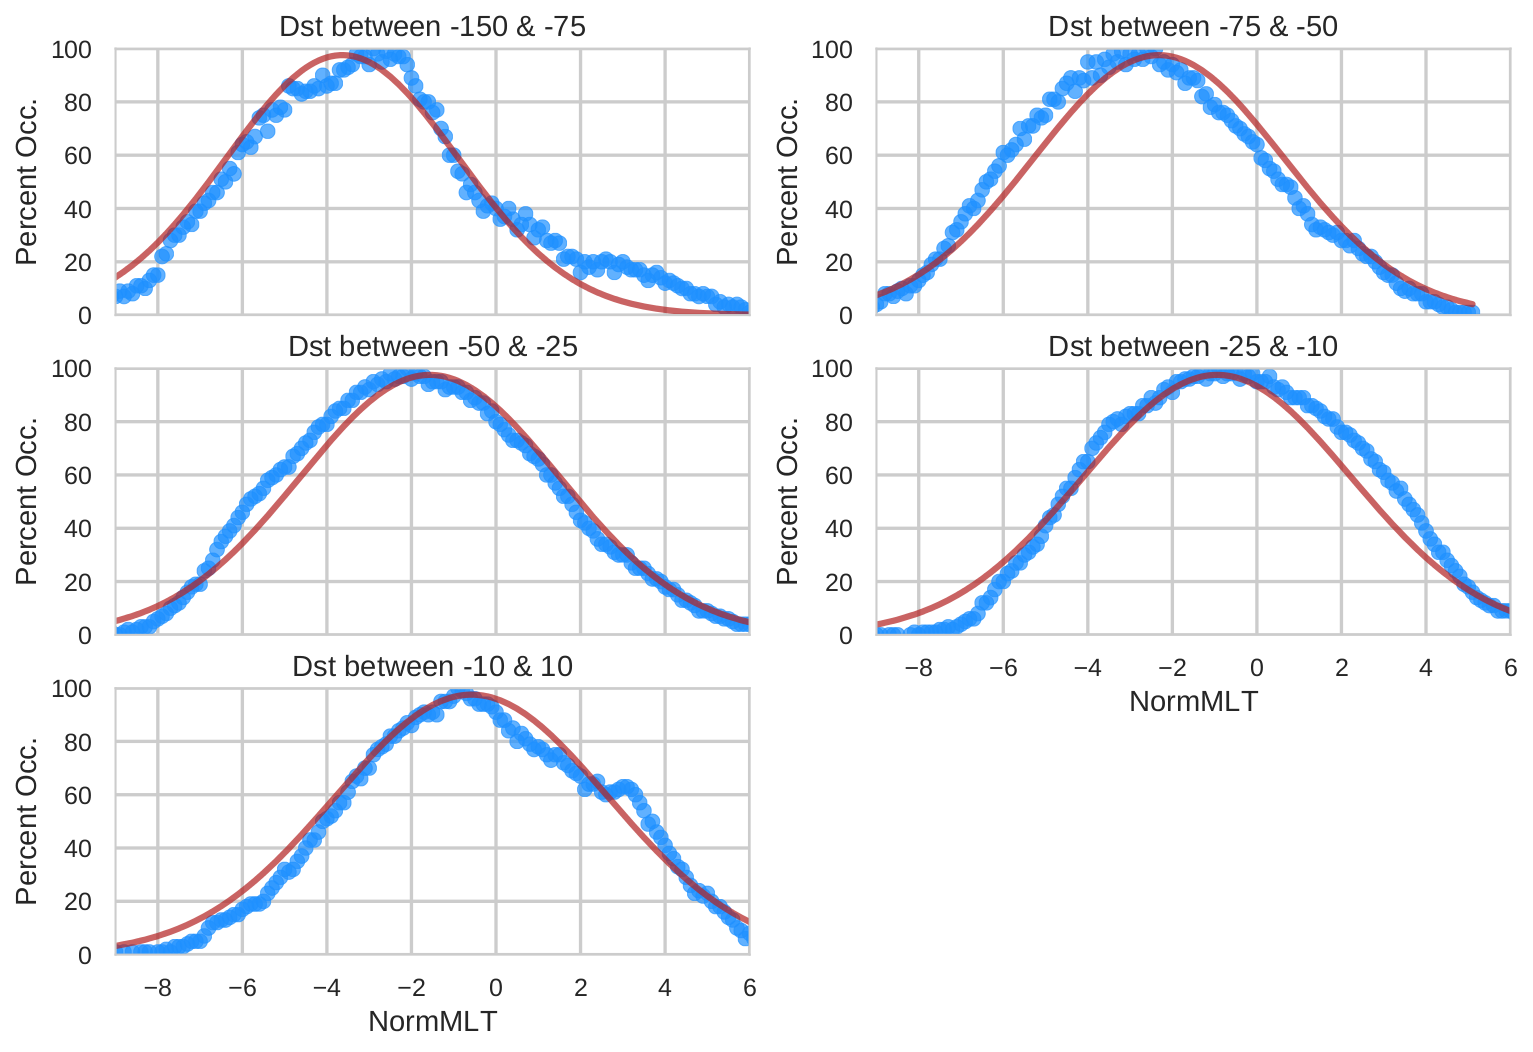
- Actual trough observations (blue circles) and Gaussian fitted curve (red line).
- trough_prob = 0.98*exp( -(normMLT+0.38-0.03*dst)^2/(-6.52-0.011*dst)^2 )
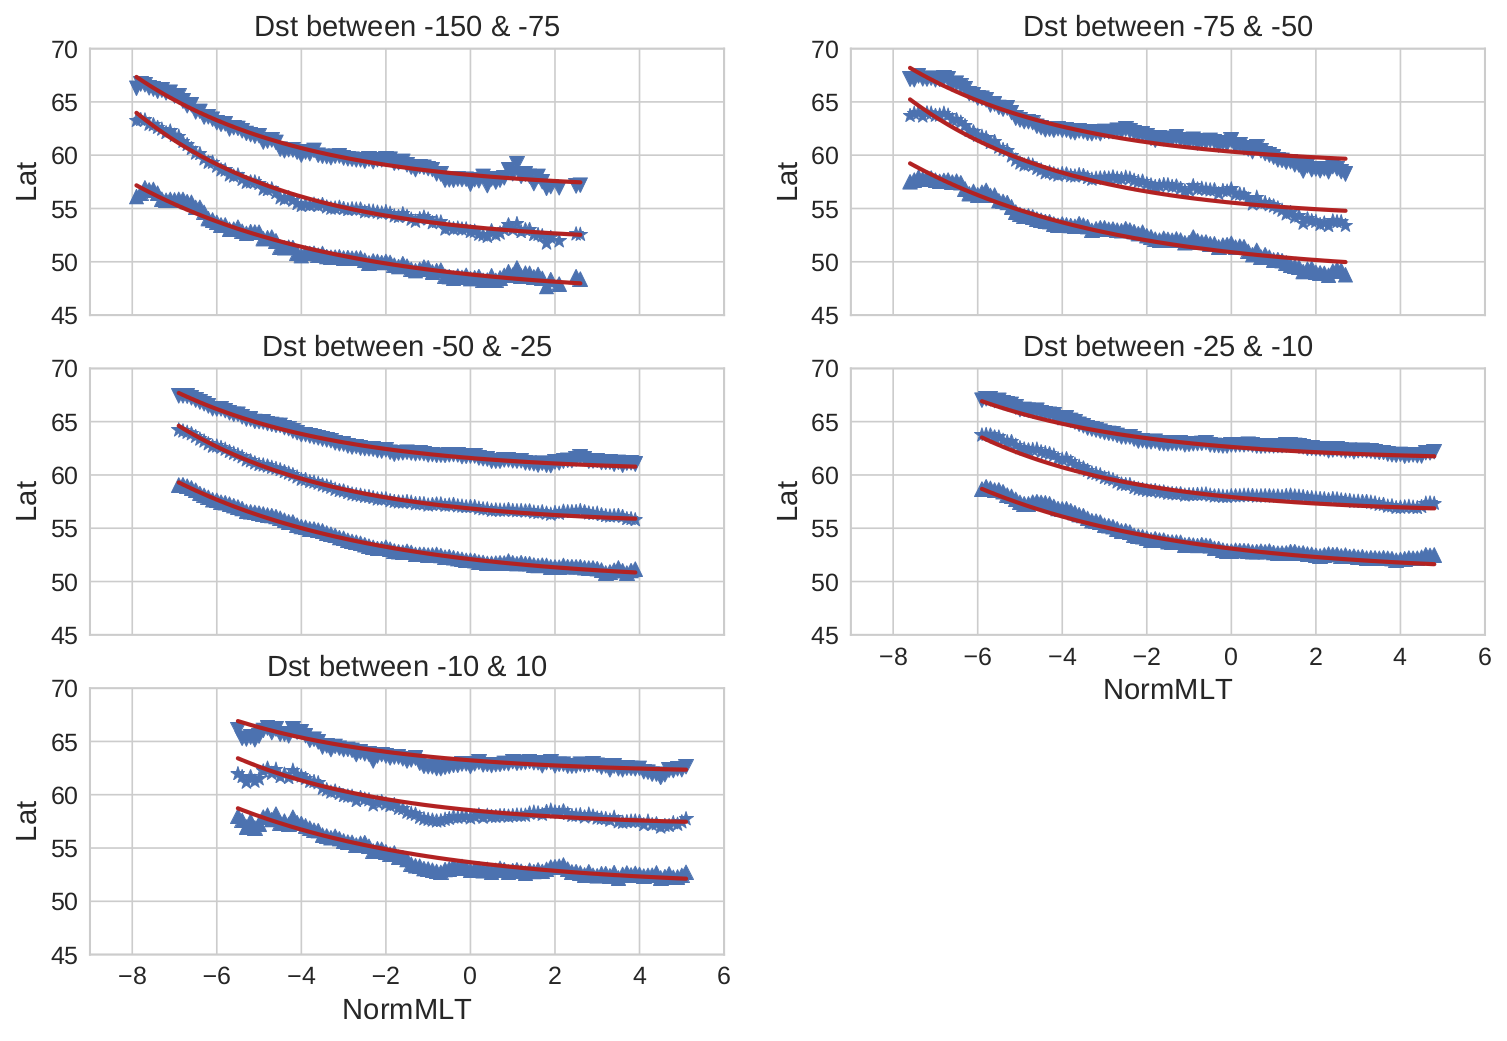
Trough location model
- Actual trough location observations (blue) and fitted curves (red).
- The MLATs were fitted as exponential function of MLT.
Conclusions and future work
- Statistically demonstrated trough is collocated with SAPS in general
- Deeper troughs are associated with higher SAPS fields - confirming the feedback mechanism?
- Developed a SAPS time trough location model.
-
Future work :
- Discuss the trough detection method with others?
- Similar analysis for non-SAPS periods.
tec-saps
By Bharat Kunduri


