Characterizing SAPS electric fields observed by midlatitude SuperDARN radars
Introduction
In Kunduri et al., [2017]
- Mid-latitude SuperDARN based SAPS statistical study.
- SAPS are more frequent than we expect (even during quiet times).
- Developed SuperDARN based SAPS location model.
- Analyzed SAPS speeds using gridded line-of-sight velocity data, assuming SAPS flow direction is perfectly westward.
Current Study
- Focussed analysis of SAPS velocities to obtain magnitude and direction with improved resolution.
- Discuss typical range of SAPS velocities in SuperDARN observations using two events.
- Analyze the average statistical characteristics of SAPS velocities (magnitude and direction) and electrostatic potentials with MLT.
- Discuss the spread observed in SAPS velocities.
Estimating SAPS velocities
- SuperDARN range gate width - 45 km.
- Define a global grid to get best possible latitudinal resolution. Grid size 0.5 MLAT and 1 MLT.
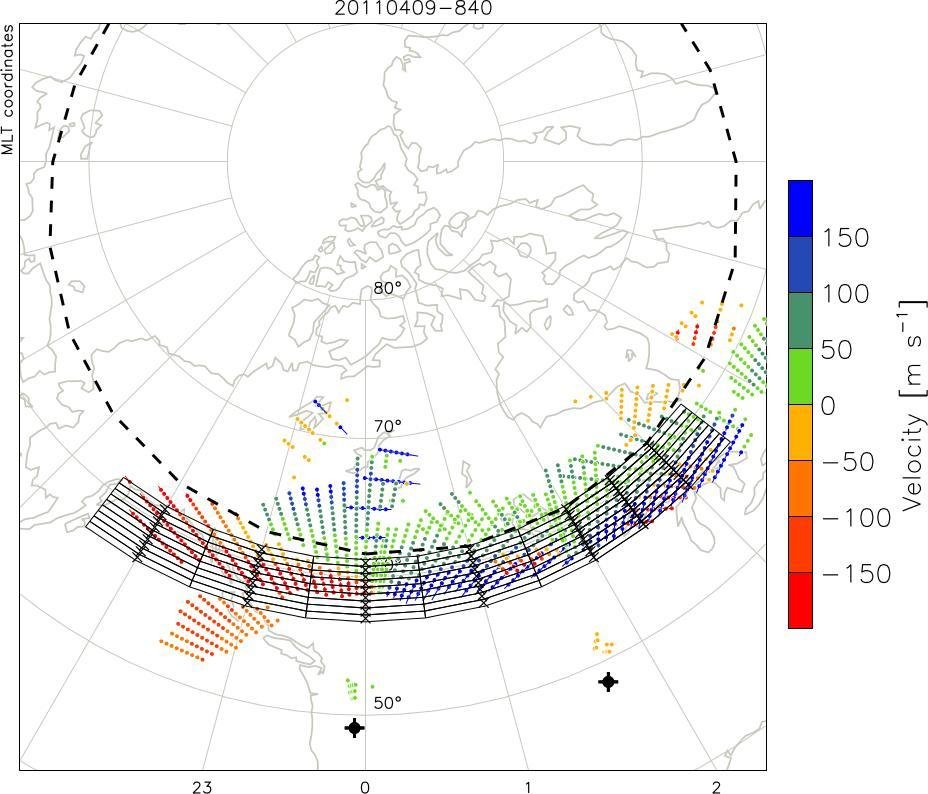
Estimating SAPS velocities
- Apply L-shell fitting at each grid cell. The MLT extent used to apply L-shell fitting is variable (1-3 MLT).
- Discard bad fits. Assume direction is same as closest good fit.
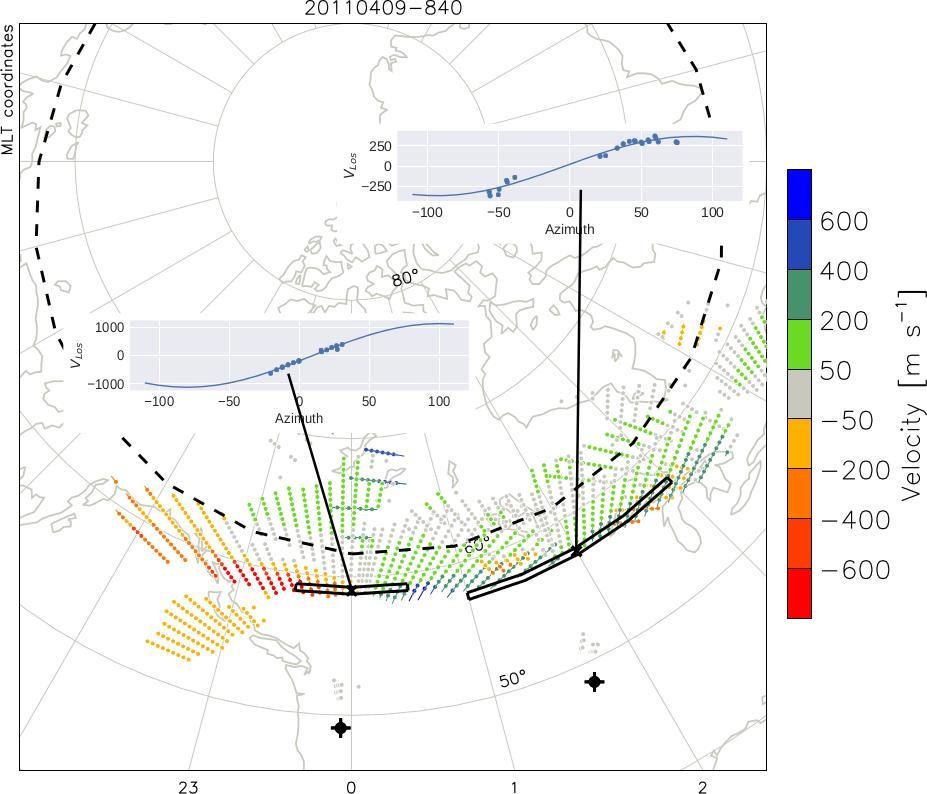
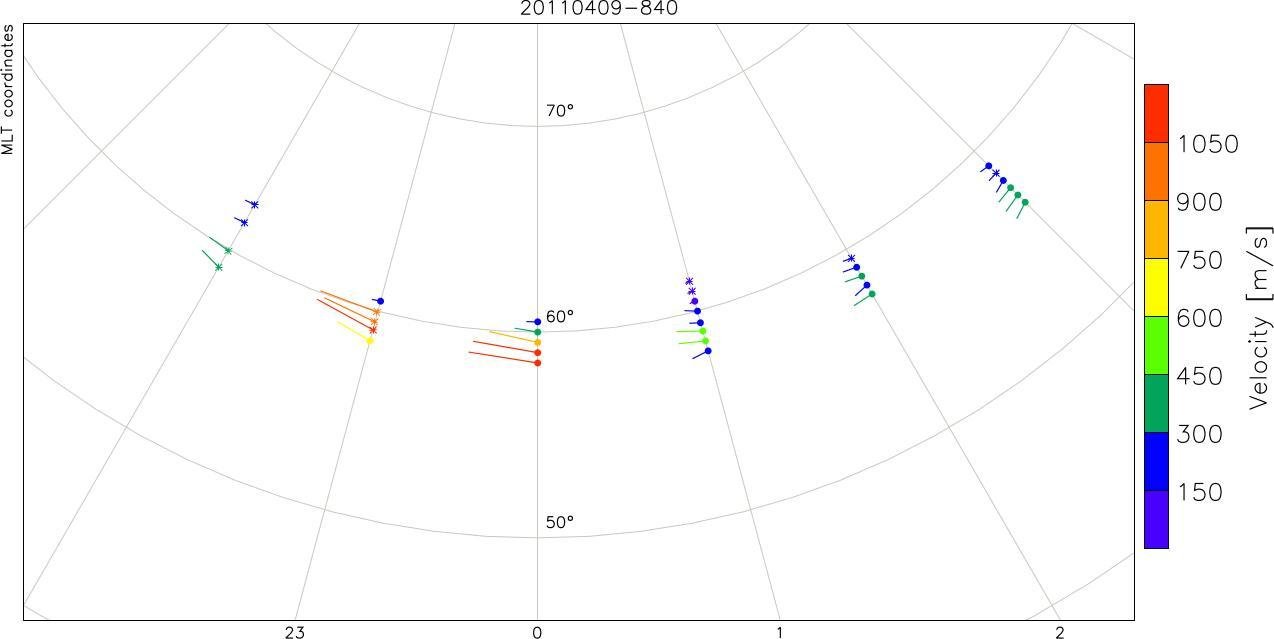
Estimating SAPS velocities
- Figure shows L-shell velocities.
- Circles indicate location with good L-shell fits. Asterisks indicate locations whose directions were assumed to be the same as the nearest good fit.
- Results are comparable to Clausen et al [2012].
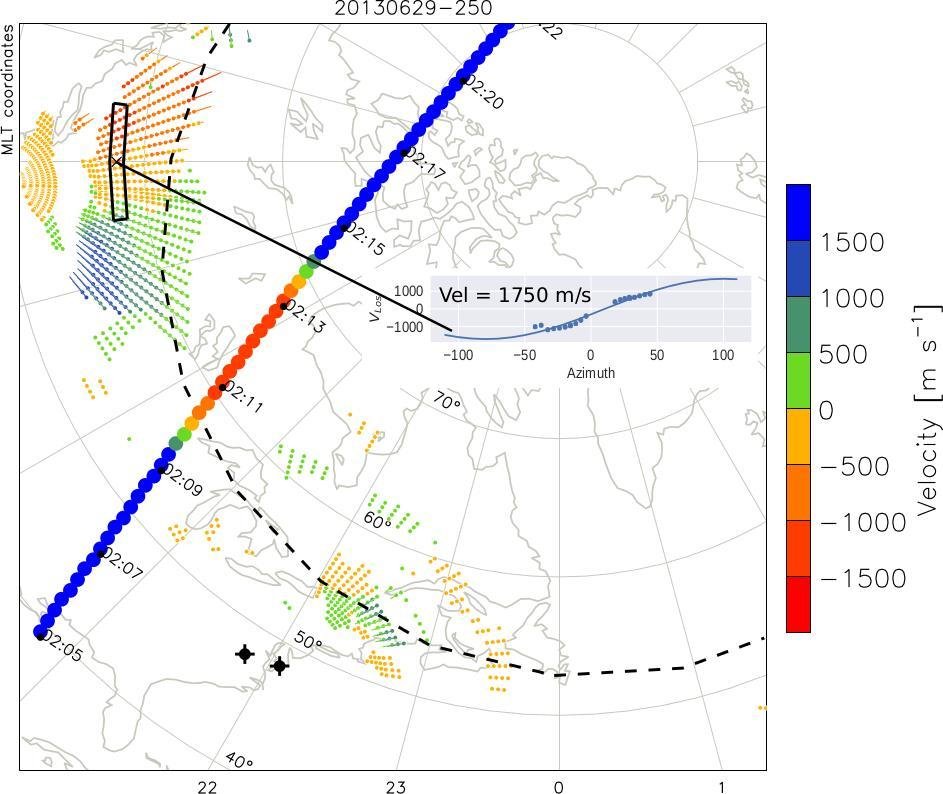
Velocity Range of SAPS - Higher end
- Event on 2013-June-29 at 0250 UT. Dst : -100 nT.
- During disturbed geomagnetic conditions velocities reach beyond 1500 m/s.
- Corresponding to E-fields greater than 100 mV/m.
Velocity Range of SAPS - Lower end
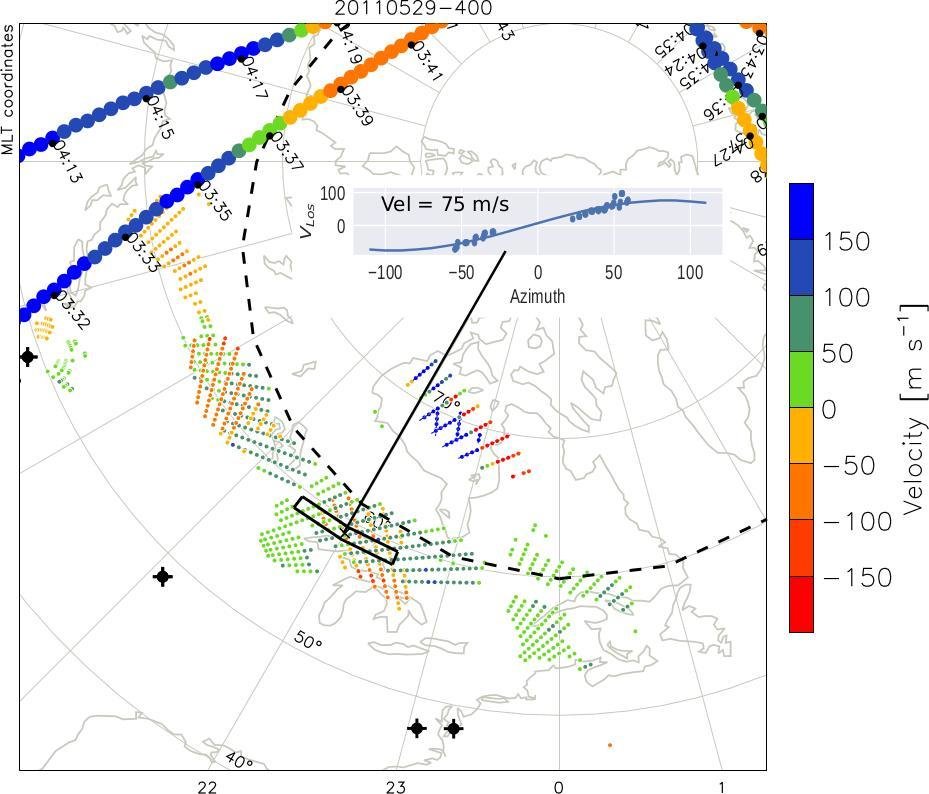
- Event on 2011-May-29 at 0400 UT. Dst : -31 nT.
- Velocities as low as 75 - 150 m/s are observed.
- E-fields < 5 mV/m are observed. Typically between 5-10 mV/m.
- Results slightly lower than estimated in Nagano et al [2015] (150-200 m/s).
- Lower E-fields are not sufficient for frictinal heating ( > 50 mV/m) [Schunk et al., 1975]
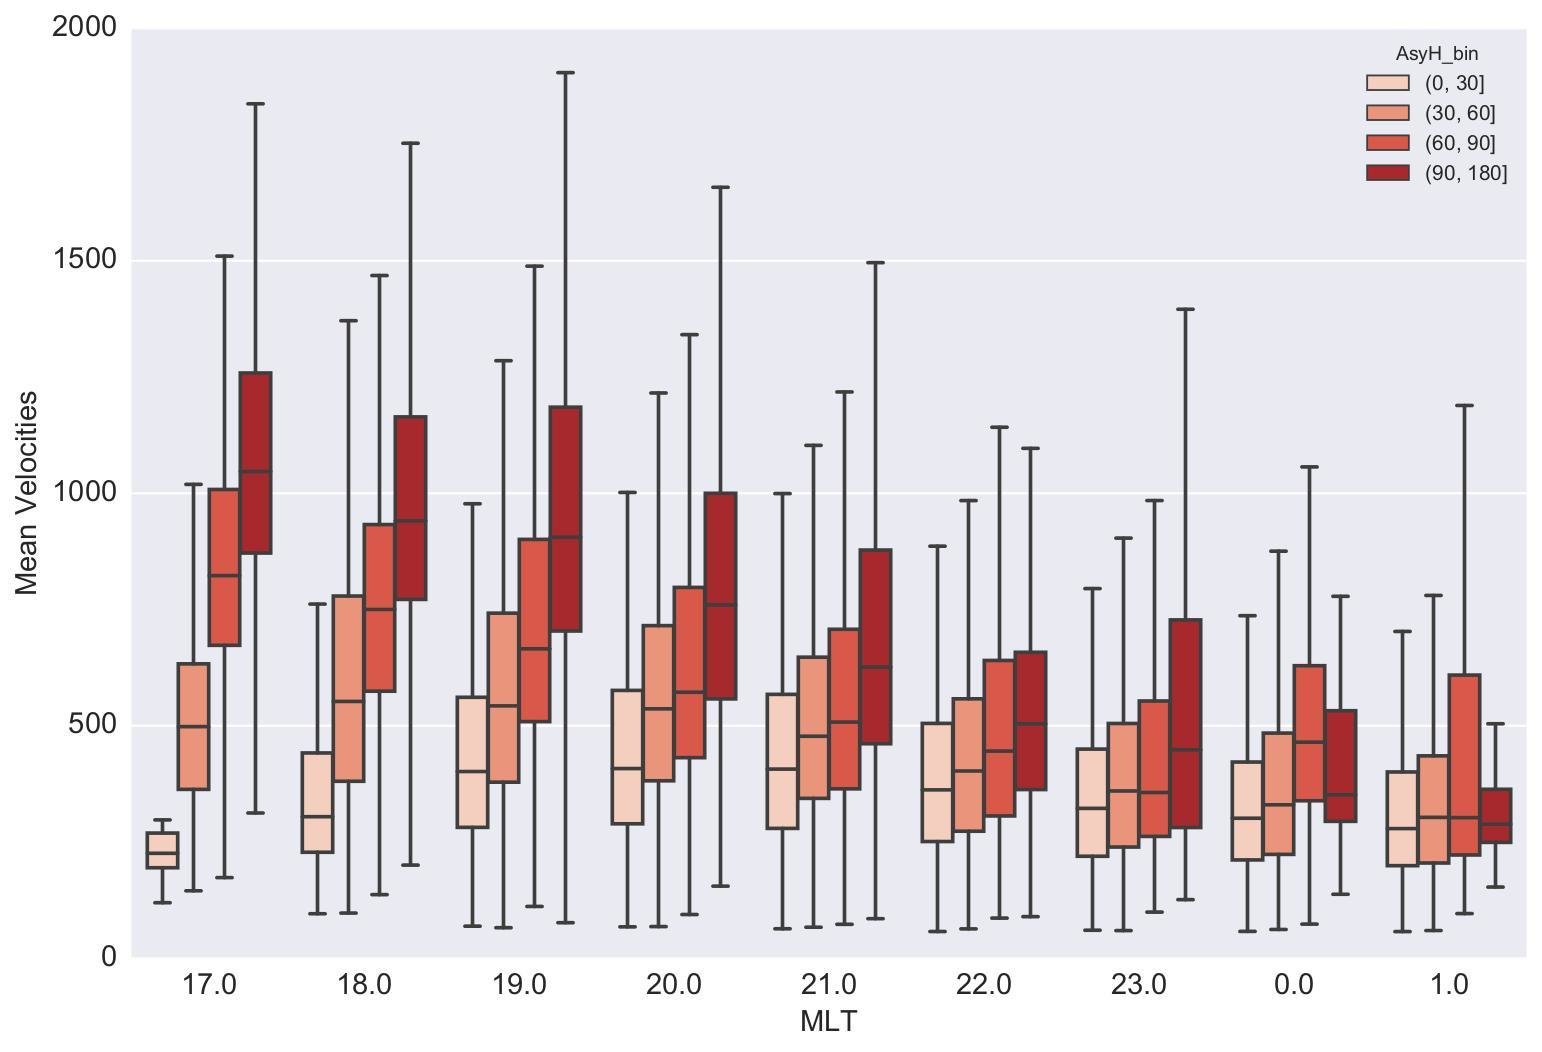
Average velocity characteristics - Magnitude
- Box plots of velocities at different Asy-H bins plotted vs MLT.
- During disturbed conditions, velocities increase towards dusk.
- Consistent with Erickson et al., [2011] and Foster and Vo [2002].
- Not much of a linear trend in quiet time SAPS.
Average velocity characteristics - Direction
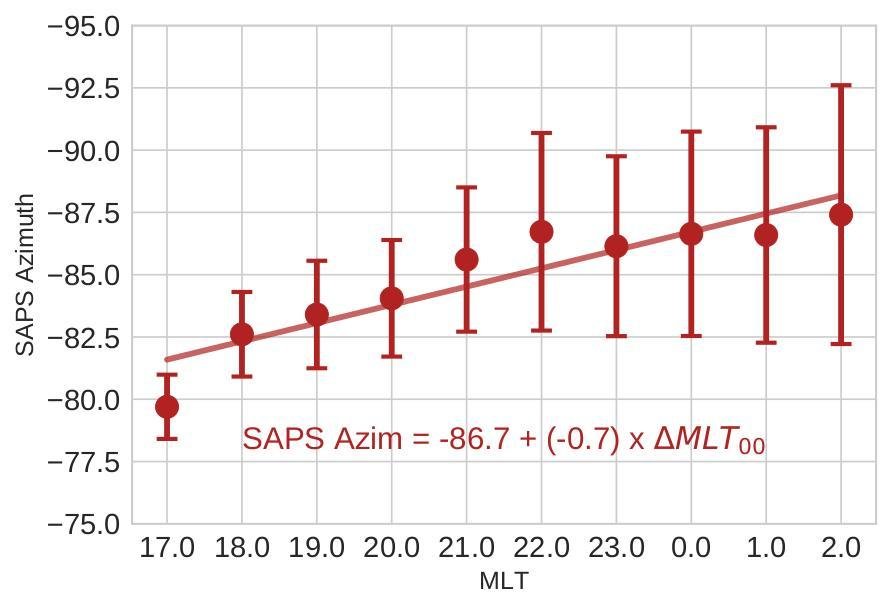
- Mean (and std. dev) of SAPS velocity directions.
- -90 is perfectly westwards.
- SAPS flows turn increasingly polewards towards dusk and at high latitudes.
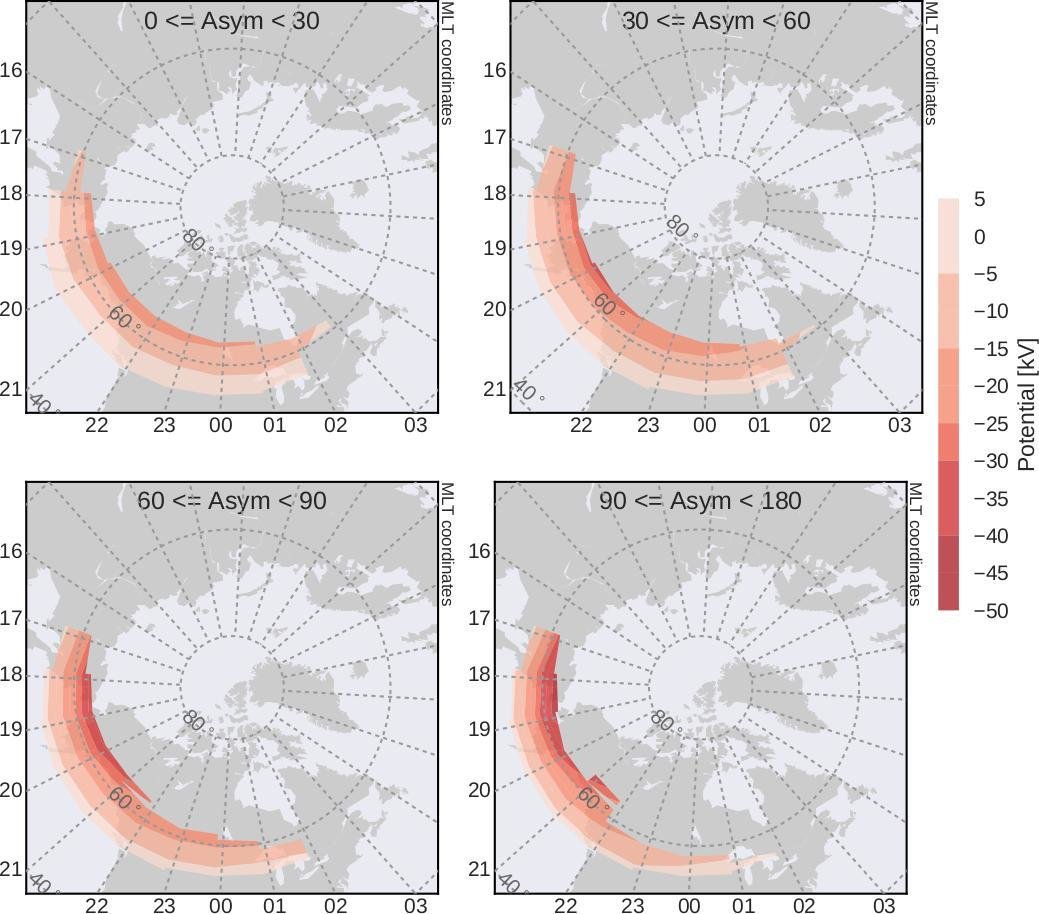
Average SAPS potentials
- Mean SAPS potentials at different Asy-H bins (derived by poleward integration of velocities).
- At highest disturbance levels potentials can be as high as 45-50 kV. During quiet times we can see potential drops up to 15 kV.
- Results are in agreement with Foster and Vo [2002].
- Goldstein et al [2005] used Foster and Vo [2002] average characteristics to develop a SAPS magnetospheric model (when Kp >= 4).
- Combining results from Kunduri et al [2017] and this study better SAPS model can be developed.
- New results on quiet time SAPS would be useful in understanding inner magnetospheric conditions.
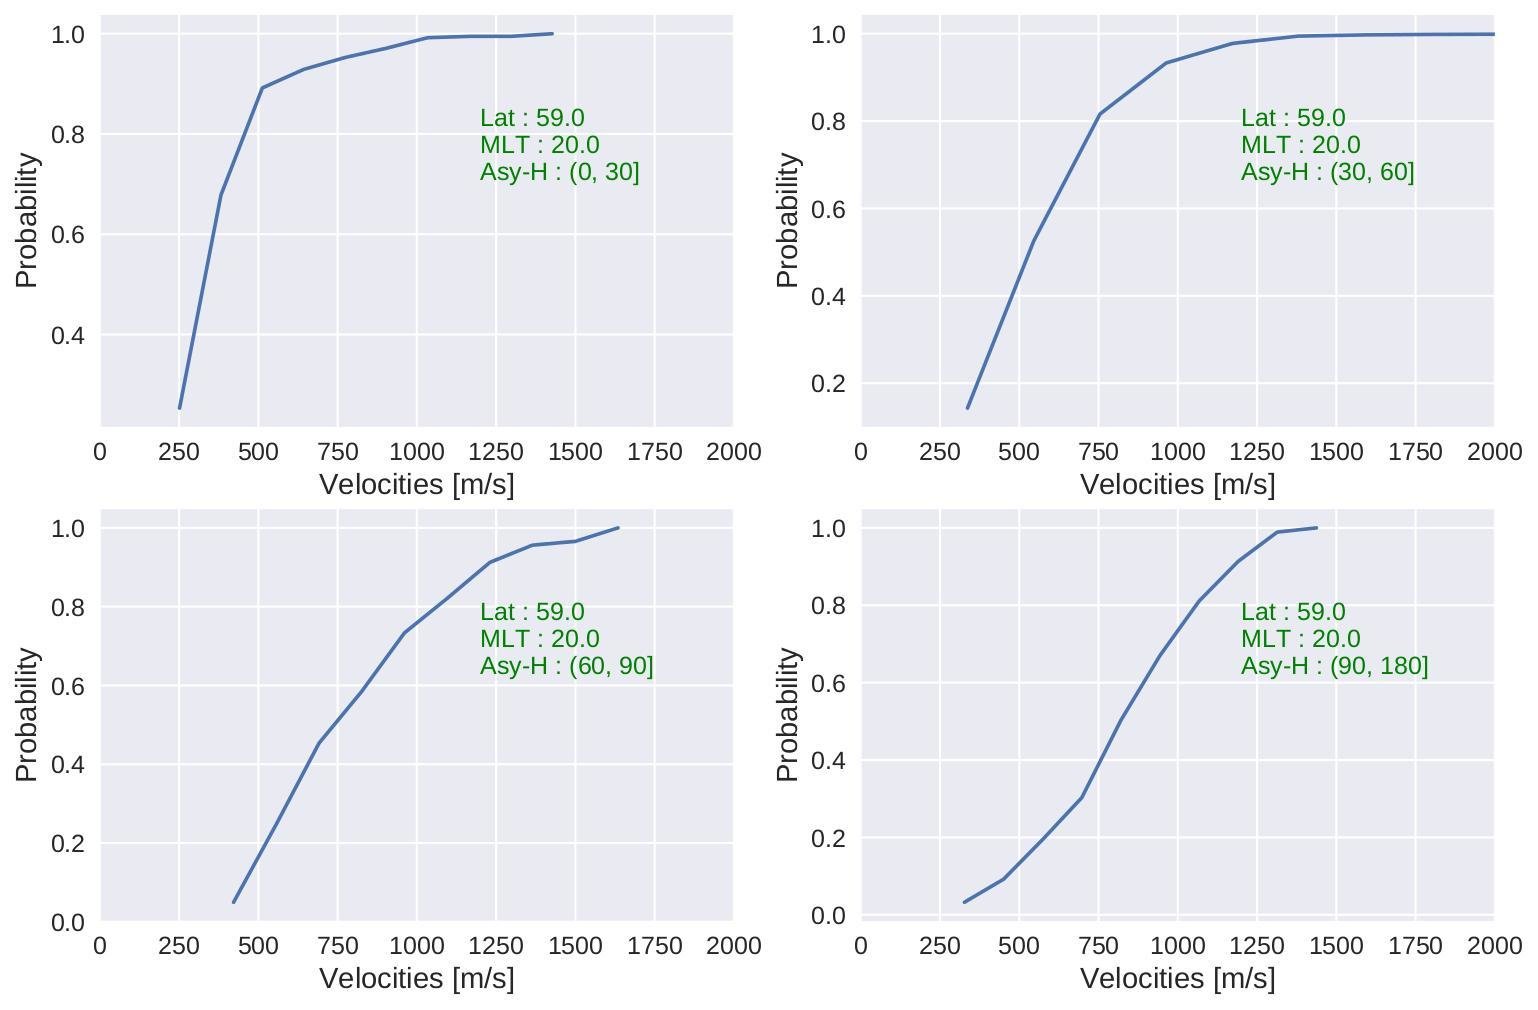
CDF of SAPS velocities.
- Cumulative Distribution Fucntions of SAPS velocities at different Asy-H bins for same location.
- For the lowest bin there is more than 80% chance that vel < 500 m/s is observed while for hte highest bin there is more than 80% chance that vel > 1000m/s is observed.
- Even for highest bin, there is 40 % chance that vel < 750 m/s is observed.
Conclusions
- Focussed analysis on SAPS velocities and potentials on a statistical scale at higher latitudinal resolution.
- SuperDARN observes SAPS under quiet geomagnetic conditions too. Some events with electric fields less than 5 mV/m and others where electric fields go beyond 100 mV/m are observed. Traditional SAPS mechanisms can't explain the low velocity events.
- SAPS velocities increase with geomagnetic activity and during disturbed times increase linearly towards dusk. Consistent with previous studies.
- Quiet time SAPS don't exhibit a linear relation with MLT.
- SAPS flows turn increasingly poleward towards dusk. They need eventually merge with high-latitude convection.
- SAPS potentials are similar to previous studies. Can be used along with the Kunduri et al [2017] SAPS location model to improve magnetospheric models [Goldstein et al 2005].
- Disturbed time SAPS velocities exhibit high degree of spread. Suggesting many factors such as ionospheric conductivity and high latitude convection influence SAPS velocities.
Efields-saps
By Bharat Kunduri


