Studying DNA methylation in Paramecium with PacBio sequencing


People :)

Bahin Mathieu
Bioinformatics
Co-encadrant

Eric Meyer - PI
Biology - Parameciology - Precisiology
Suzanne Marques (PhD student), Veronique Tanty (IE - PhD student),
Sophie Malinski (MCU),
Marc Désir (Intern)
Eric's Team:
Me
-
Former pharmacy student
-
First year PhD after a M2 internship
Introduction
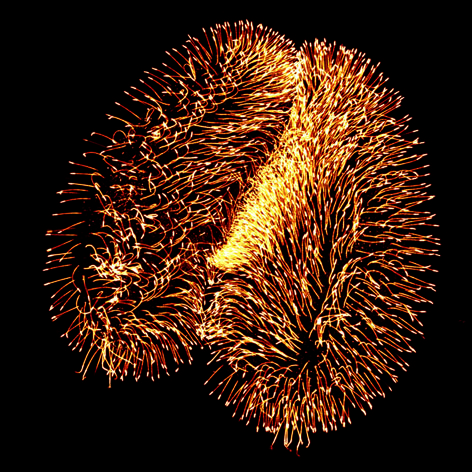
P. tetraurelia: Genomic architecture
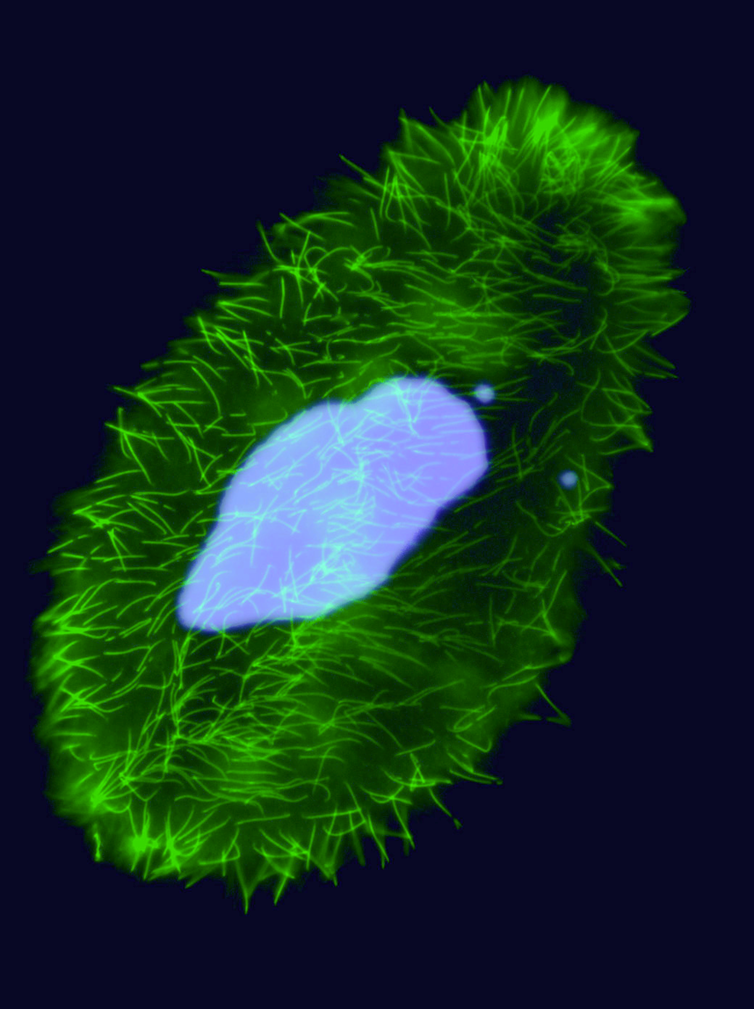
Unicellular eucaryote with 3 nuclei:
-
2xMIC nuclei (2n)
- Germline nucleus
-
Contains: TE & IES
- Transcription disabled !
-
1xMAC nucleus (up to 800n)
- Somatic nucleus
- Amplified and "fixed" version of the MIC
- Free from TE and IES
- Transcriptionnally active
DNA ratio: 1 MIC for 200 MAC
+ DIfficult to purify the MIC DNA
Up to 0.3 cm !
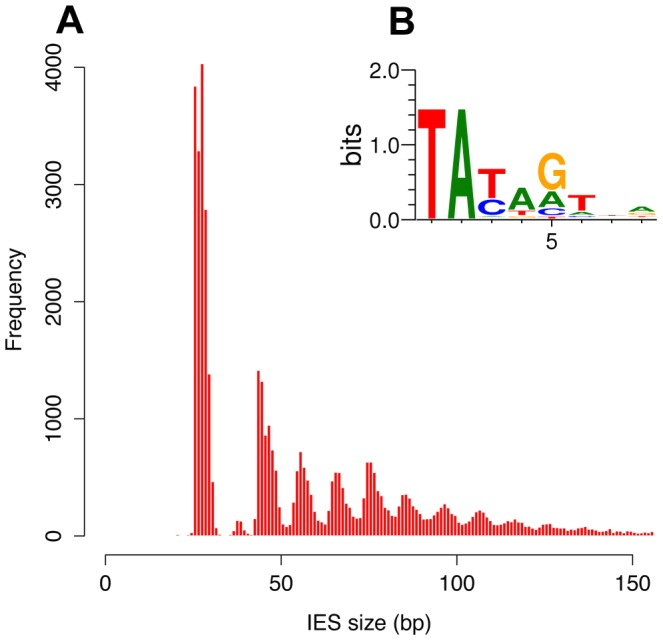
Profiling the IESs
- Non-coding sequences
- Remnant of TE ?
- Most recent IES are very short (< 27bp)
- ~ 100% TA-Bounded
-
Weak consensus TAYAG
- Not sufficient to recognize the IES
- Degenerated TC1-Mariner TE ?
- Periodic distribution of size
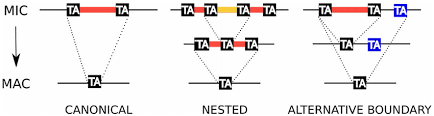
The canonical excision is variable and sometimes excision errors happen
Arnaiz O et al. The Paramecium Germline Genome Provides a Niche for Intragenic Parasitic DNA -2012
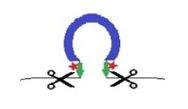
IES: Mechanism of excision
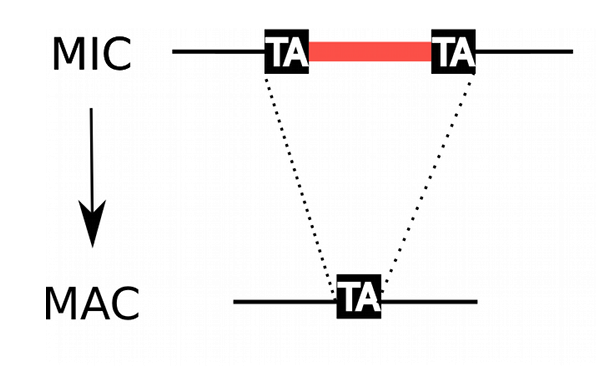
Unlike other ciliates, lots of IES locate inside coding sequences in Paramecium
Suppression of TE/IES in the MAC: Avoids the negative effect of TE and IES
Requires a very precise excision
~ 100% PGM-dependant excision


PiggyMac
IES
IES recognition ?
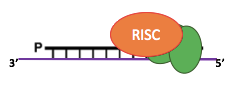
The ScanRNA pathway ?
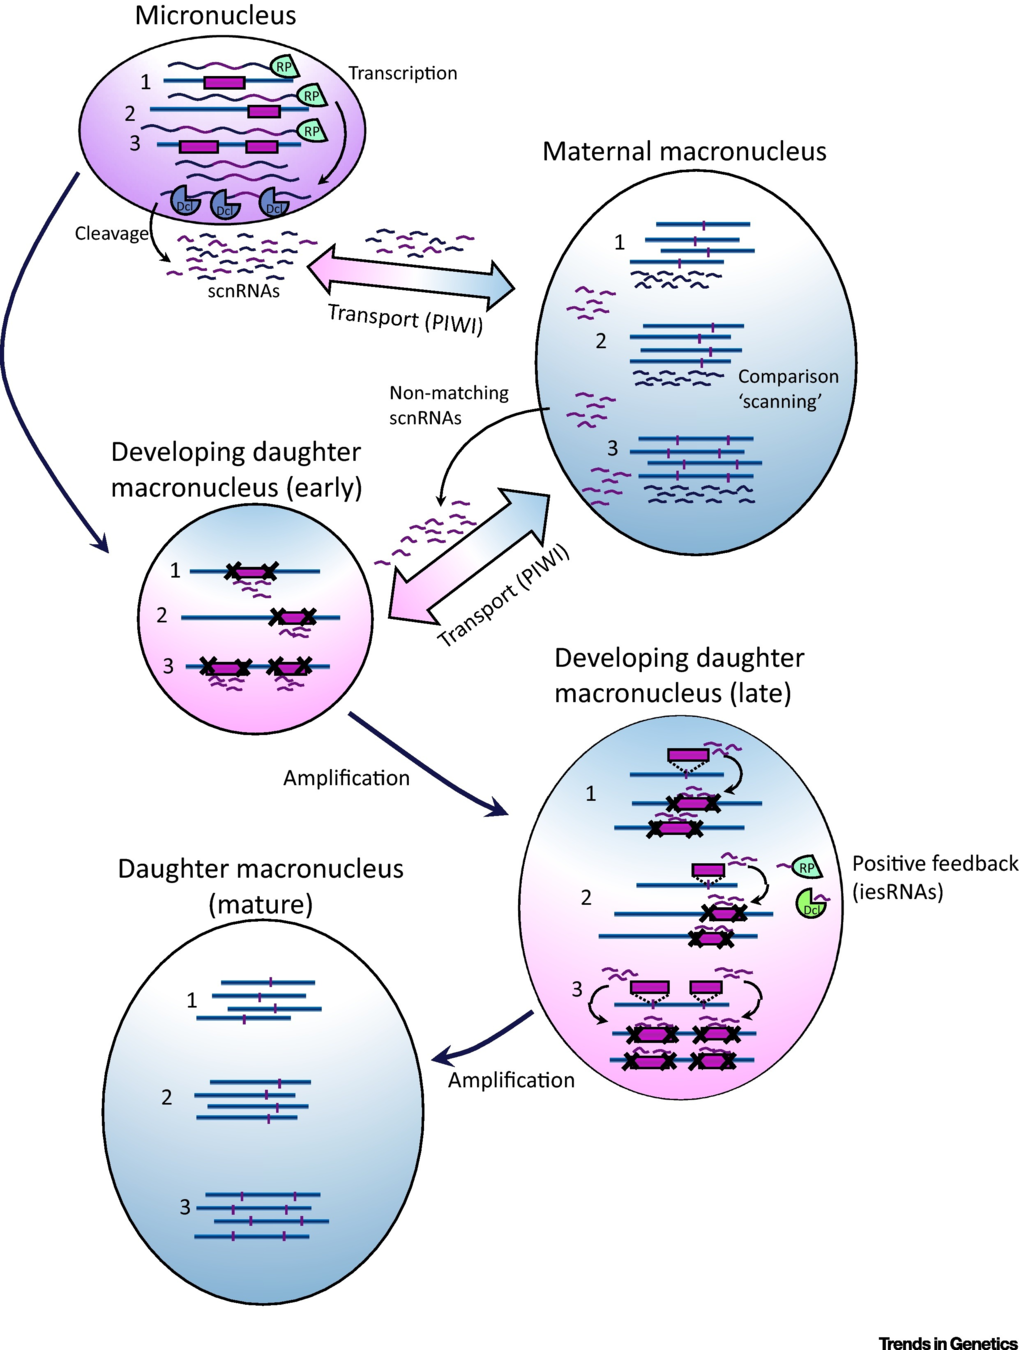
10% of IES are scanRNA dependant.
30% of IES are small-RNA dependant (shown by DICER-like silencingà
- What about the majority remaining ?
PhD Project
One big question remains: How does the cell recognize the Scan-RNA independant IES ? --> vital issue for the cell
2 independant hypothesis:
- Those sequences can be permanently marked in the MIC by a DNA methylation pattern
- Some motifs or specific nucleotide composition might differenciate these IES from the rest of the genome
Which epigenitic modification should we look at ?
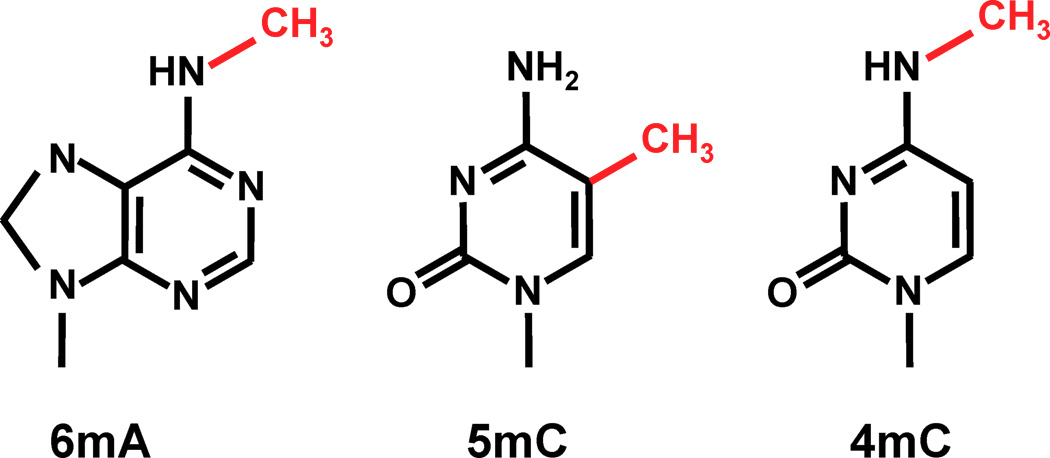
n6mA is one the the 3 most frequent known methylations in DNA
6mA likely to be abundant in Paramecium:
-
Suspected 2.5% in P. aurelia by Cummings et Al (1975)
- Detected methylation by SMRT in the MAC in our lab (unpublished data)
- Detection by SMRT in the MAC by Sandra Duharcourt's lab (unpublished)
- Detection in Oxytrichia by L. Landweber et Al (2019)
Other DNA modifications are also candidates for our hypothesis
25x 250x 25x
Materials and methods
Identify methylase candidates
- Identification done befof n6mA DNA methyltransferases
- Done before I arrived in the lab
RNA silencing
Candidates:
- 7 "DPPW motif IV" genes
- NM4, NM9, NM10 studied in our lab
- others are studies by collaborators
- And other family: MT1a, MT1b, MT2
PacBio SMRT sequencing
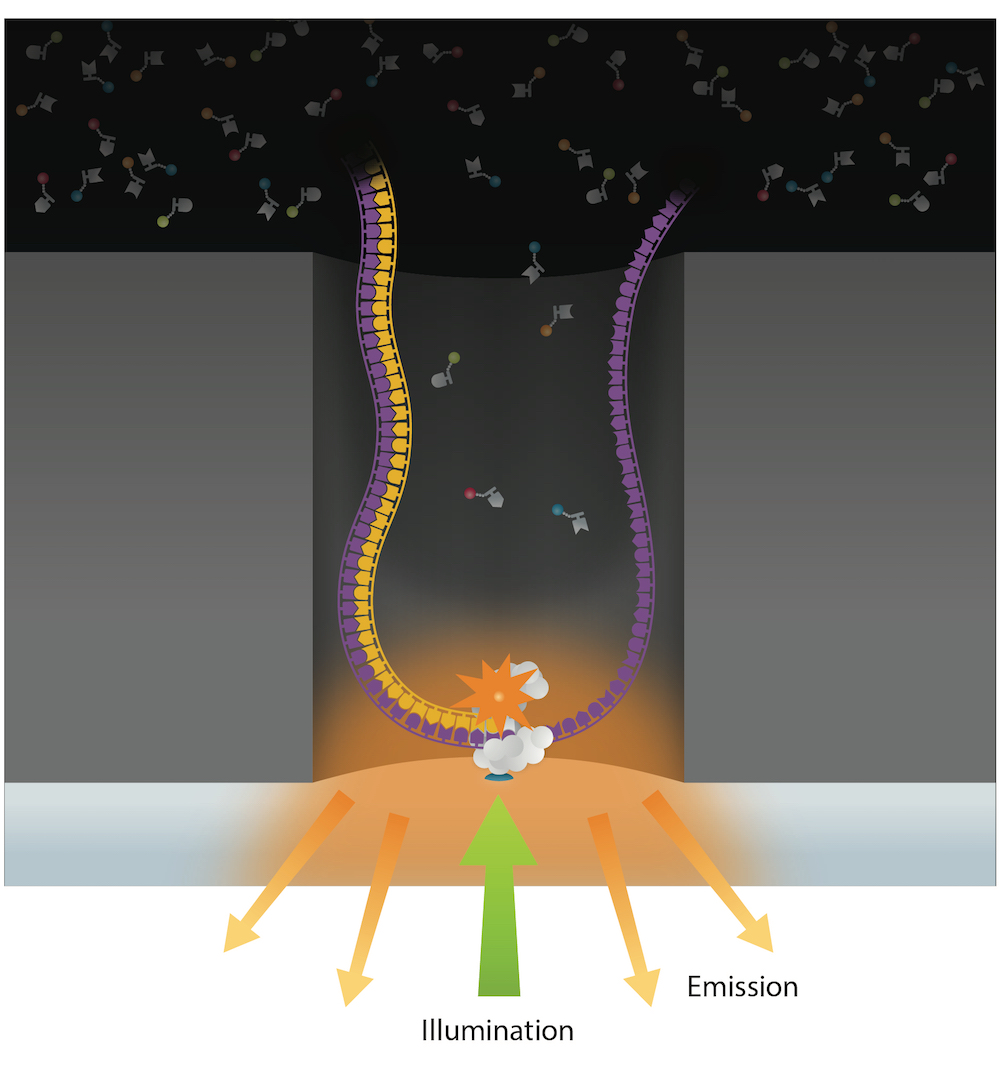
99% accuracy
Max
75% accuracy
Methylation analysis needs local coverage> 25X
- IPD are captured and compared either with WGA or Trained model (ML - "in-sillico control")
- Allows detection of suspect downturns of polymerase (function of the -3/+8 nt context)
Reads up to 80 kbp
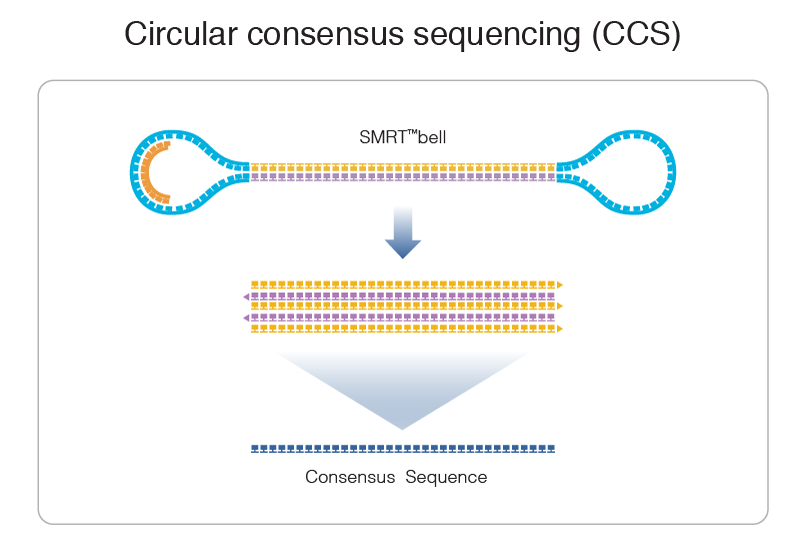
Analysis of methylation
Two-different approaches
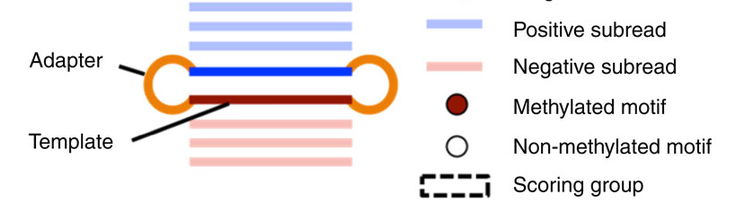
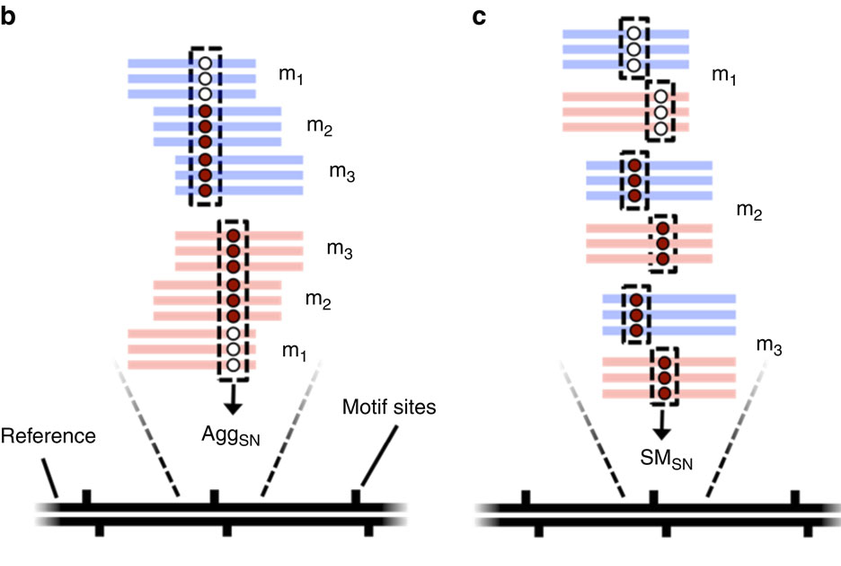
Pooled analysis of different molecules (default - Aggregation)
Analyze every molecule independantly from the others
(Needs shorter inserts - multiple passes)
Beaulaurier et Al 2015
AggSN or SMSN ?
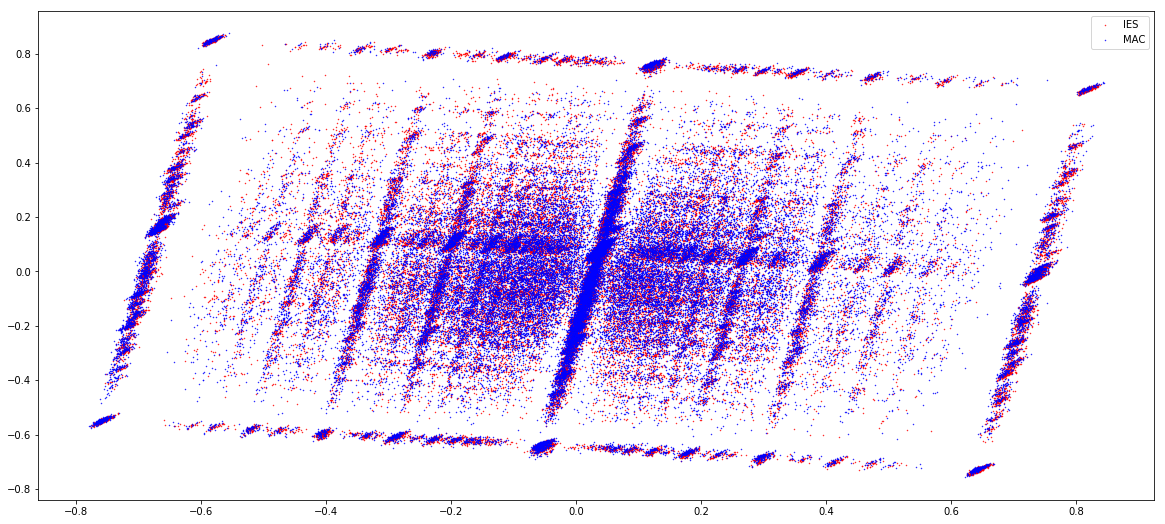
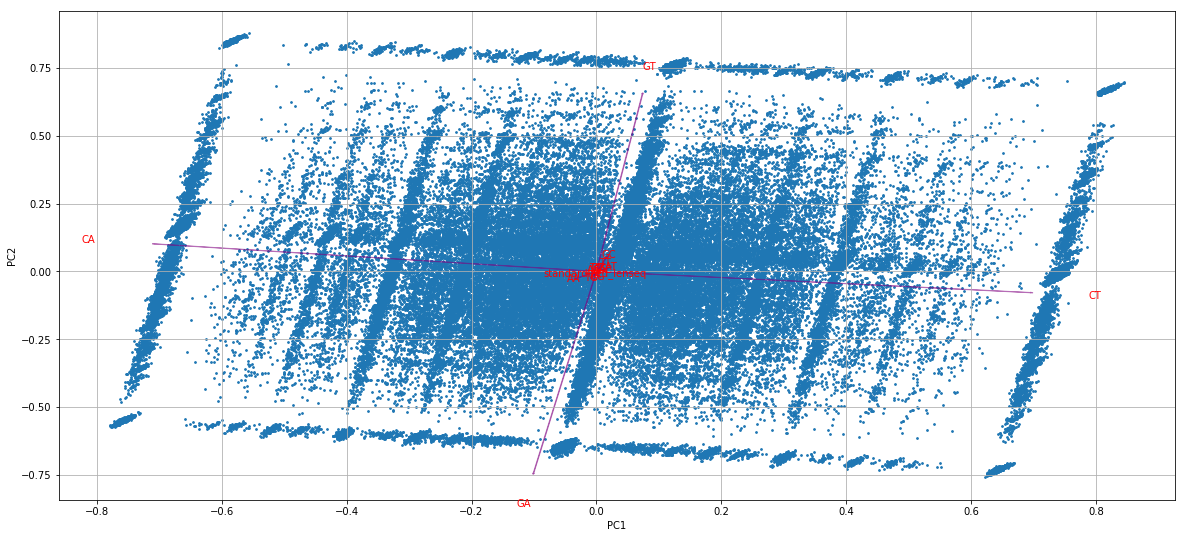
Within the total DNA:
- MAC/MIC dna ratio = 200:1 --> Random sampling
- We don't want to mix MIC and MAC information
- We must use the SMSN method !


SMSN implemented on Github by J. Beaulaurier
But:
- Old RSII data
- Doesn't support new formats
- Very concerning bugs
- Doesn't work with in-sillico control (which is not benchmarked)
Using SMSN in our case is mandatory but also new, and requires to develop our own tools
--> "true_smrt" python package
Available data at day0
PacBio sequencing
- Short insert strategy (SMSN)
- No WGA data
Wild type:
- Vegetative Cell (HTVEG)
- Post autogamic cells 2h (HT2)
- Post autogamic cells 6h (HT6)
Silencing of methylase candidates:
- Si/MAB
- Si/MT2
- Si/MT1A-1B
- Si/MT1A-1B-2
- Si/NM4-9-10
- Si/NM9-10
- Si/NM4
Also: AggSN of PGM32
Objectives
- Sort our sequences between MIC, MAC, IES, etc
- Understand / Retro-ingineering of PacBio programs
- Develop our own pipeline of methylation analysis that can work with .bam format, Sequel I Data, in-sillico control
- Check our pipeline and calibrate our scores
- Analyze the n6mA methylation in paramecium
- Decipher the difference of methylation between scanRNA-dependant IES and scan-RNA independant IES ++
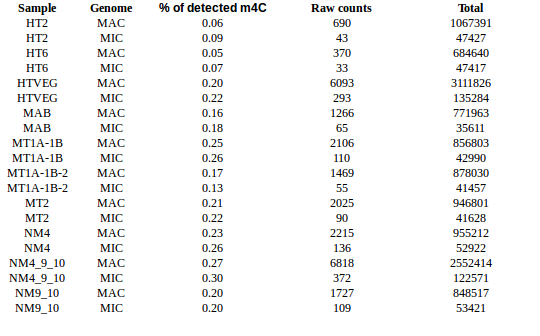
- About other modifications: m4C ?


1. Sorting of the sequences
Sort the sequences
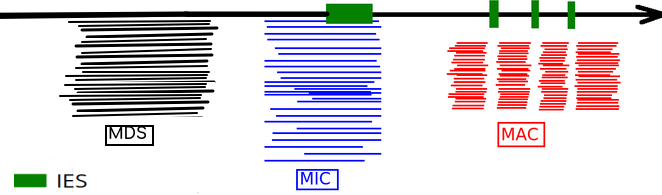
- High number of passes <=> accuracy >99.9%
- Possible to determine where it comes from
Many categories:
- MDS
- MIC
- MAC_TA_Junction
- We also separate mitochondrial DNA, RDNA, and unusual paramecium DNA
- Contaminants and low quality reads
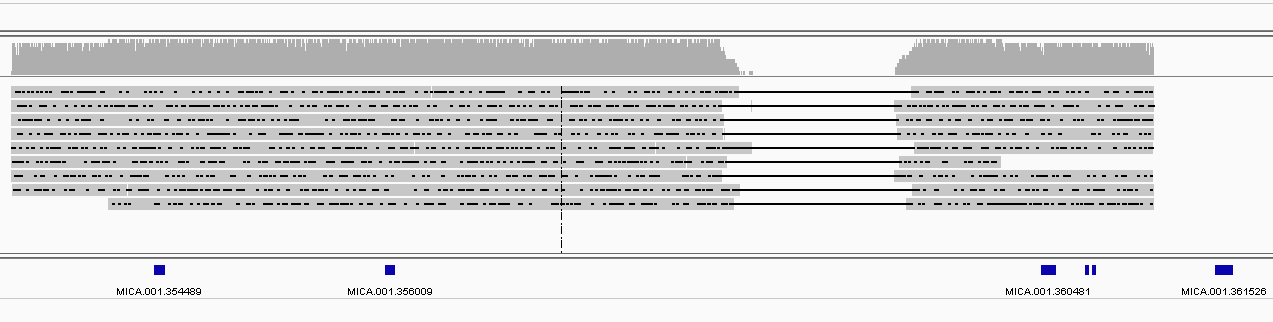
IES retained in the MAC
IES retained 1% of times in the MAC
=
2x chances of comming from MAC than MIC when fished
(Reminder: MAC/MIC = 200:1)
To avoid this
- We used retention data from 4 sequencing
- We filtered to just retain the IES of best retention scores
- This removes ~ 50% of our IES-containing sequences
I call the sequences that passed this filter "TRUE_MAC_IES"
pt_sort
Inputs:
- MAC, MAC_IES and MIC .fasta references
- Sequences to sort (raw pacbio .bam file)
- .gff of IES annotations in MAC_IES
- .gff of TA junctions in MAC
- MITO and RDNA .fasta references (facultative)

Outputs:

Example
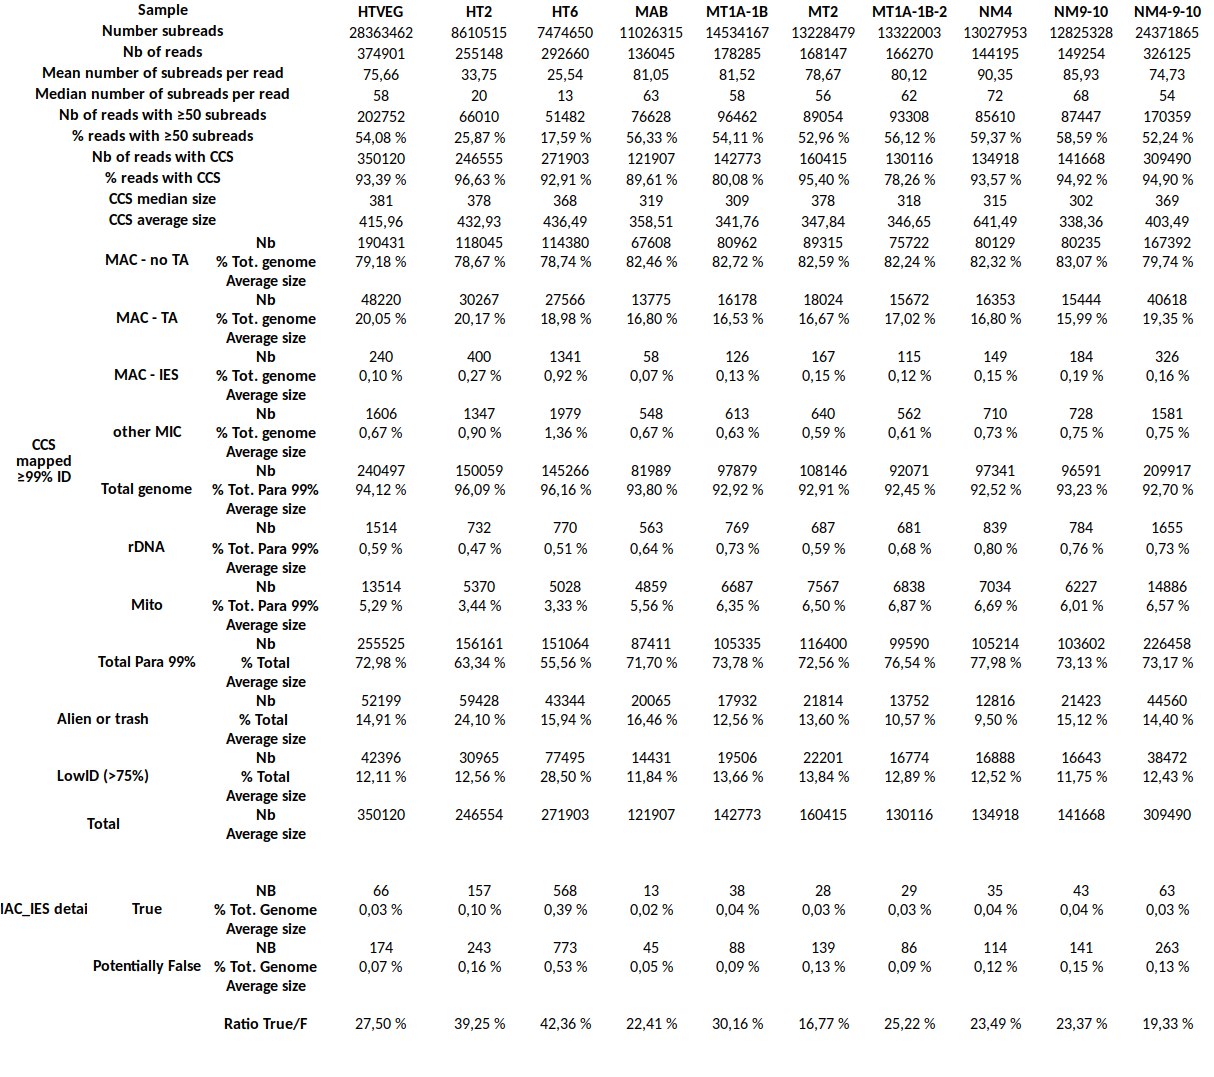
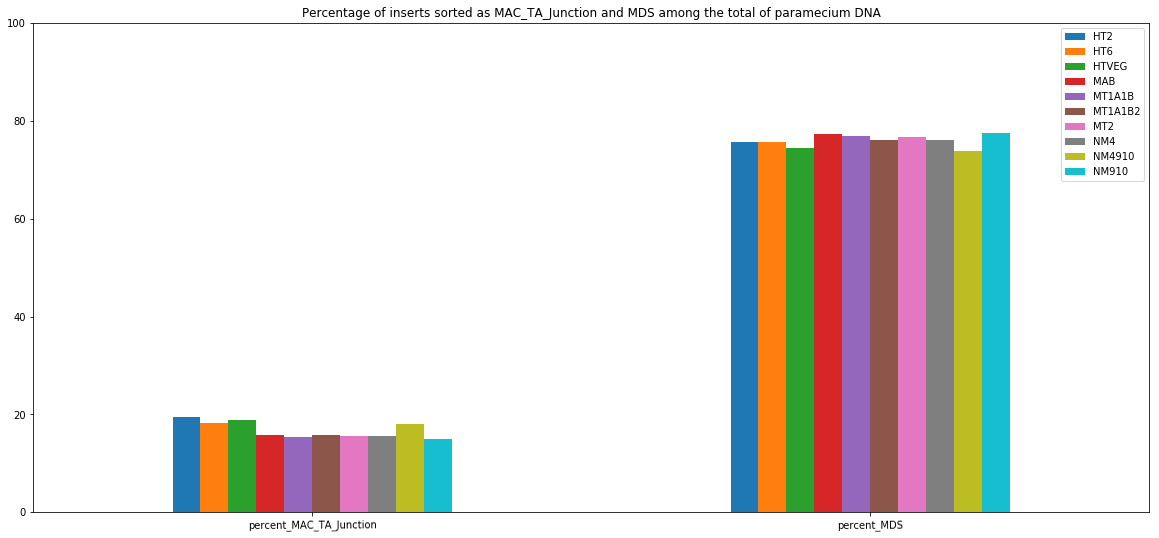
MDS and MAC_TA_Junction represent a vast majority
MIC specific and IES are as rare as expected
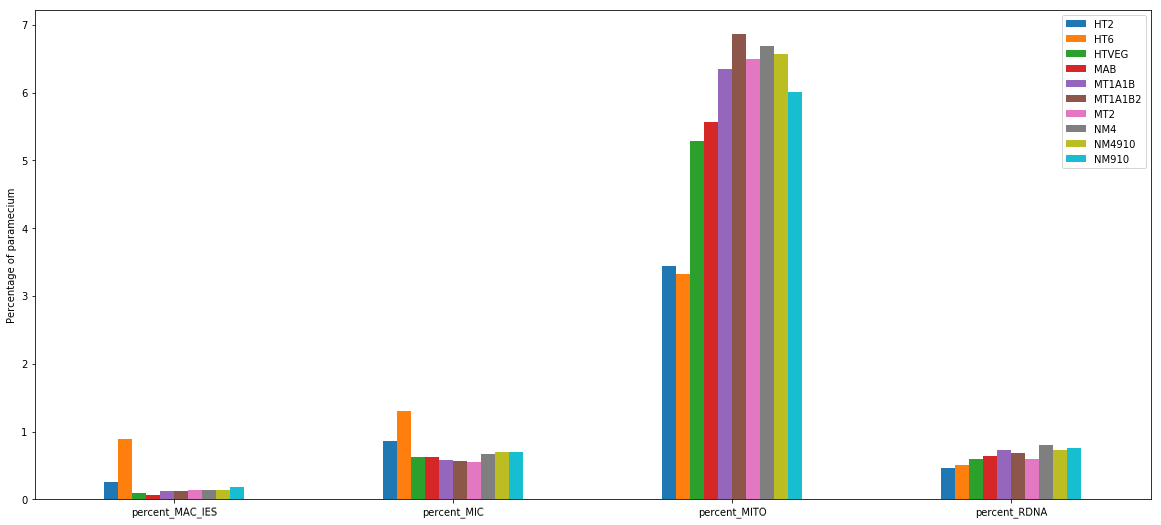
+ Applying the retention filter divides the number of "MAC_IES" approximately by 50%
Conclusion on the sorting
- We reach the expected theoritical counts
- Statisfying implementation
- Hand checking of many IES OK
Only works for >99% accuracy inserts
We consider it done ! :)
2. Understanding / Retroingineering of PacBio's softwares
Motivations
- REMINDER :
- No tool existed for our kind of analysis:
- SMSN
- In-sillico control
- .bam format PacBio Sequel I
- We had to develop our tools
- First idea = Just customize the PacBio pipeline
Main problems encountered:
- The capping of IPDs
- Use the in-sillico model
2.1 Retroingineering
A lazy polymerase
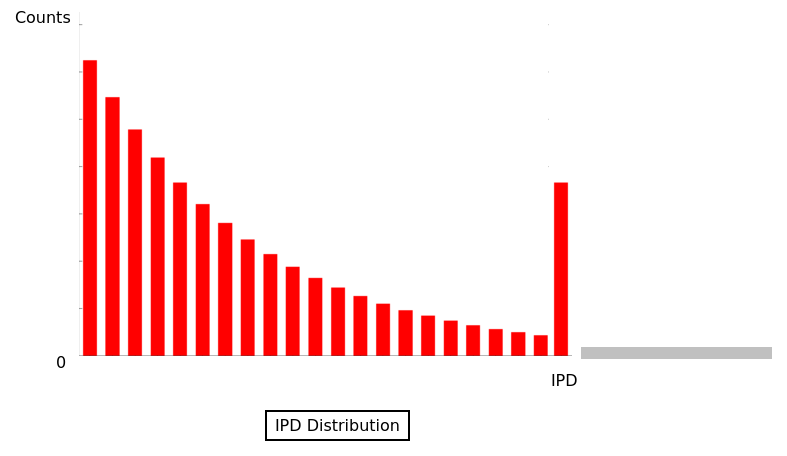
- Pauses
- Not related to DNA methylation
- Averaging is impossible with the pauses
- Outliers that must be removed
After rigorous checking, I stated that the capping as implemented was not a problem for our SMSN approach
2.1 Retroingineering
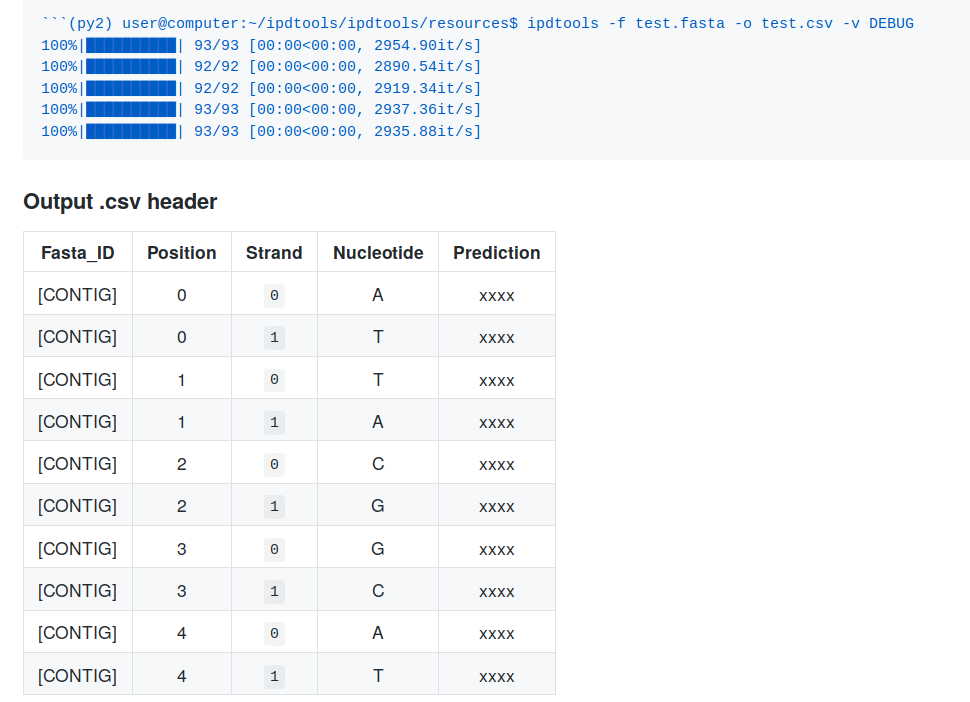
In-sillico control: ipdtools
- In-sillico control = Prediction of the polymerase speed (IPD)
- Black box
- Impossible to use without PacBio's default software !
Recently, I have coded ipdtools. It predicts:
- Any IPD of unmethylated sequence
- With any PacBio's chemistry (RSII, Sequel I, Sequel IIv2)
3. Developping our own pipeline
Problems that we solved:
- Launch the methylation analysis program for each molecule separately
- Produce the right inputs (headers, indexinf files, etc)
- Produce outputs even in case there is no modification found
- Parallelize everything
- Optimizations on the alignment process
Develop our own pipeline with PacBio's tools
"smrtrue"
Private Github repository
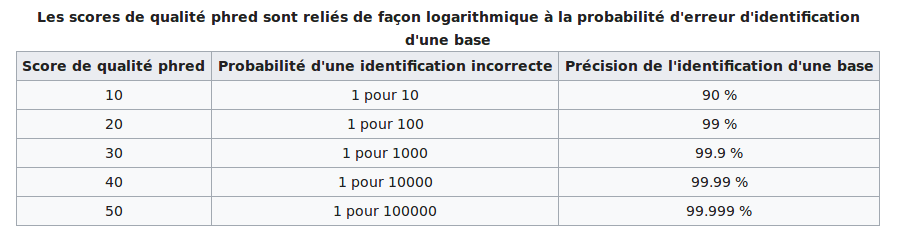
Can we extrapolate the original Pacbio scores for SMSN ?
Score distributions: The case of the adenines
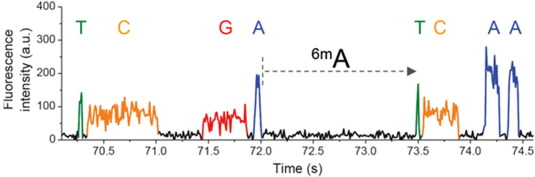
For n6mA, PacBio produces:
- A modification score --> Slowing of the polymerase
- An identification score --> Kinetic signature of a modification
They are PHRED-transformed p-values of two different statistical tests, that rely on the mean of the IPDs
PHRED scores
The scores are PHRED-transformed p-values
Typical covscore plot
Modification score / coverage
Using flat threshold on modification score = Hudge lack of power
Coverage-dependant threshold
We implemented two thresholds that are function of the coverage:
- A Gaussian Mixture Model (GMM) trained on MAC HTVEG
- A very simple linear equation

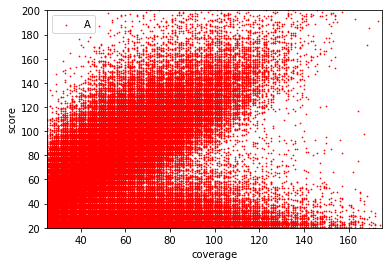
For other modifications
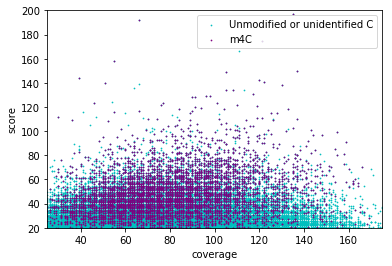
- Other modification (m4C, m5C) don't have this linear correlation with the score
- Arbitrary flat thresholds are mandatory
Extrapolation of PacBio's scores
Pipeline calibration with our E. coli contaminants
E. coli methylation
In E. coli, from litterature:
1 to 2% DNA-n6mA
Almost 100% of the methylation is located in the GATC sites
Some methylation outside GATC is maintained by specific motif-driven enzymes
Almost all GATC are symetrically methylated
We could verify it :
- Check our pipeline
- Check if it is relevant to use PacBio's scores in SMSN
- Should we use flat thresholds, GMM or a linear equation ? Which idQv ?
Analyze E. coli data should reasure us and give us insights of our specificity and sensitivity
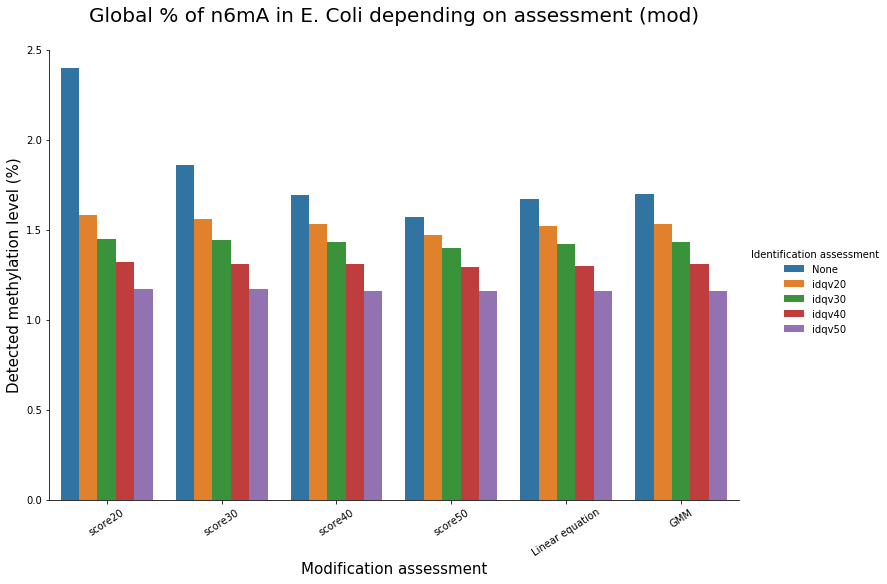
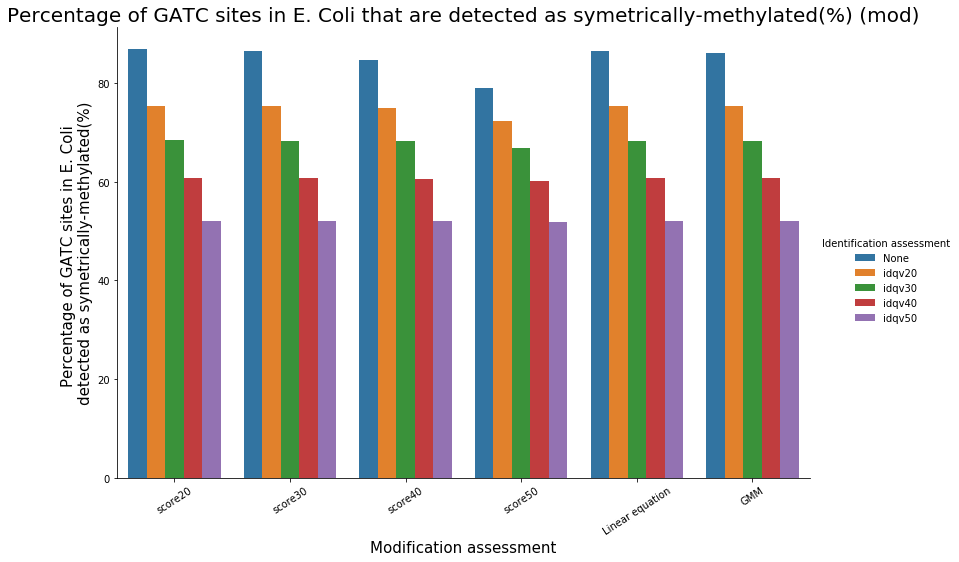
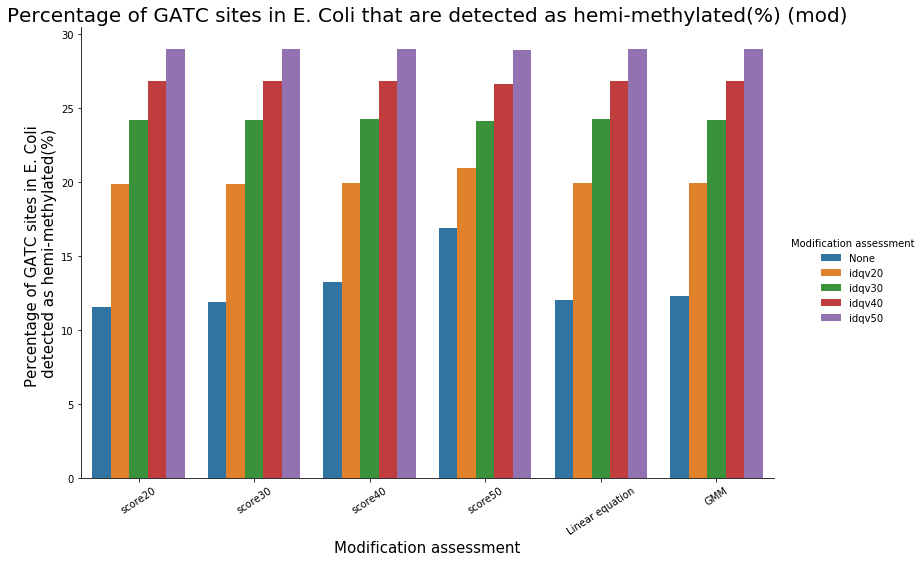
Identification assessment
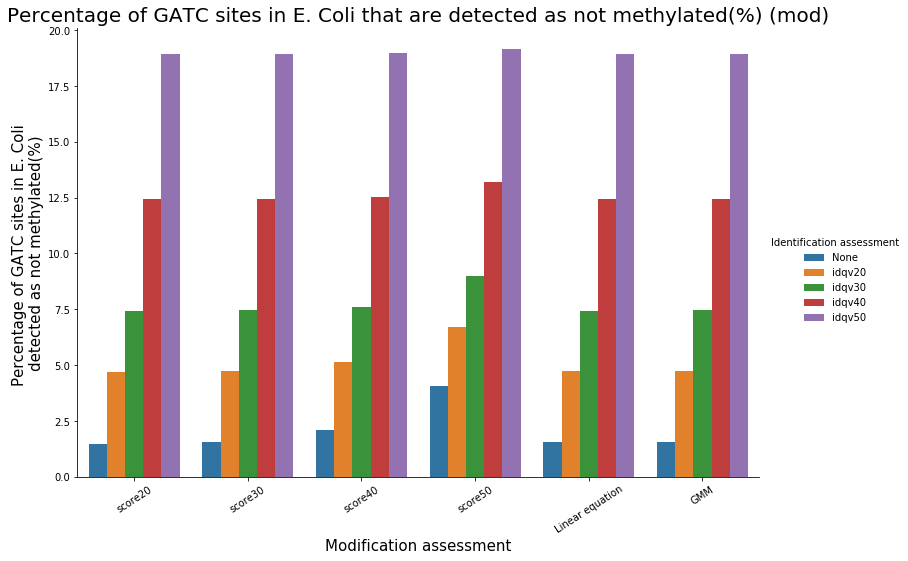
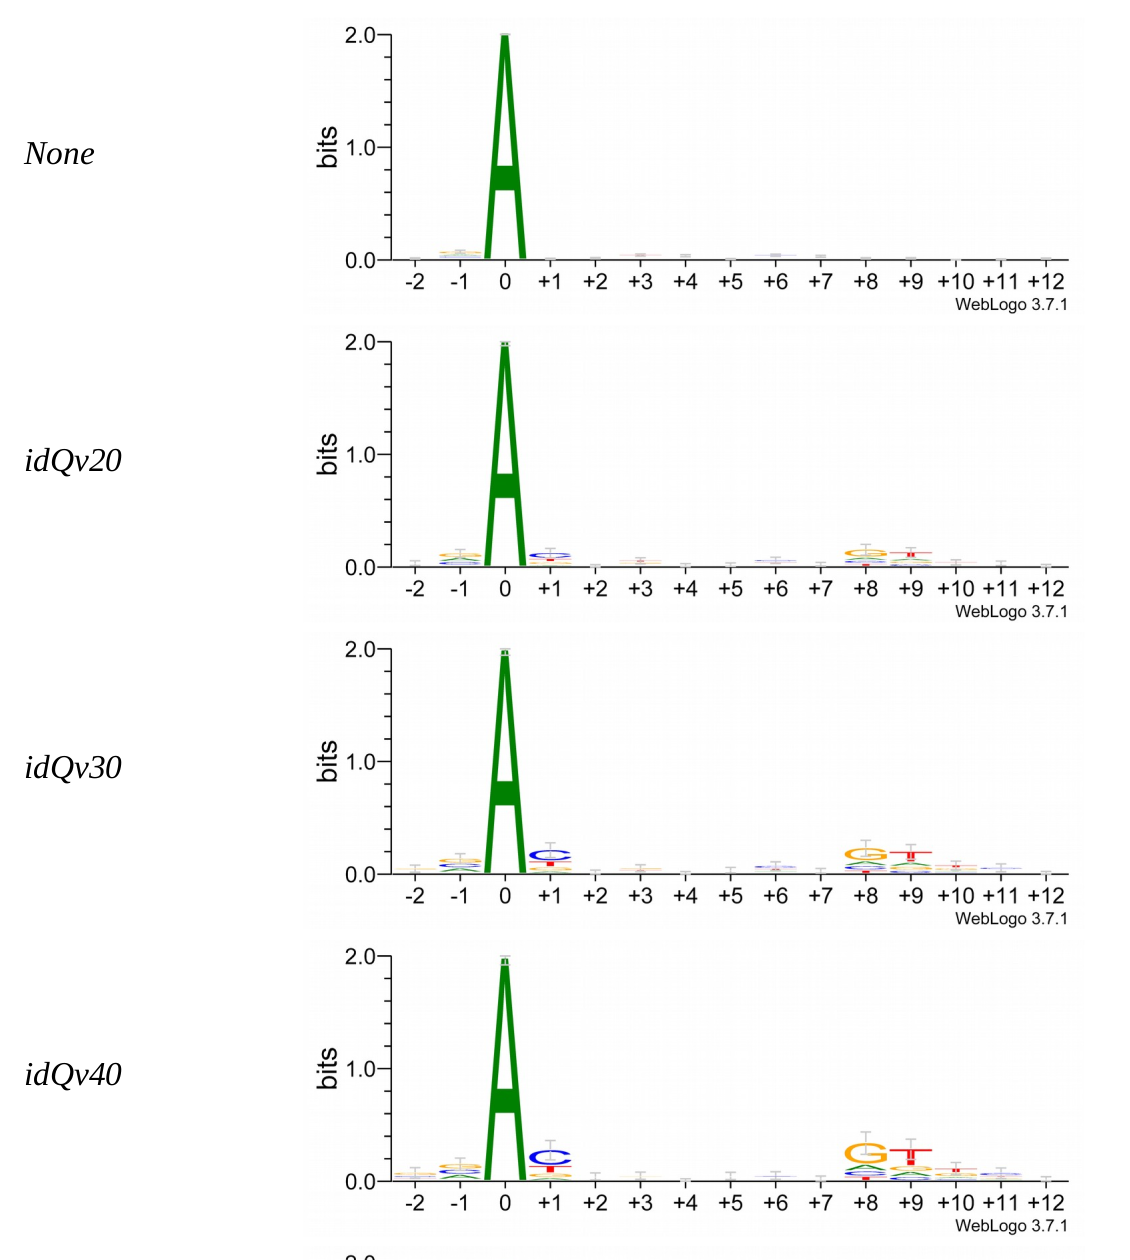
Methylation outside GATC sites
Modification assessment: Score20
Methylation outside GATC sites
Modification assessment: Linear equation
To conclude on our score calibration with E. coli
- Never 100% of GATC ! Only ~ 75% symetric
-
LInear equation > GMM > Flat threshold
- Seeking rare events requires higher specificity
-
Adding any idQv provide much higher specificity
-
We can draw only quite limited conclusion on these data from contaminants otherwise
- Digested DNA ?
- Unconsistent litterature
- Specific methylation of this E. coli strand ? ~
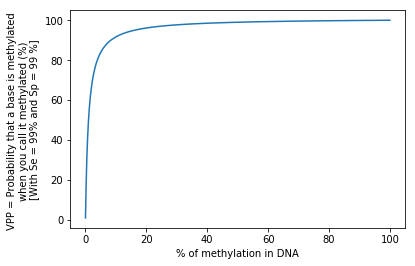
The Bayesian ambush
What we should take care of when analyzing Paramecium's data
Let's admit that
We measure methylation in E. coli
We have a no-so-bad test:
99% Sensitivity = P(D | M)
99% Specificity = P(ND | NM)
Our global fraction of n6mA among all adenines is around 1%
- How much n6mA will we detect ?
- What's the positive predictive value ? (PPV) that is P(M|D)
1.98%
~50%
Half of our detections will be false positive
P(A|B) != P(B|A) unless P(A) = P(B)
The FDR varies with the real methylation fraction
The testing dilemma
- Our test gives us the proportion of n6mA
- But we need the proportion of n6mA to estimate de proportion of n6mA
Ex: Here we measure 1.58% for a real proportion of 1%
Let's push it a little forward...
in E. coli
In E. coli, the litterature tells us that we can have:
- 1.58% of n6mA
- Proportion of adenines in an AT site: 26.9%
- >95% of methylation located in GATC sites
- Almost all GATC sites that are methylated are actually symetrically methylated
- P(M2 | M1) = P(M1 | M2) ~ 90%
What happens then ?
With a such conditions in E. coli:
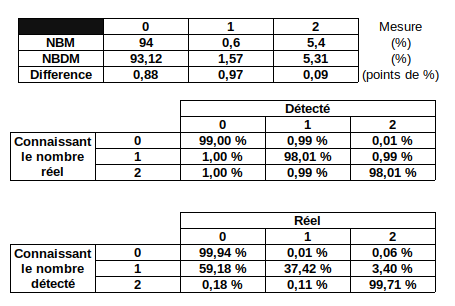
- Global detection: 2.55%
- Reality: 1.58%
- True positives inside GATC: 85.37%
- True positives outside GATC: 9%
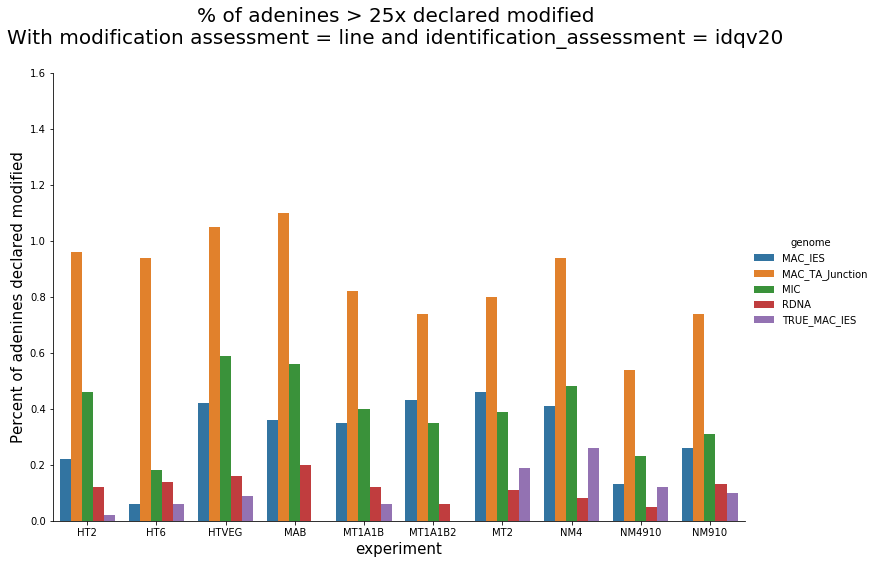
Extrapolation in Paramecium
Preliminary data show that:
- Methylation between 1 and 2,5%
- > 95% in AT
- Vast majority of methylation in AT are expected to be symetrical
Which means:
For equal scores/p-values, we don't have the same probability of making a mistake at calling it methylated wether weit is located in an AT with one modification clearly identified or not
Assess the Se and Sp would help
Beaulaurier 2015/2018:
- Se and Sp of PacBio can be very high with SMSN (>99.9%)
- They depend on the per-strand coverage
- Assessed only with WGA data and another pipelining
- With in sillico control ? No one knows
In a perfect world
In an ideal world:
p-value
SMSN n6mA testing
Prior knowledge of FDR
Assessed with Se, Sp and A priori on litterature
FDR control based on A priori knowledge
+
Likelihood ratio between different hypothesis
In our world
???
- FDR control with a BH or Bonferonni procedure probably won't help due to the way the tests are chained/nested
- Not enough data on sensitivity and specificity for SMSN in-sillico control
- Lack of statistical knowledges for what concerns me
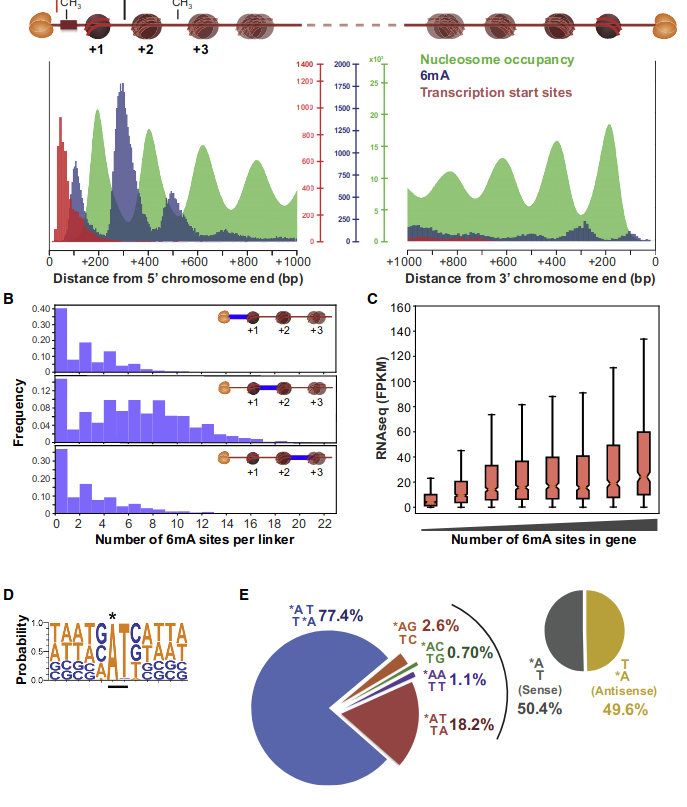
DNA n6mA
Analysis of Paramecium tetraurelia
Enfin !
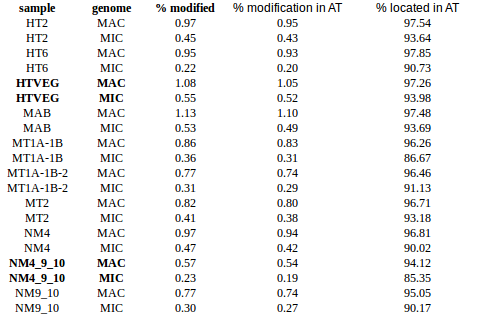
In the vegetative MAC
-
~95% of the methylation locates in AT dinucleotides in the MAC
-
slightly lower in the MIC (5 to 5 points less)
-
True in any condition
-
-
75% of the methylation in an AT dinucleotide is actually symetrically modified, independantly from being in the MAC or the MIC
Kept in MIC and MAC
All conditions
Outside AT sites
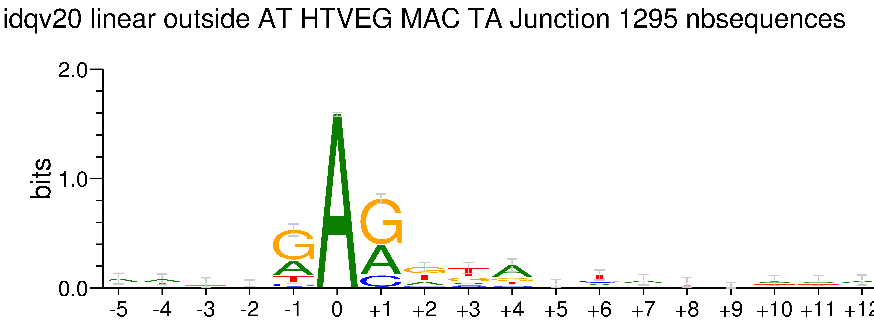
Kept in the MAC for all experimental conditions
Impossible to tell in the MIC (not enough sequences)
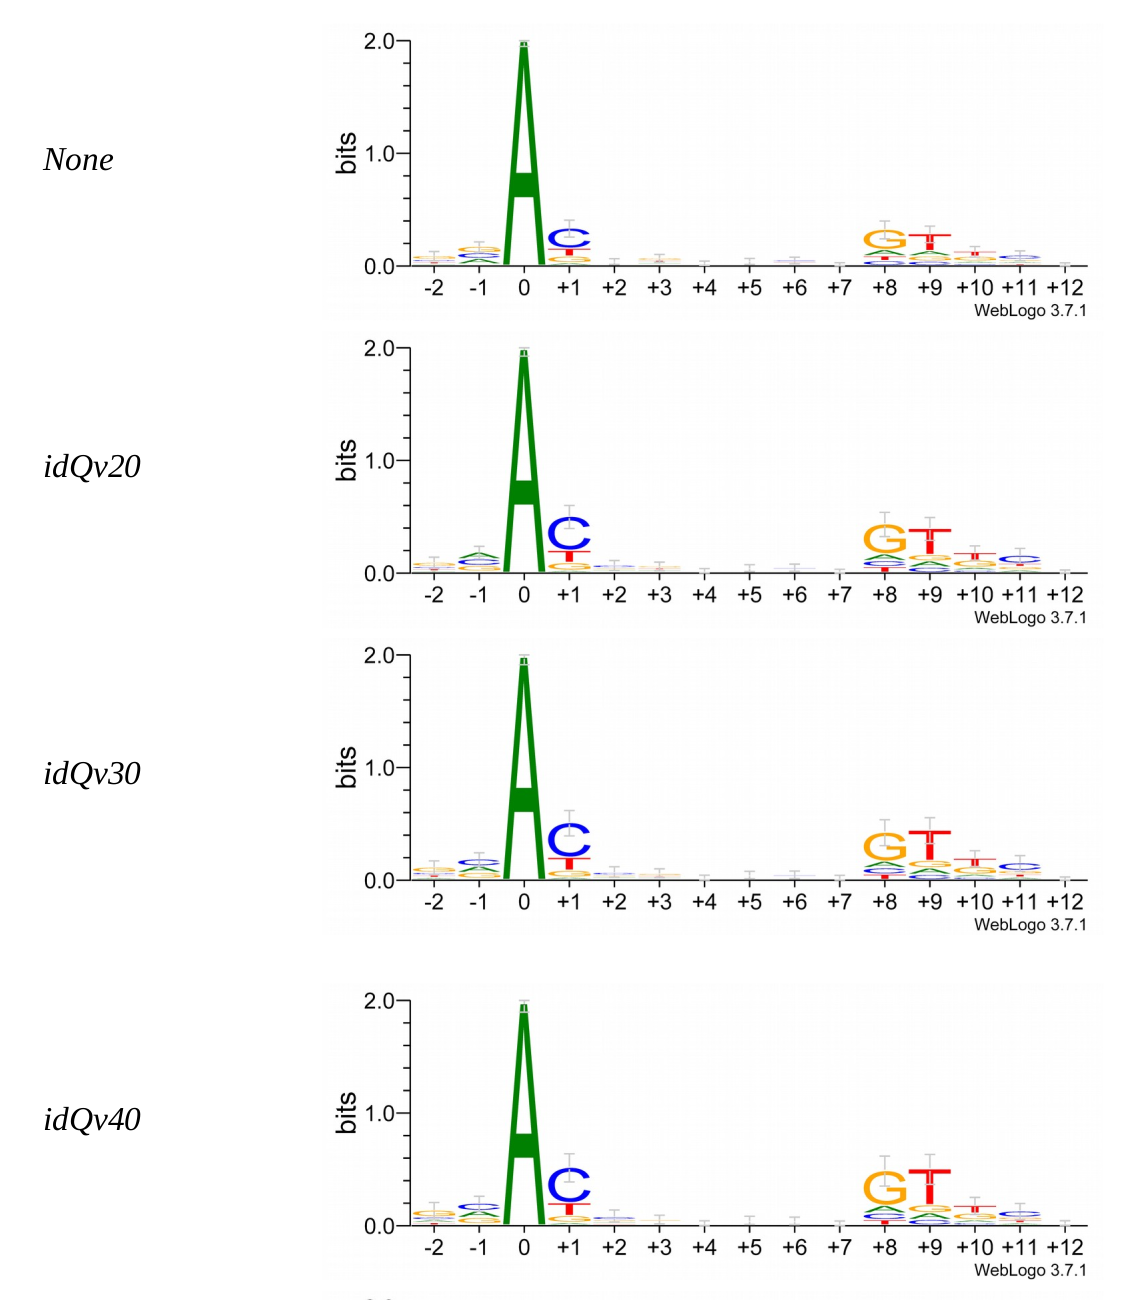
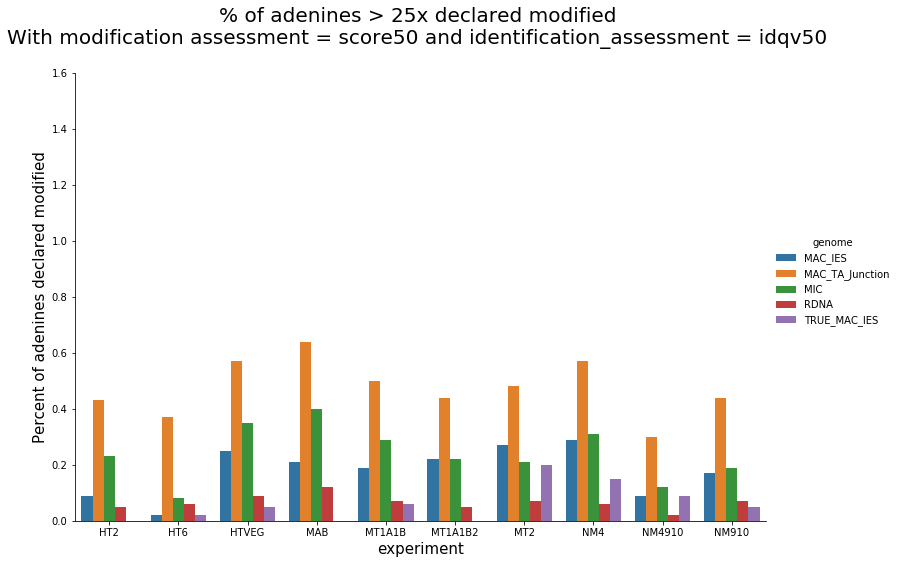
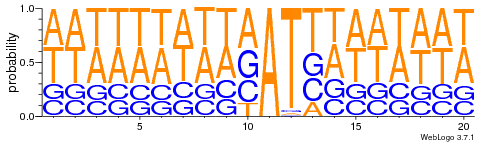
5. Investigation on m4C
Logo from HTVEG MAC
Identical everywhere
Conclusion
Our tools can give relevant results
Interesting results:
- More n6mA in the MAC than the MIC
- No obvious qualitative difference between MIC and MAC
- % of symetrical modification in AT
- 4mC in HT6 HT2 / MIC and MAC ++
- Logo outside the AT in the vegetative MAC ++
Next comming: Compare the methylation of the scan-RNA independant IESs with scan-RNA dep
Perspectives
Short-term
- Methylation of Scan-RNA dependant VS independant IES
- Investigate the differences between the silencings and the vegetative state
- Fix bugs in true_smrt to analyze more MDS
Mean-term
- FDR procedure with a priori ?
- Assert the specificity and sensitivity of in-sillico control in the SMSN way
Later
- Content of IES (already started but stopped)
- New nanopore sequencing
- mtF-like proteins sequencing en cours
Sorry for the headaches !! Thanks for your time :)
Dream perspectives
-
Fix Beaulaurier SMALR for SMSN with .bam format and in-sillico-control
- Then assert Sensitivity and specificity
- pt_sort with nanopore data or long-inserts/AggSn ?
- Would be usefull for PGM32
Advance summary
- Sort our sequences between MIC, MAC, IES, etc
- Understand / Retro-ingineering of PacBio programs
- Develop our own pipeline of methylation analysis that can work with .bam format, Sequel I Data, in-sillico control
-
About the DNA n6mA:
- Calibrate the original PacBio's scores for our approach
- Quantify the DNA methylation within the MIC and the MAC of vegetative cells
- Assert the qualitative and quantitative differences between the MIC and MAC methylation in the vegetative cells
- Check plausibility of our results with other teams and litterature
- Quantify the DNA methylation within our silencings
- Decipher the differences of methylation between HTVEG and the silencings
- Decipher the difference of methylation between scanRNA-dependant IES and scan-RNA independant IES ++
- About other modifications: m4C ?
Additionnal
2.1 Retroingineering
The capping of IPDs
-
modelPrediction is the predicted IPD value by the model in a given context of nucleotides at this position
-
globalIPD is the mean of all the IPD values of the read.
-
localIPD represents all IPDs that have been mapped at a given position in the genome, including those from other sequences

Conclusion on the capping
- Isn't coded as advertized by PacBio
- The way it's implemented for AggSN is problematic and doesn't really make sense
- Paradoxally, it should be more relevant for our approach than for the default one
- We expect no methylation to be undetected due to the capping
IESs (1 & 2)
MAC (1 & 2)
GMM + idQV20
- Raises the % located in AT
- Methylated fraction goes down to 0.9-1%
- NM4-9-10 goes down to 50% in the MAC
- Logos don't change significantly
Logo from HTVEG MAC
Identical everywhere
Laura landwebehr 2020
Oxytrichia trifallax
Modifications in AT/TA
- 95% AT
- Same MIC/MAC in AT
- No difference between experiments
- ~75% methylated symetrically
Modest variations in the silencing
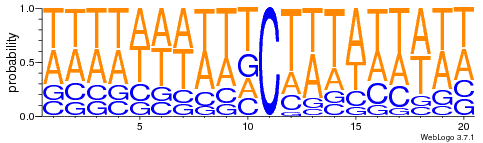
FIndings in cytosines
Logo from HTVEG MAC
Identical everywhere
Modifications out AT
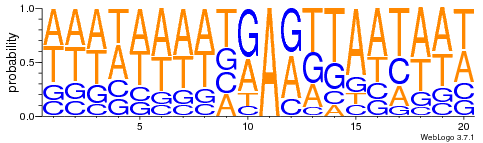
What interests us most
We didn't find no difference between experiments
Sexuated reproduction in Paramecium
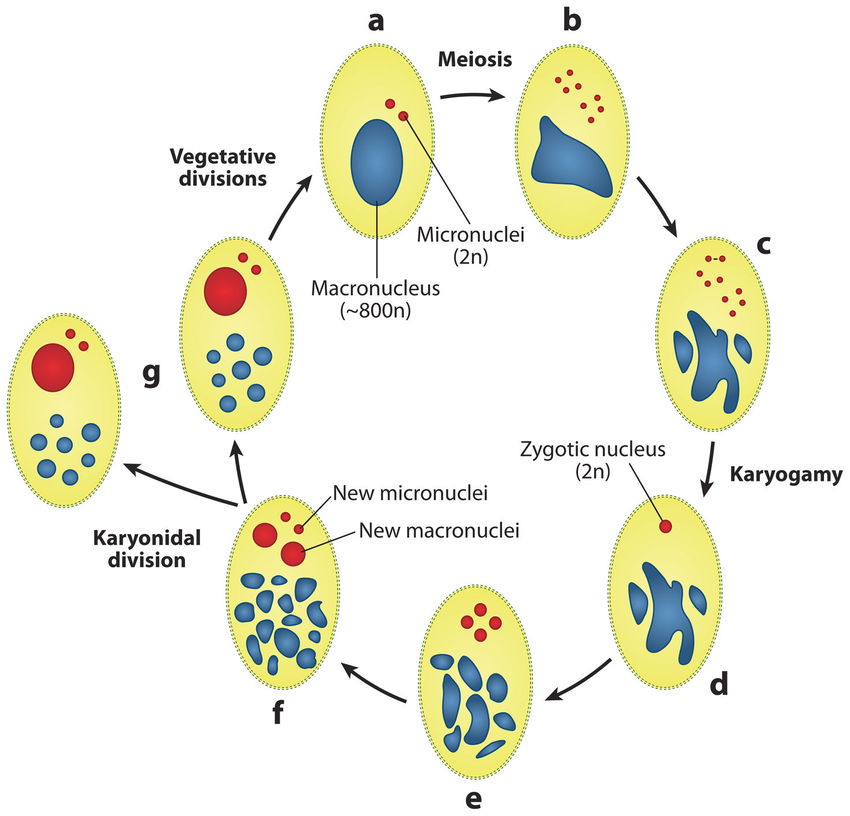
The old MAC (maternal) drives everything during the formation of the new one:
- Active transcription
- Sexual determination (RNA)
- Excision of IES
= Non-mendelian / Cytoplasmic heridity
p values (A)

p-values (A score >20)

Out GATC score < 20

Out GATC

ipdRatio score 20

ipdRatio idv20/score20

A outAT score 20 isQv20 (812 seq)
A outAT score20 idQv20 + Strong BH correction (176 seq)
ipdRatio out GATC before filtering BH vs after (qv20/idqv20)


In GATC

PhD Thesis committee - 1A
By biocompibens
PhD Thesis committee - 1A
28/02/19


