


Cameron Yick
data vis engineer @datadoghq. currently into visual exaptation | creative (en)coding | metalearning | swimming. he/him
Top Gun - 1986
Minimize time between when you have an idea, and when that idea gets executed
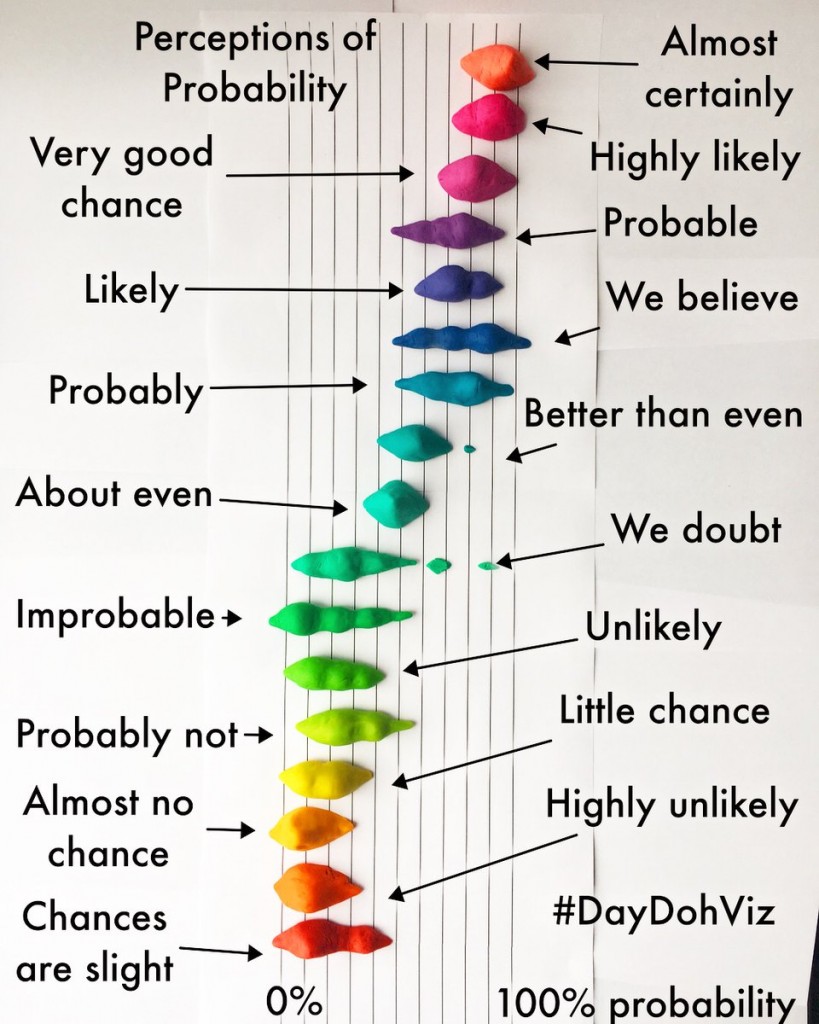
Amy Cesal's #daydohviz - @BecomingDataSci's Crafty Viz Contest
Imagine Microsoft Word, with 5 second delays between button presses and the screen changing.
Imagine coding with a 5+ clicks between keypresses and seeing whether changes to the code changes the page as expected.
No need to imagine...
This is the state of many intro web coding classes!
(Worse if you have to wait for code to compile)
Refueling while in flight
Remotely (No extra setup!)
- CodeSandbox*
(everything except component state-
demo from a Shirley Wu deck)
Locally (Extra work required to persist state)
- React: Create-React-App or Next.js
- Non-React apps: Sam Petulla's Gist-Roll (CNN)
- Retrofit existing CRA without ejecting with CRA-Rewired
- ParcelJS
- Run code "1 cell at a time" to think about 1 thing at a time
- Avoid repeating expensive operations (data downloading)
- Easier to reason about single cells than whole file
- See results right next to code
My Teaching Notebooks @ New School
- Barchart to Lollipop Chart, Data Shaping, Maps
- Animations + Interactions (Sorting, tooltips)
- Adding Annotations to Charts with Enigma Public
Students who had never coded before really liked this environment!
- "Intuitive!"
- "Matches the way I plan things"
When searching for a value that is "subjectively" right, manipulating controls is often faster than typing
from my Observable d3 Tutorial
- Tributary.io / Blockbuilder.org, Powered by inlet.js
- Knobs for web browsers are mainstream!
- Browser Devtools (Safari, Firefox, Chrome, IE...)
- Use Idyll to mix widgets into Markdown-style documents
- Curran Kelleher's Datavis.tech
- Frontend Development
- Storybook.js Component Library Knobs
Grammars of Graphics - express more with less typing
- Vega-Lite: Tutorial with NY Public Data + ObservableHQ
- Thinking in ggplot (mapping data to visual variables)
- Generally- charting libraries over lower-level languages
"Livecoding" environments - eliminating the "save" step
- Datavis.tech (enables realtime collaboration, like GDocs)
- Tributary.io, Blockbuilder.org, Gabriel Florit's livecoding
LiveReload: Predecessor to HMR (slide)
Real-Time Feedback in your Code Editor (slide)
Remotely
- Curran Kelleher's Datavis.tech
Locally
- Blockup (Washington Post, The Pudding, Bocoup)
- Prepros.io (if you don't like the command line)
Predecessor to HMR, covers other languages (SCSS/SASS -> CSS, Pug -> HTML, etc)
- Inline ESLint: "Spellcheck/Syntax Checking"
- Jest/WallabyJS: Runs tests and show results inline
Interactions on graphs filter other graphs to find key points
- Tableau Dashboards ("Linked Views")
- Crossfilter with Vega-Lite
Variations
- Cross Highlight
- Cross Annotate (e.g. sliding a ruler or threshold line)
- Linked summary-card on hover
1. Let users "play" with scenarios inputs in realtime
2. Provide "default parameters" to help casual browsers
Examples:
NYTimes "Rent or Buy" Calculator
(Mike Bostock, Shan Carter, Archie Tse)
India 2047 Energy Securities Scenarios: Import Dependence Simulator
Using space and animation creatively to display the results of many scenarios at once / single complex scenarios, but without creating cognitive overload!
From Bret Victor's "Inventing on Principle"
Excerpt from Bret's "Inventing on Principle"
twitter/github: hydrosquall
cameron.yick@enigma.com
enigma is hiring!
Coming soon:
Remaking historical/textbook visualizations with d3 + React
You!
Feedback tells you if your ideas work are working or not!
Faster feedback =>
- more iterations before you get tired
- enables new kinds of ideas
This applies to not only learning + building data visualizations, but enabling effective analytical problem solving in general!
(Go back through the slides for ways to speed up your data visualization development, and ideas on how to use your visuals to speed up peoples' problem solving).
Presentation and Problem-Solving
By Cameron Yick
Learn the why and how for using interactive data visualizations to take ideas from your head to the screen quickly, using techniques from frontend development and visual analytics. Presented at NYC Data Visualization in July 2018.


