Democratizing Data
Making data accessible at the New York Times
Making Data Useful
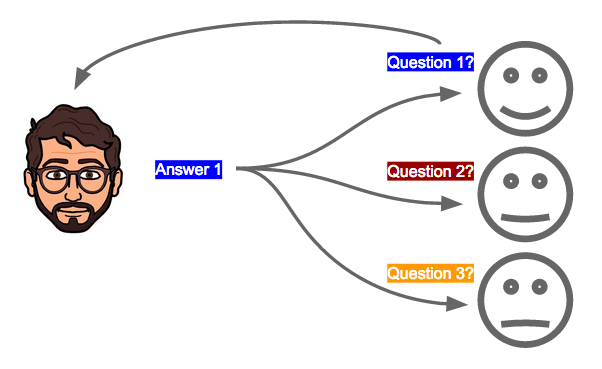
Answering Questions
Analyst
Stakeholder


Database
How are we doing?
From: Advertising
To: Analysts
select
    date,
    revenue
from revenue_table
where date>2015-01-01
    and date<today
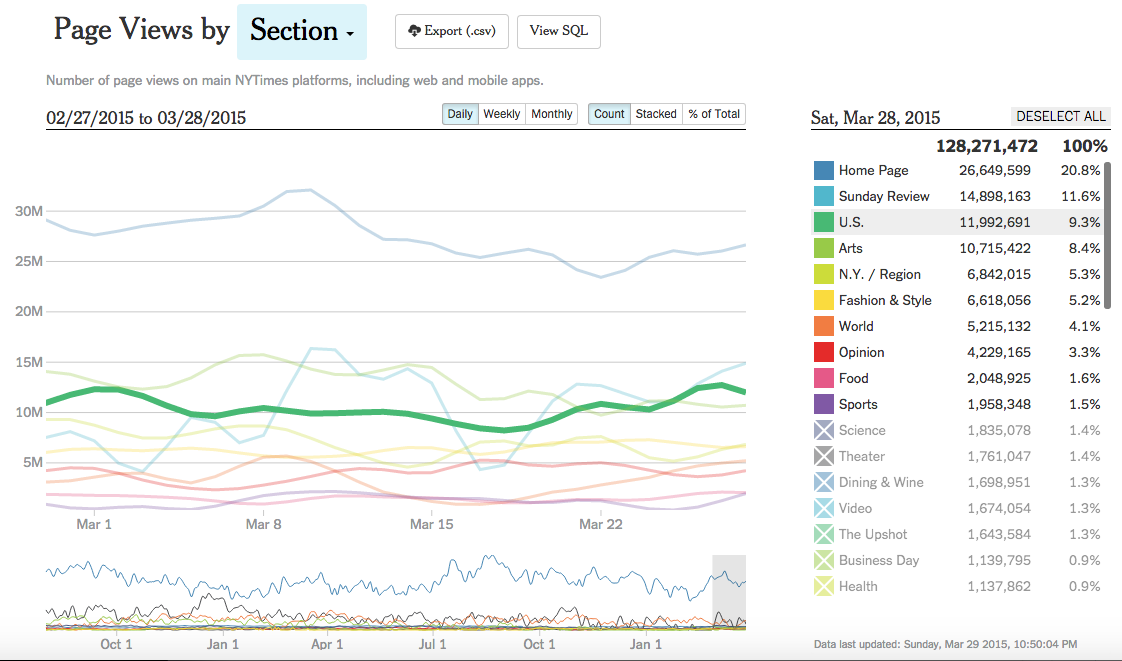
What are people reading?
From: Newsroom
To: Analysts
select
    article,
    current_page_views
from streaming_event_tracker
group by article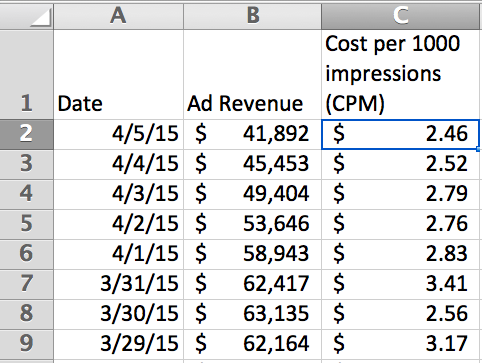
(Fake Data)
Re: How are we doing?
From: Analysts
To: Advertising
Numbers need context
328 homicides in NYC in 2014
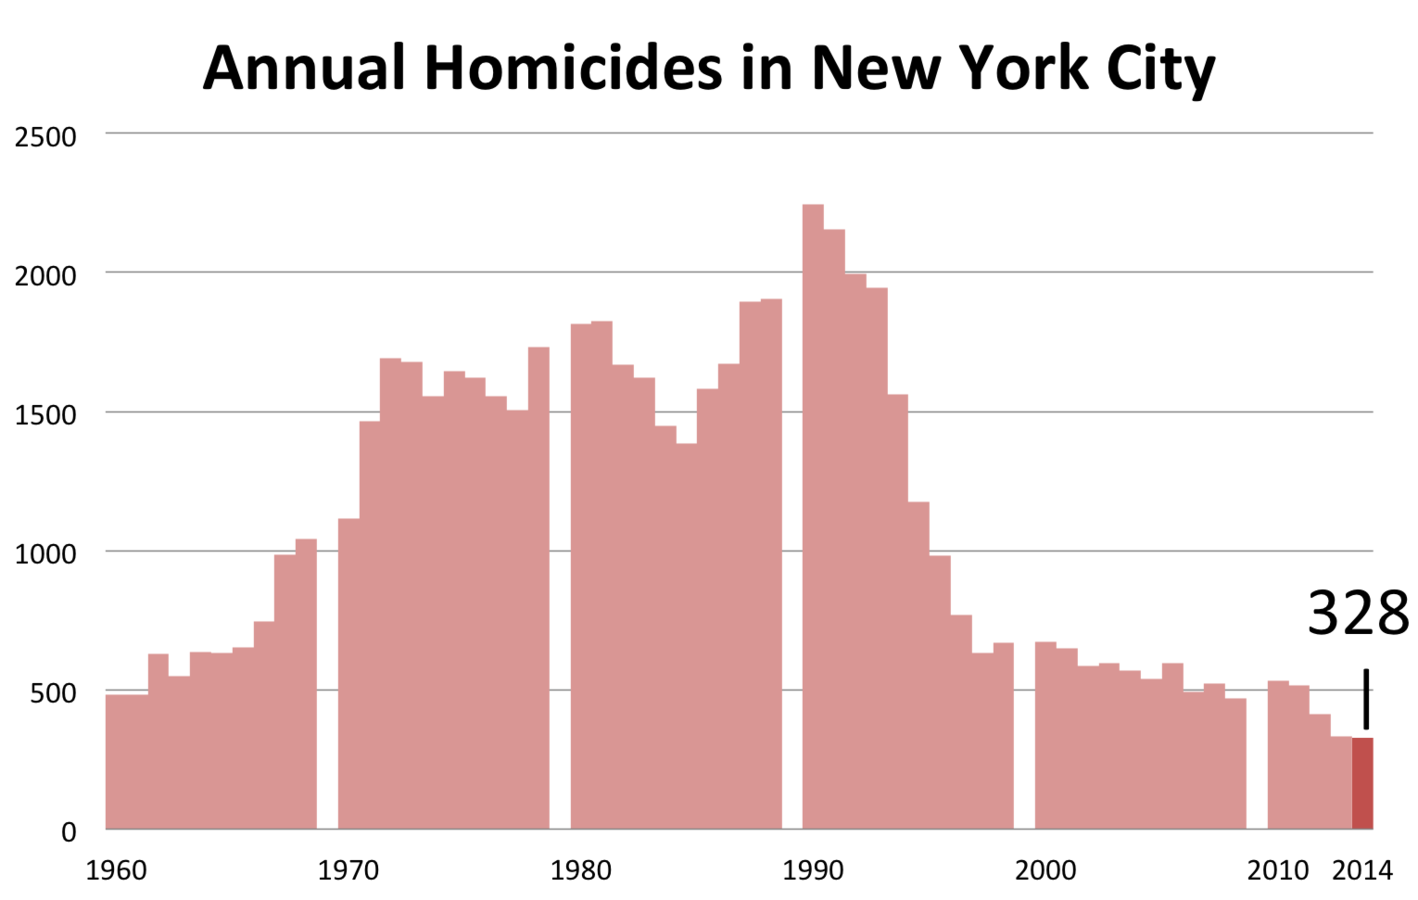
source: http://en.wikipedia.org/wiki/Crime_in_New_York_City#cite_note-one-177
(Fake Data)
Re: How are we doing?
From: Advertising
To: Analysts

"Email Guilt"
Meeting Agenda
- "Get on same page"
- Read every bullet on slides out loud
- Review stuff we already know
- Tangential conversation with one person
Push
Pull
Easy
Answer
Machine
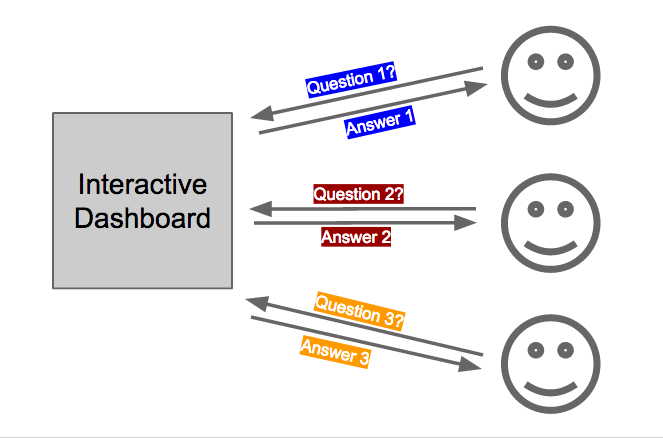
Building the
Easy
Answer
Machine
Requirements
- Easy to use
- Visual
- Answer questions
- Up-to-date
Easy
Answer
Machine
Identify and answer the main question first
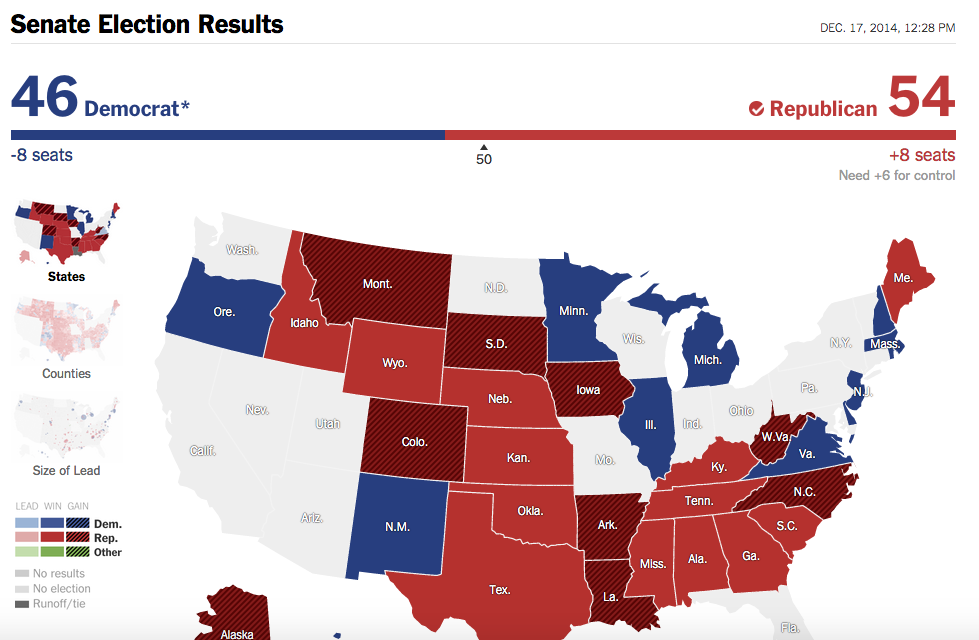
Who's winning the election?
Re: What are people reading?
From: Newsroom
To: Analysts
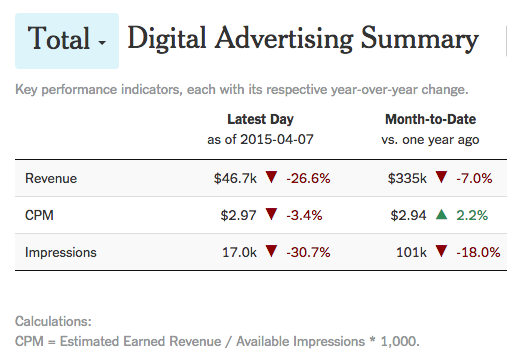
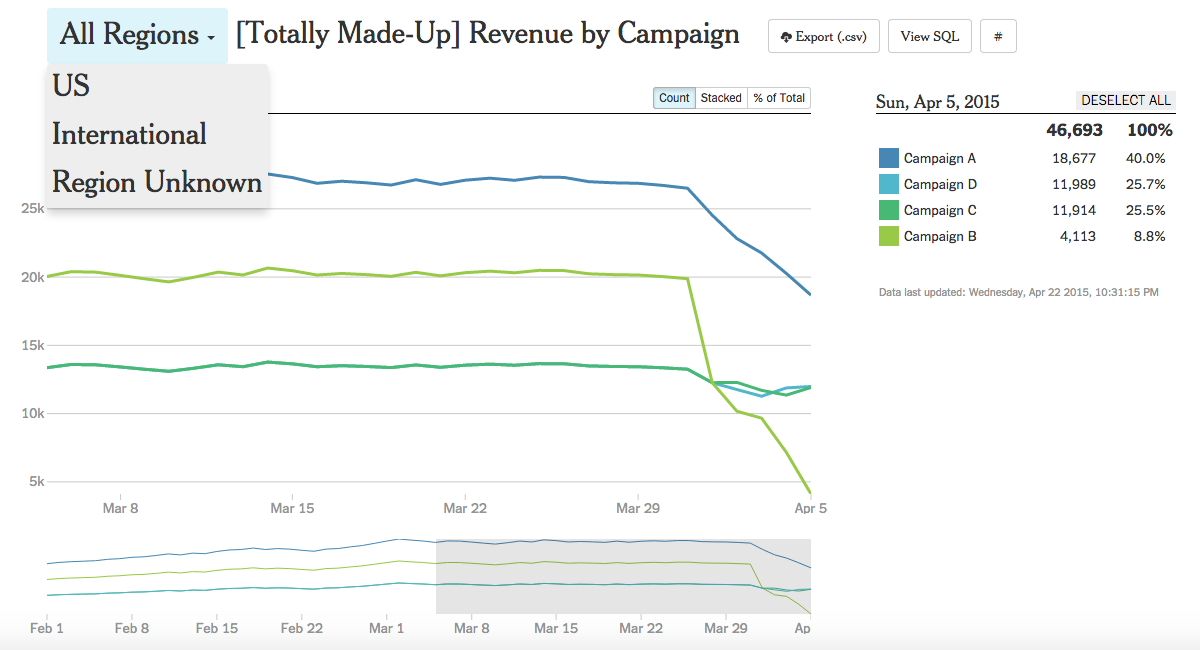
How are we doing?
From: Advertising
To: Analysts
Do I need to be worried?
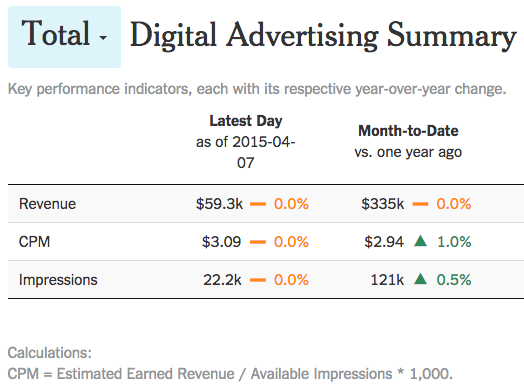
How are we doing?
Re: How are we doing?
From: Advertising
To: Analysts
Matching the chart to the question
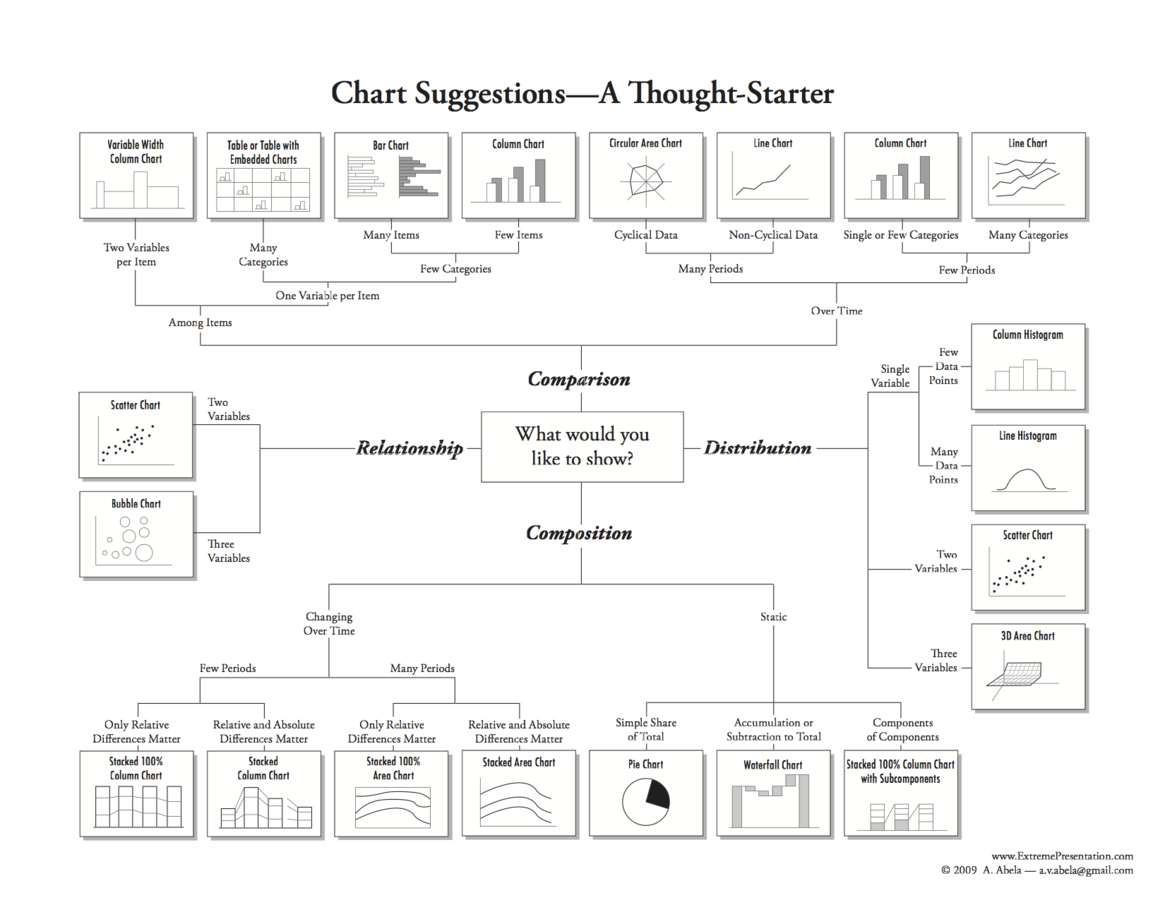
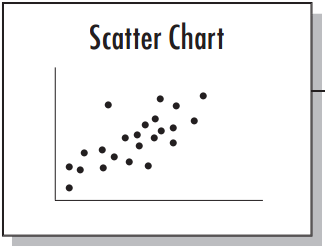
relationships between two variables
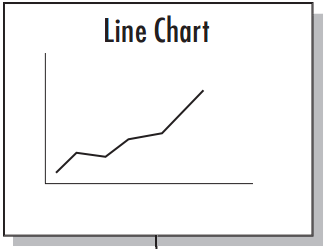
trends and changes;
historical context
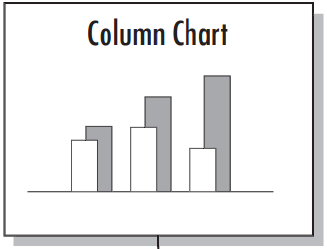
simple comparisons
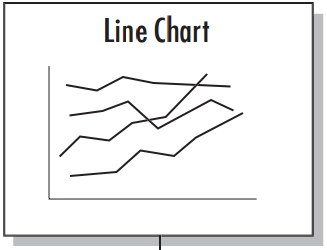
comparisons with historical context
Multi-Line Chart
Comparing values with historical context
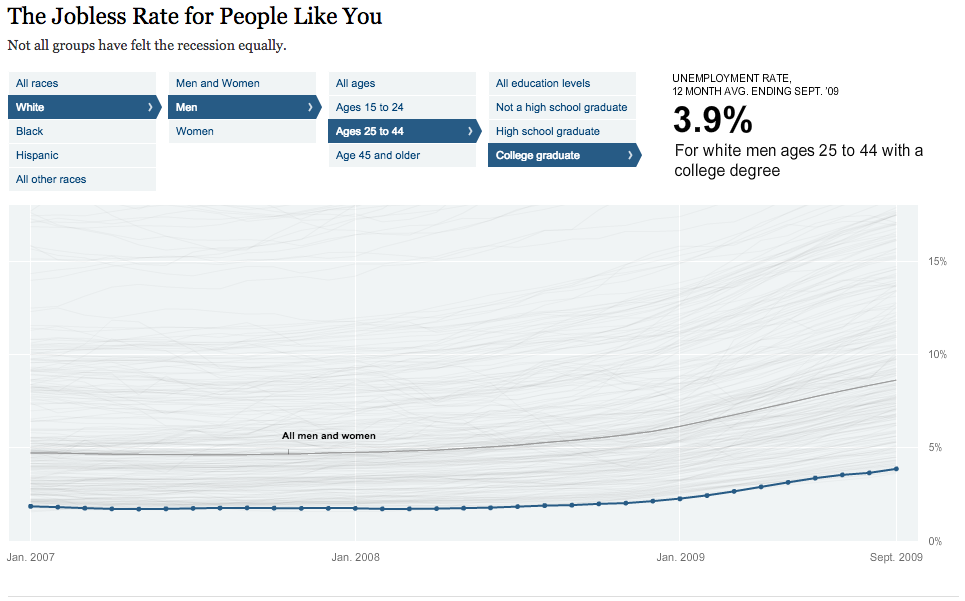
(Fake Data)
Comparing values with historical context
Answering questions without charts...
Re: How are we doing?
From: Advertising
To: Analysts
Re: How are we doing?
From: Advertising
To: Analysts
(Fake Data)
Answering questions without charts...
...or with nothing at all
Nothing to tell
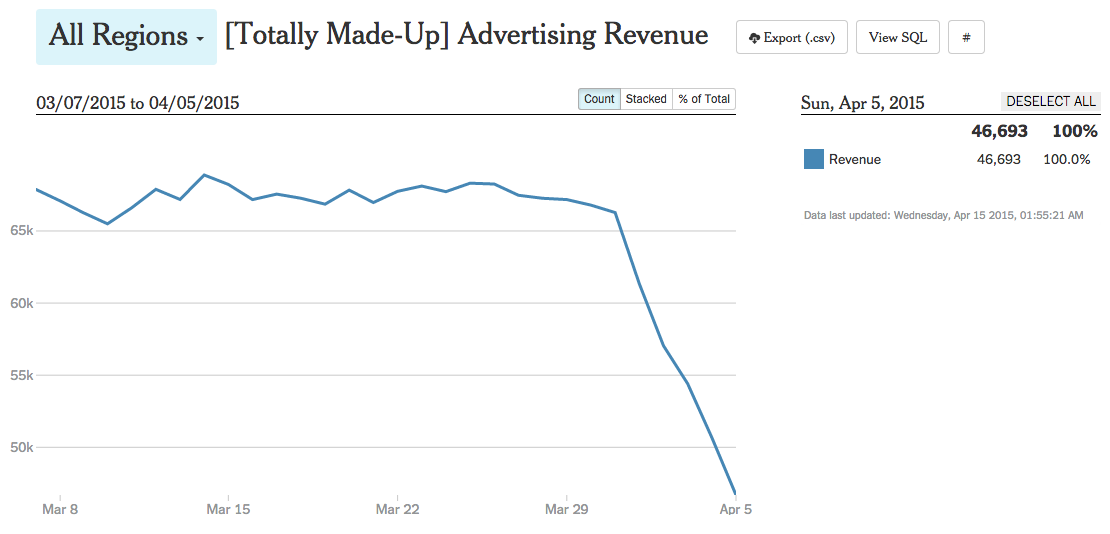
Do I need to be worried?
From: Advertising
To: Analysts
Alert! Revenue dropped by 27%
From: Dash
To: Advertising
"OK, why?"
Follow-up Questions
Overview first,
zoom and filter,
then details-on-demand
- Ben Shneiderman
Election: How close is it?
Re: What are people reading?
From: Newsroom
To: Analysts
How do people reach our articles?
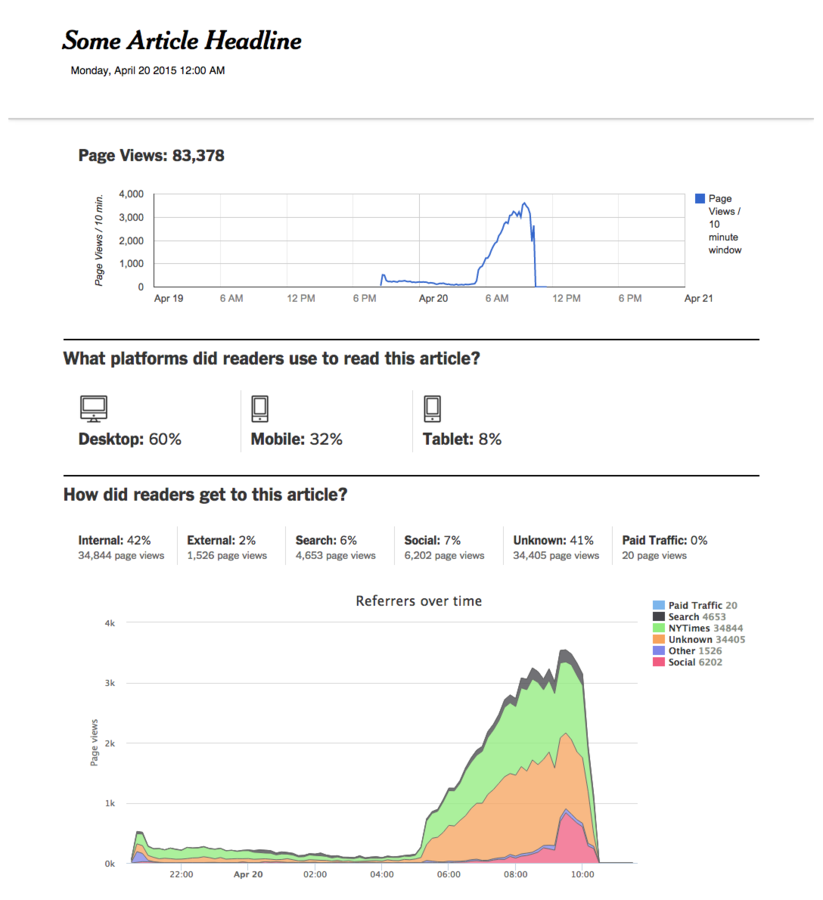
(Fake Data)
WHY HAS REVENUE DROPPED BY 25%?!?
From: Advertising
To: Analysts
(Fake Data)
Re: How are we doing
Why is revenue down?
Zoom
Filter
Filter
Details on Demand
Demo
http://localhost:3274/#/site-activities
Data, Democratized
Results
Data, Democratized
Page Views
Visitors
Homepage stats
Products
Video
Subscriptions
Crosswords
Advertising
Personalization
A/B Tests
Data Governance
URLs
Opinion
Top Articles
Etc.
18 Teams
Over 100 charts
Crosswords
- Freed up for more advanced problems
- Building out more tools
- Use data rather than intuition
- More insightful questions
Analysts
Stakeholders
Meeting Agenda
(now that everyone is informed)
- discuss analytics insights
- make informed decisions
Things we Learned
- Answer the main question first
- Pick the right chart - or no chart
- Zoom and filter for followup questions
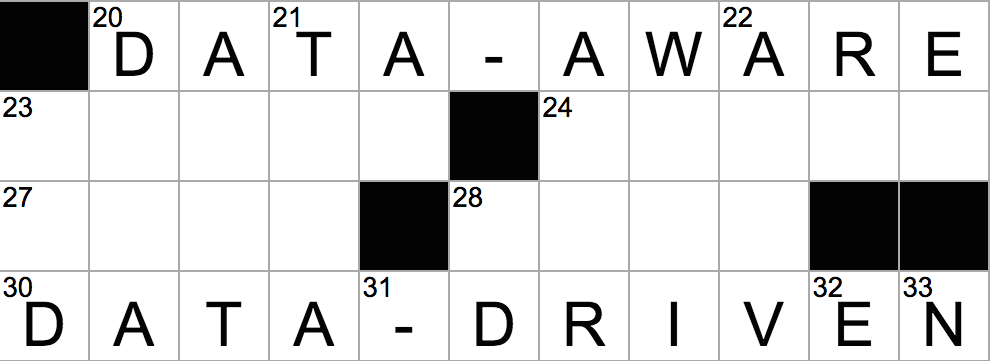
Data Awareness
Data-Driven Decisions
charlieguthrie.net
@charlieguthrie
linkedin.com/in/guthriecharlie
Thank you
Innovation Enterprises Data Visualization Summit
By Charles Guthrie
Innovation Enterprises Data Visualization Summit
Too often, communicating analytics is a tedious and time-consuming process, involving manually-prepared reports and weekly status meetings where few new insights are gained. We can free up analyst resources, however, by providing simple tools to empower the decision-makers to answer their questions themselves. In his talk, Charlie will share his experience in improving this process with customized visualizations and automated, interactive dashboards. The talk will focus on recommendations on dashboard design - noting that dashboards are not always appropriate - and keeping in mind Ben Shneiderman’s mantra: “Overview first, zoom and filter, then details-on-demand”.


