


Cheuk Ting Ho
Developer advocate / Data Scientist - support open-source and building the community.
Grab the slides: slides.com/cheukting_ho/legend-data-viz2
Every Monday 5pm UK time
by Cheuk Ting Ho
Matplotlib is a plotting library for the Python programming language and its numerical mathematics extension NumPy. It provides an object-oriented API for embedding plots into applications using general-purpose GUI toolkits... designed to closely resemble that of MATLAB, though its use is discouraged. SciPy makes use of Matplotlib.
... Matplotlib has pledged to not support Python 2 past 2020 by signing the Python 3 Statement.
- wikipedia
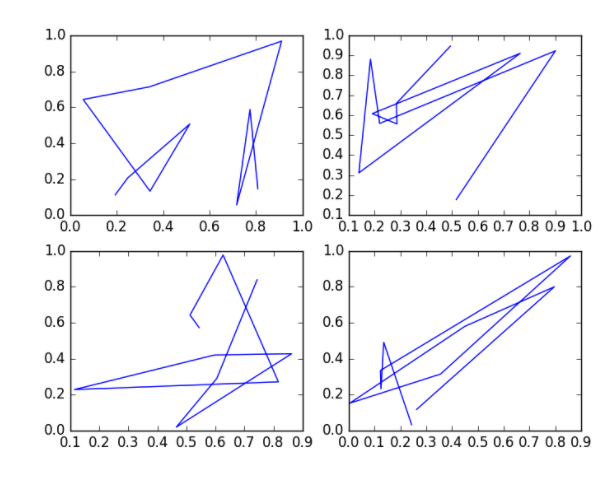
Subplot arrangement: 2x2
Figure
Axes
Every Monday 5pm UK time
By Cheuk Ting Ho


