決策樹(Decision Tree)
by:呂家睿
什麼是決策樹?
- 模型、圖表
- 用來做決策、預測
- 有規則的
- 樹狀結構
樹(tree)


電腦科學
機器學習
遊戲開發
演算法
資料存取
遊戲
測試
分支(branch)
節點(node)
根節點(root)
葉(leaf)
決策樹範例

有沒有傘
不撐
有沒有下雨
不撐
雨大不大
不撐
撐
撐不撐傘?
Code
def decide(have, rain, heavy):
    if not have:
        return "don't hold an umbrella"
    else:
        if not rain:
            return "don't hold an umbrella"
        else:
            if not heavy:
                return "don't hold an umbrella"
            else:
                return "hold an umbrella"
data = [[False, False, False], [True, False, True], [True, True, True], [True, True, False]]
for i in data:
    print(decide(i[0], i[1], i[2]))
def decide(have, rain, heavy):
if not have:
return "don't hold an umbrella"
elif not rain:
return "don't hold an umbrella"
elif not heavy:
return "don't hold an umbrella"
else:
return "hold an umbrella"
data = [[False, False, False], [True, False, True], [True, True, True], [True, True, False]]
for i in data:
print(decide(i[0], i[1], i[2]))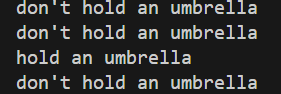
Output:
機器學習中的決策樹
什麼是機器學習?
讓電腦自己從資料中學會規則或模式
觀察資料
找出模式或規則
預測


決策樹
找出模式或規則
-
模擬、簡化人類思考方式
-
可以處理分類和回歸問題
-
分類: yes/no 回歸: 1~100
-
-
訓練比較快
-
容易理解
- 容易過度分析
- 太複雜處理不了
- 需要標準答案
優點
缺點
範例
| 天氣 | 溼度 | 氣溫 | 雲量 |
|---|---|---|---|
| 雨 | 70% | 20 | 多 |
| 晴 | 60% | 24 | 少 |
| 雨 | 90% | 27 | 多 |
| 雨 | 45% | 18 | 多 |
| 晴 | 20% | 23 | 少 |
| 晴 | 30% | 28 | 多 |
| 雨 | 80% | 30 | 多 |
濕度 > 50
雲量
氣溫>23


氣溫>25
如何量化?
熵(Entropy)
E(S) = -\sum^{p}_{i = 1}p_i{log_2}(p_i)

IG = E(p) - \sum w_i E(c_i)
資訊獲取量(Information Gain)

熵
E(S) = -\sum^{k}_{i = 1}p_i{log_2}(p_i)
初始狀態
E(root) = -\frac{3}{7}log_2\frac{3}{7} - \frac{4}{7}log_2\frac{4}{7} \approx 0.99
E(濕度>50) = -\frac{3}{4}log_2\frac{3}{4} - \frac{1}{4}log_2\frac{1}{4} \approx 0.81
E(濕度\le50) = -\frac{2}{3}log_2\frac{2}{3} - \frac{1}{3}log_2\frac{1}{3} \approx 0.92
濕度 > 50
T
F
資訊獲取量
IG = E(p) - \sum w_i E(c_i)
初始狀態
濕度 > 50
濕度 <= 50
p(parent)
c(child)
E(p) \approx 0.99
E(濕度>50) \approx 0.81
E(濕度\le50) \approx 0.92
IG \approx 0.99 - (\frac{3}{7}*0.92 + \frac{4}{7}*0.81) \approx 0.13
Code
函式庫
- pandas
- sklearn(主要)
- matplotlib(圖)
pip install scikit-learn
pip install matplotlib
pip install pandas
Installation
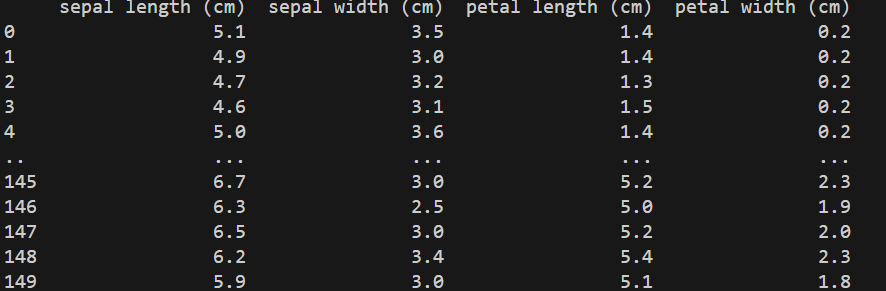
資料
import pandas as pd
from sklearn.datasets import load_iris

iris = load_iris()
dataset = pd.DataFrame(data = iris["data"], columns = data["feature_names"])
print(dataset)
使用內建的資料(Iris)
餵資料
from sklearn.model_selection import train_test_split
from sklearn.tree import DecisionTreeClassifier

x = dataset.copy()
y = iris["target"]
x_train, x_test, y_train, y_test = train_test_split(x, y, test_size = 0.33)
classifier = DecisionTreeClassifier(criterion = "entropy", ccp_alpha = 0.05)
classifier = classifier.fit(x_train, y_train)
# prediction = classifier.predict_proba(x_test)
prediction = classifier.predict(x_test)
print(prediction)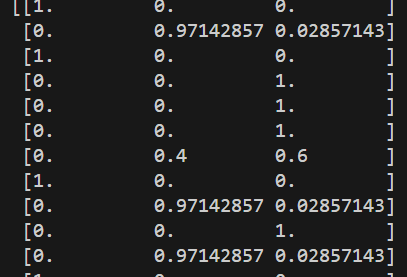


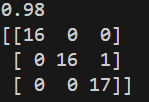
正確度
from sklearn.metrics import accuracy_score, confusion_matrix
print(accuracy_score(y_test, prediction))
print(confusion_matrix(y_test, prediction))feature_importance = pd.DataFrame(classifier.feature_importances_, index = x.columns)
print(feature_importance)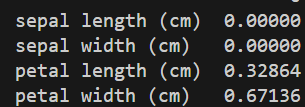
Tree
from sklearn.tree import plot_tree
from matplotlib import pyplot as plt
plt.figure(figsize = (20, 12))
plot_tree(classifier, feature_names = x.columns ,class_names = {0: "Setosa", 1: "Virginica", 2: "Versicolour"}, filled = True, fontsize = 12)
plt.show()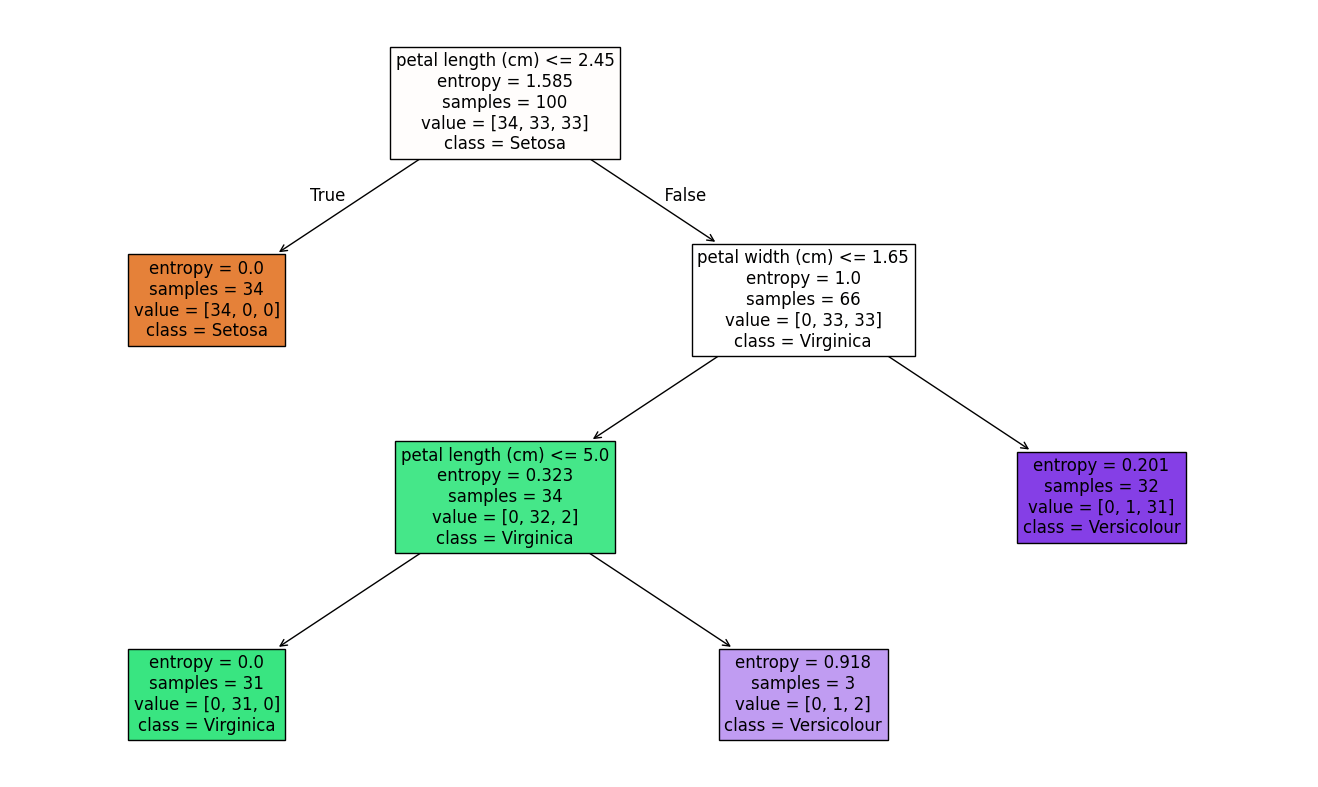
Full Code
import pandas as pd
from sklearn.datasets import load_iris
from sklearn.model_selection import train_test_split
from sklearn.tree import DecisionTreeClassifier, plot_tree
from sklearn.metrics import accuracy_score, confusion_matrix
from matplotlib import pyplot as plt
iris = load_iris()
dataset = pd.DataFrame(data = iris["data"], columns = iris["feature_names"])
print(dataset)
x = dataset.copy()
y = iris["target"]
x_train, x_test, y_train, y_test = train_test_split(x, y, test_size = 0.33)
classifier = DecisionTreeClassifier(criterion = "entropy", ccp_alpha = 0.05)
classifier = classifier.fit(x_train, y_train)
# prediction = classifier.predict_proba(x_test)
prediction = classifier.predict(x_test)
print(prediction)
print(accuracy_score(y_test, prediction))
print(confusion_matrix(y_test, prediction))
feature_importance = pd.DataFrame(classifier.feature_importances_, index = x.columns)
print(feature_importance)
plt.figure(figsize = (20, 12))
plot_tree(classifier, feature_names = x.columns, class_names = {0: "Setosa", 1: "Virginica", 2: "Versicolour"}, filled = True, fontsize = 12)
plt.show()Doneeeeeeeeeeeeeee
決策樹(Decision Tree)
By ck11300111呂家睿


