


Content ITV PRO
This is Itvedant Content department
Learning Outcome
5
Combine drill-down functionality with effective visual design
4
Apply visual best practices for clarity and usability
3
Design reports that support multi-level exploration
2
Identify when drill-down reporting is appropriate
1
Explain what drill-down reports are
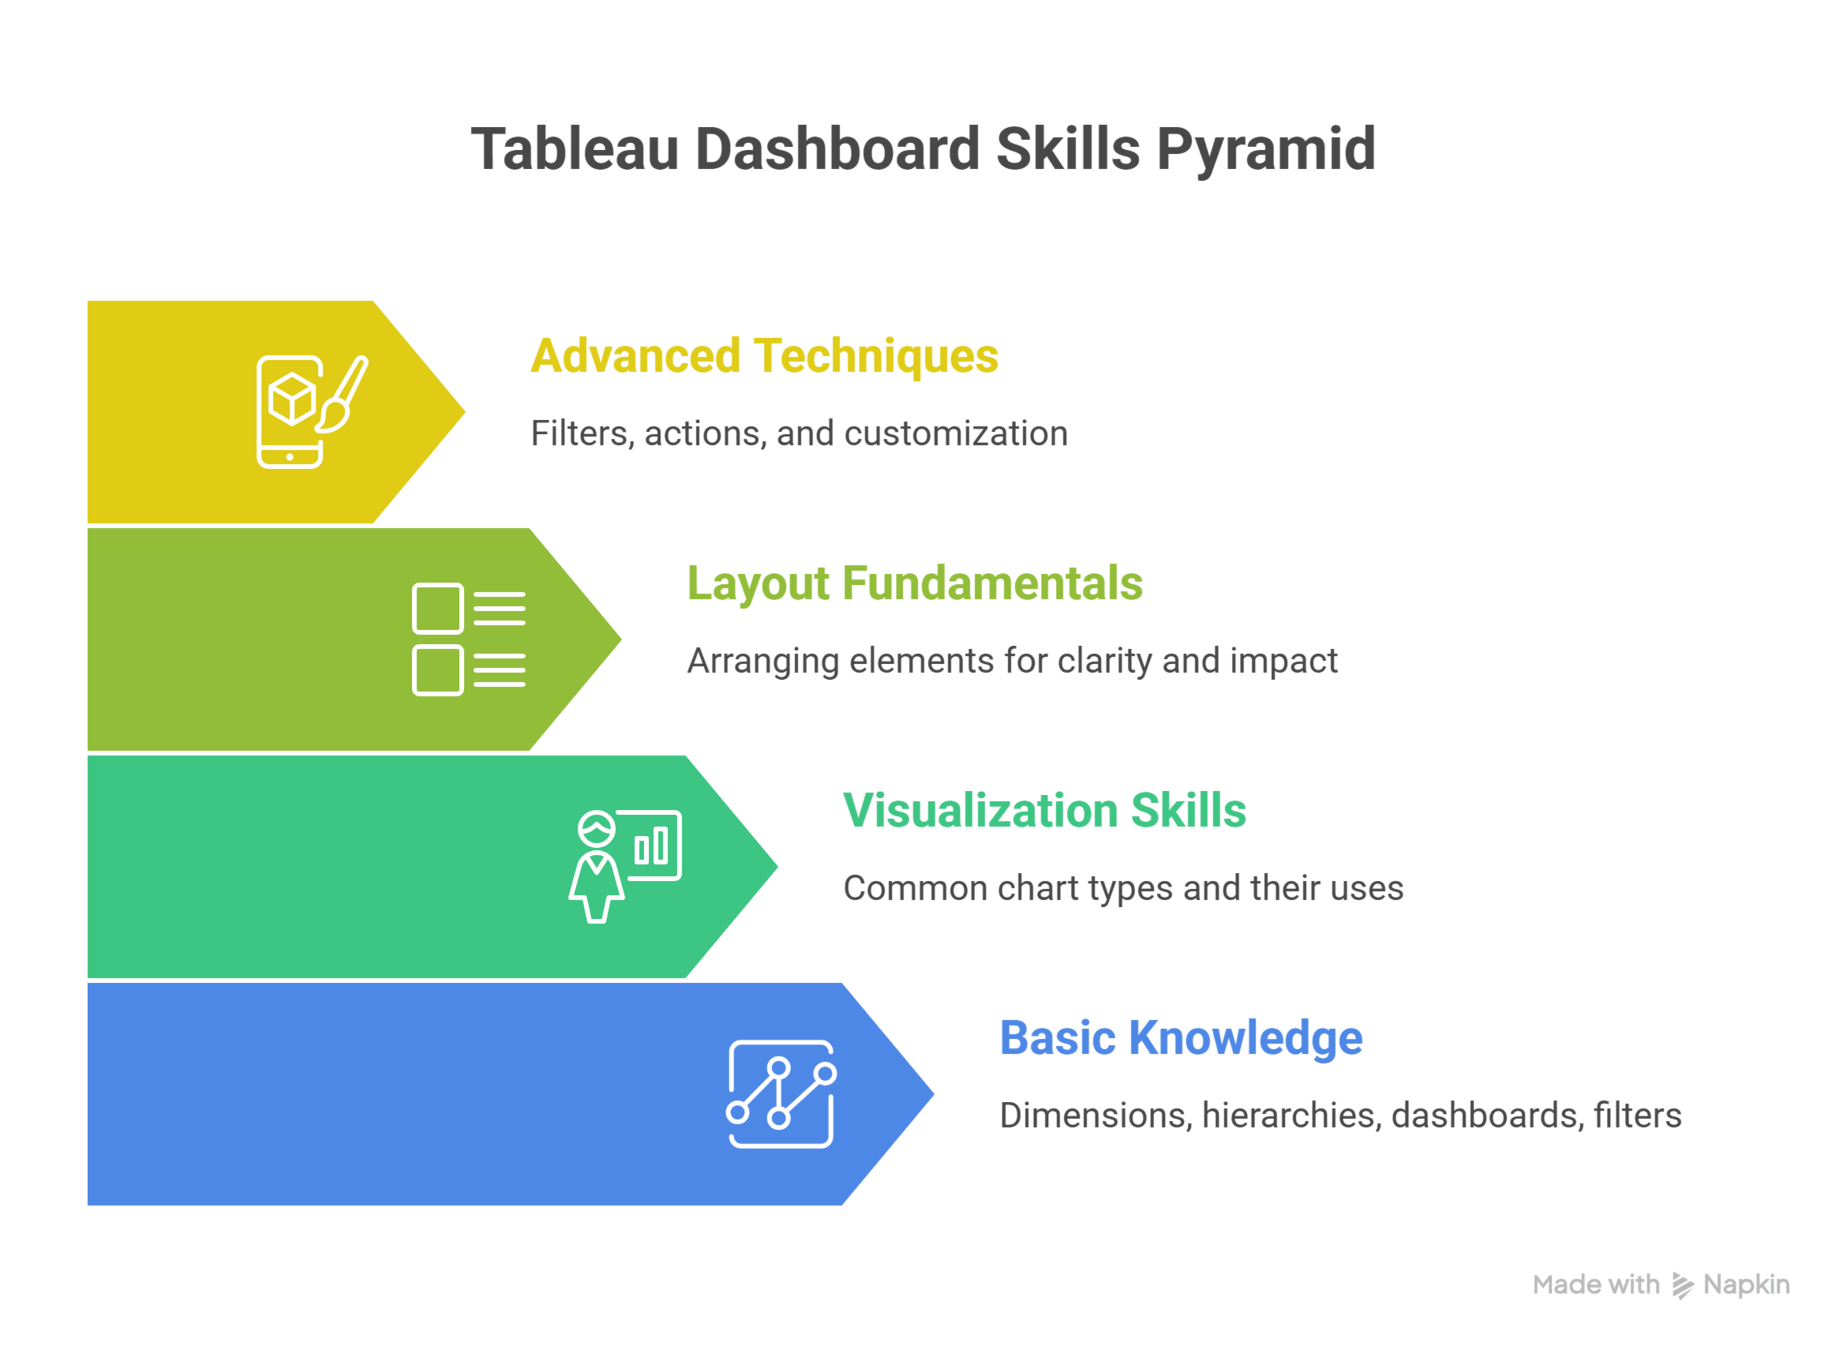
Learners should know....
Advanced Techniques: Filters, actions, and customization
Layout Fundamentals: Arranging elements for clarity and impact
Visualization Skills: Common chart types and
their uses
Basic Knowledge: Dimensions, hierarchies, dashboards, filters
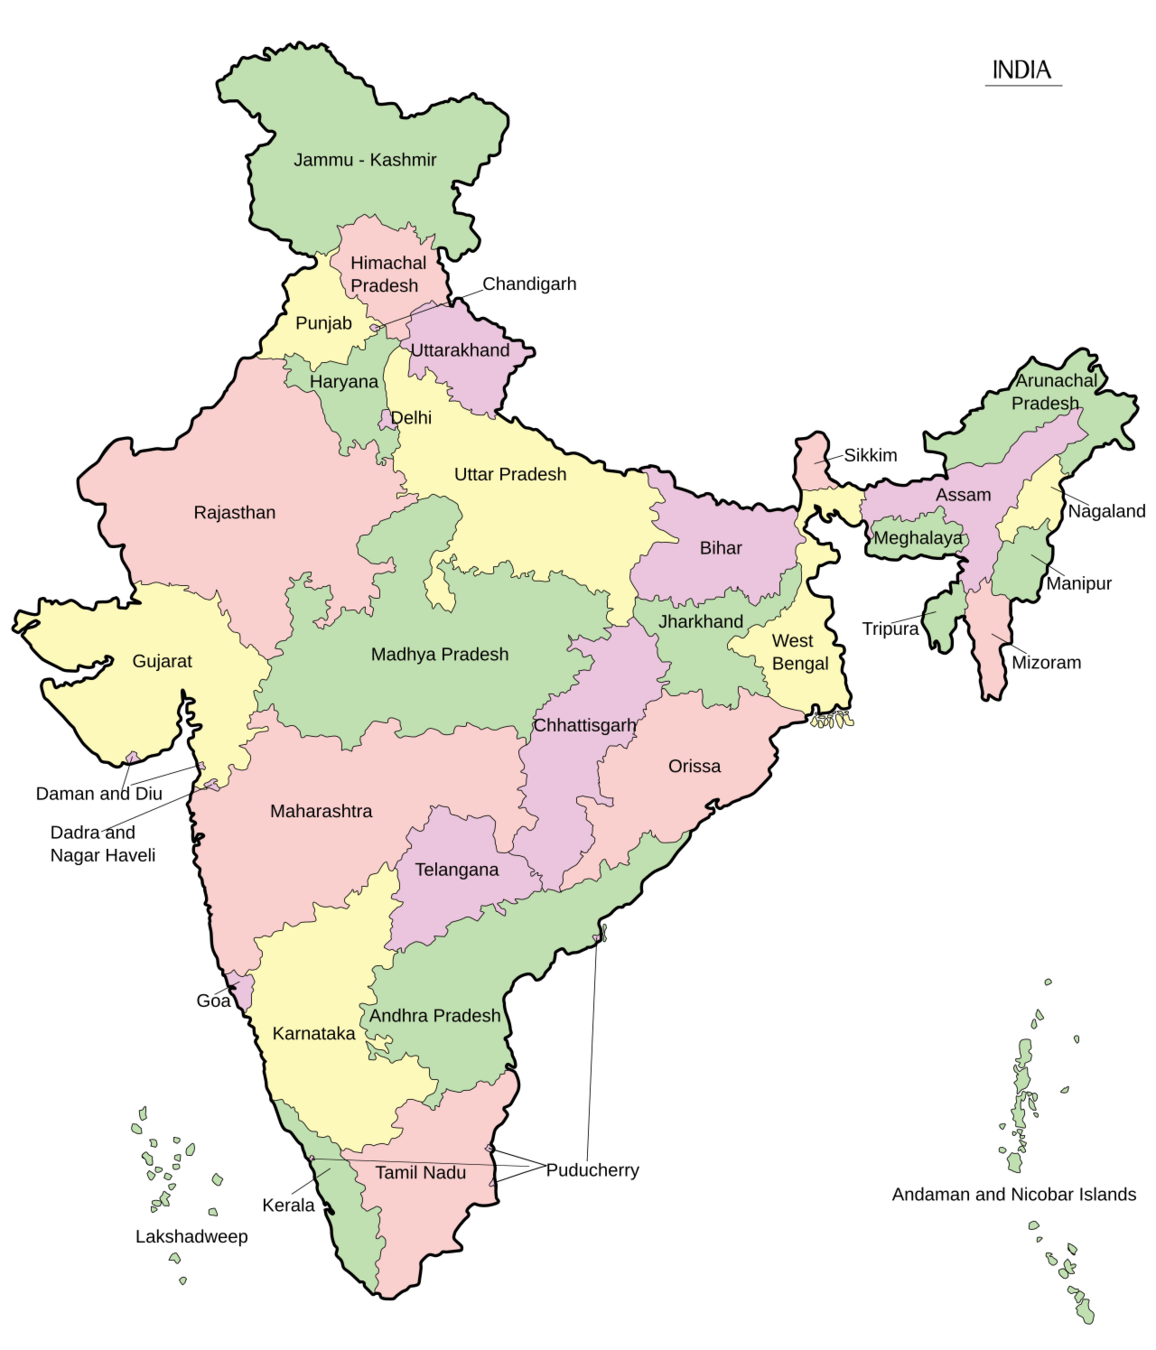
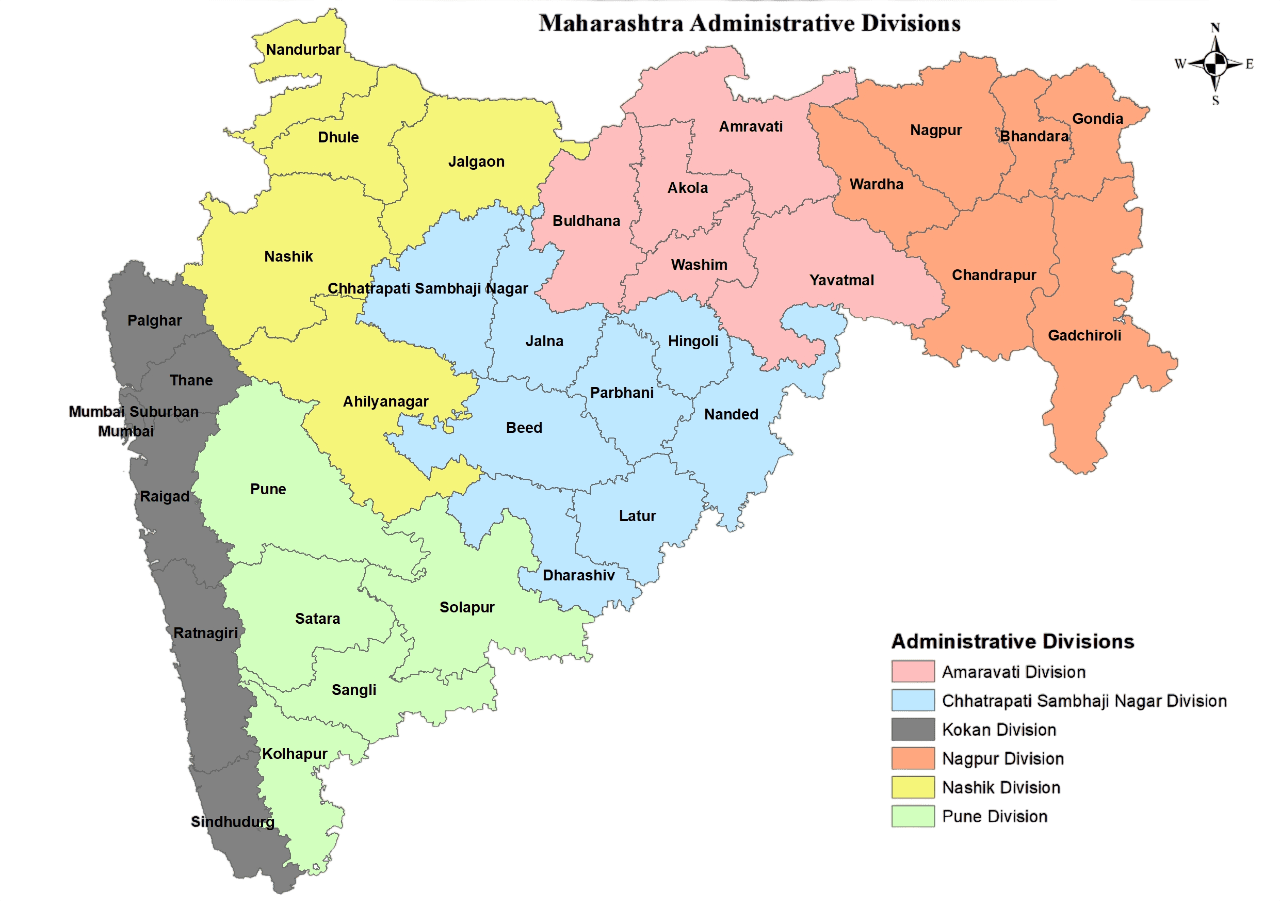
You’re looking at a map...
At first, you see only States
You zoom in
Now you see Cities...
Each level answers a different question
Country
States
City
Nothing feels cluttered, nothing feels lost
How do you move deeper without getting overwhelmed?
This is the idea behind Drill-down reports paired with good visual design.
We now discover how drill-down reports work and how to design them effectively....
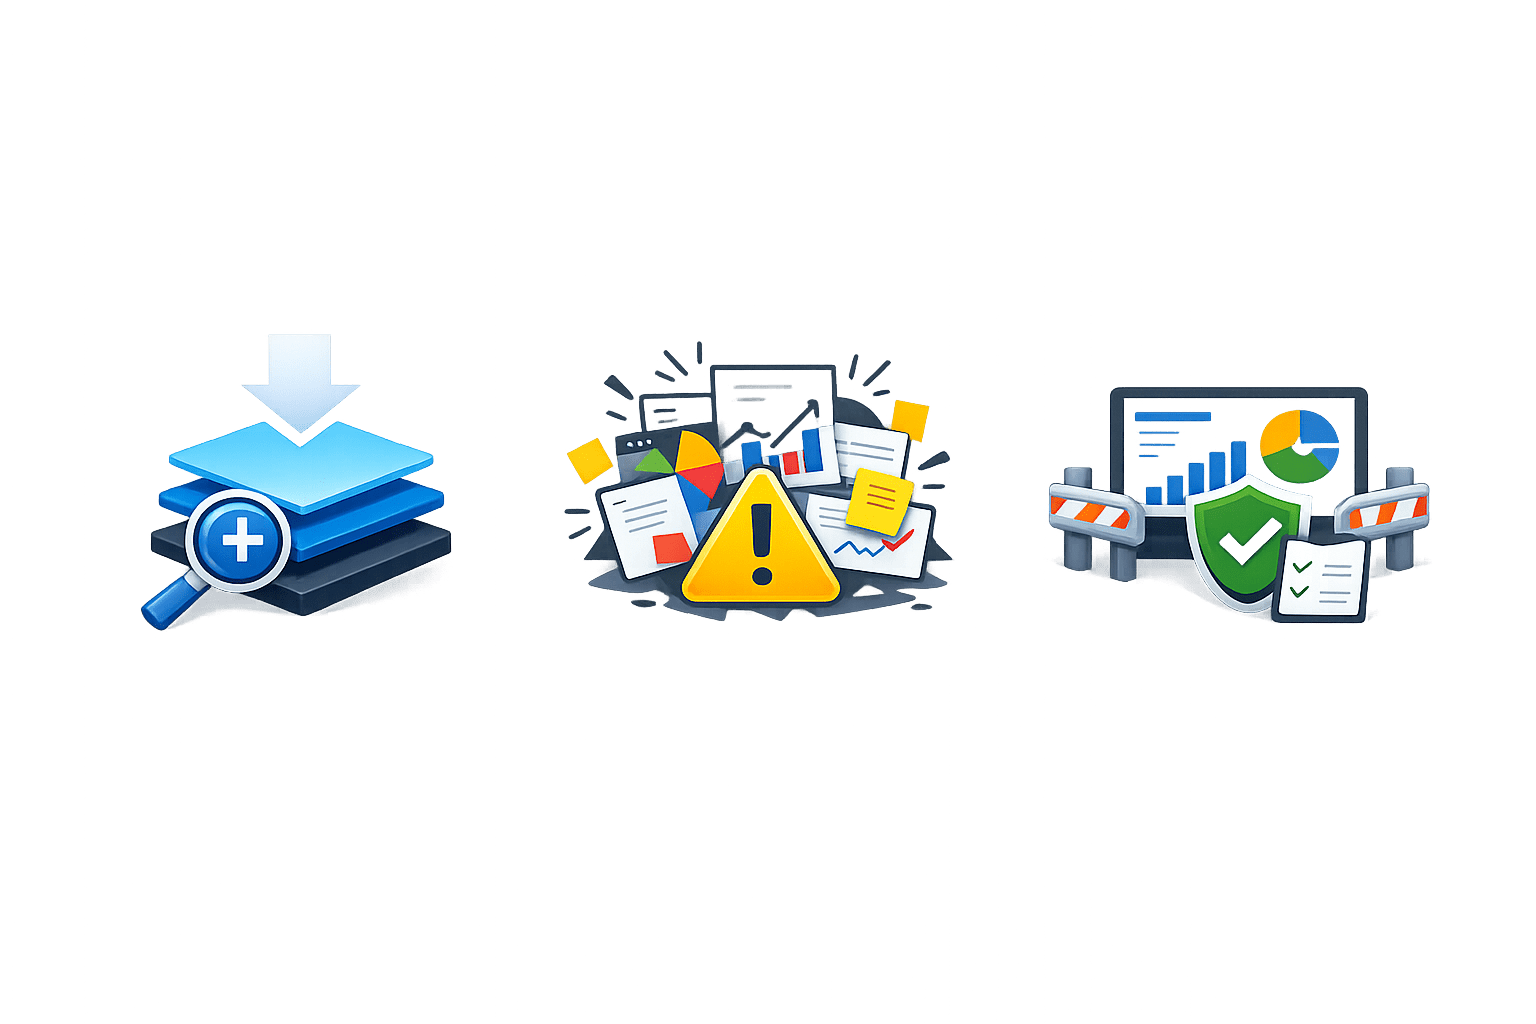
Drill-down reports enable progressive detail
But more detail can easily lead to clutter
Visual best practices act as guardrails
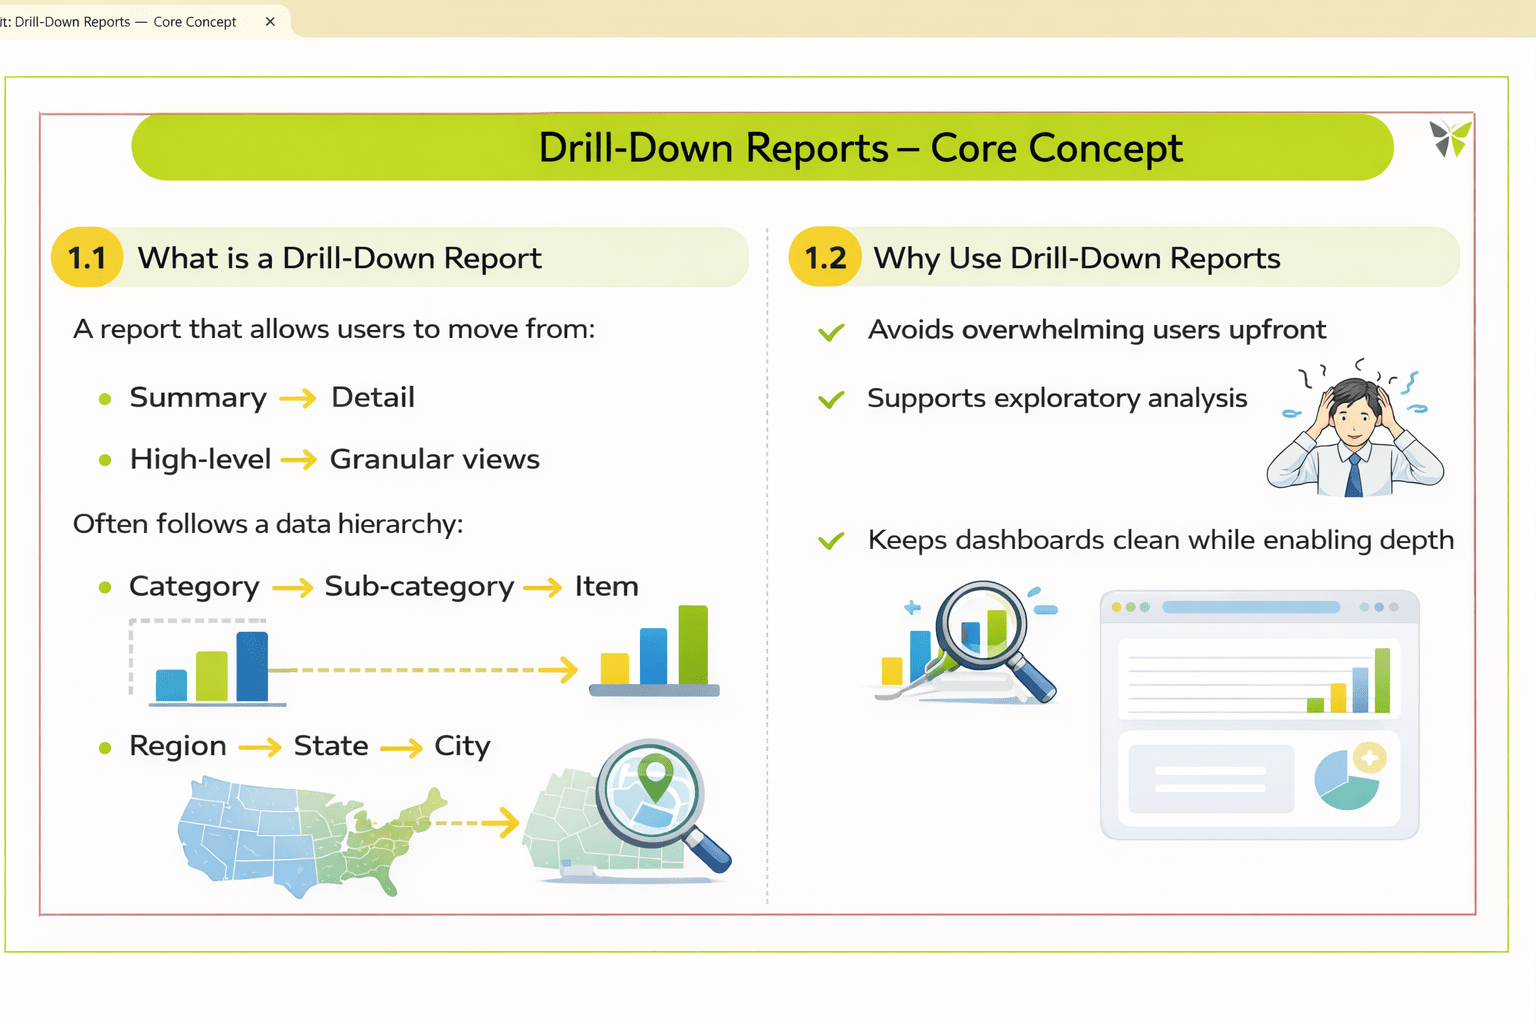
A report that allows users to move from:
Summary → Detail
High-level → Granular views
It often follows a data hierarchy:
Category → Sub-category → Item
Region → State → City
But why do we need them?
Use cases of Drill-Down Reports:
Avoids information overload
Enables quick exploration
Keeps dashboards clean
Reveals detailed insights on demand
Supports better decision-making
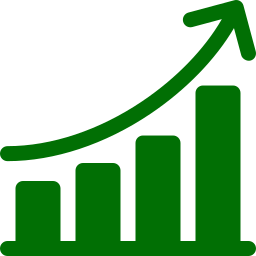
How Drill-Down Works in Tableau
Hierarchy-Based Drill-Down
Uses predefined hierarchies in dimensions
Users expand or collapse levels within a single view
Action-Based Drill-Down
Uses dashboard actions to navigate to deeper views
Maintains context while changing detail level
Designing Effective Drill-Down Experiences
Show only essential information at each level
Progressive Disclosure
Visual Continuity
Maintain consistent colors, layout, and chart types
User Orientation & Context
Help users stay oriented while drilling down
On-Demand Detail Reveal
Reveal details when the user asks, not by default
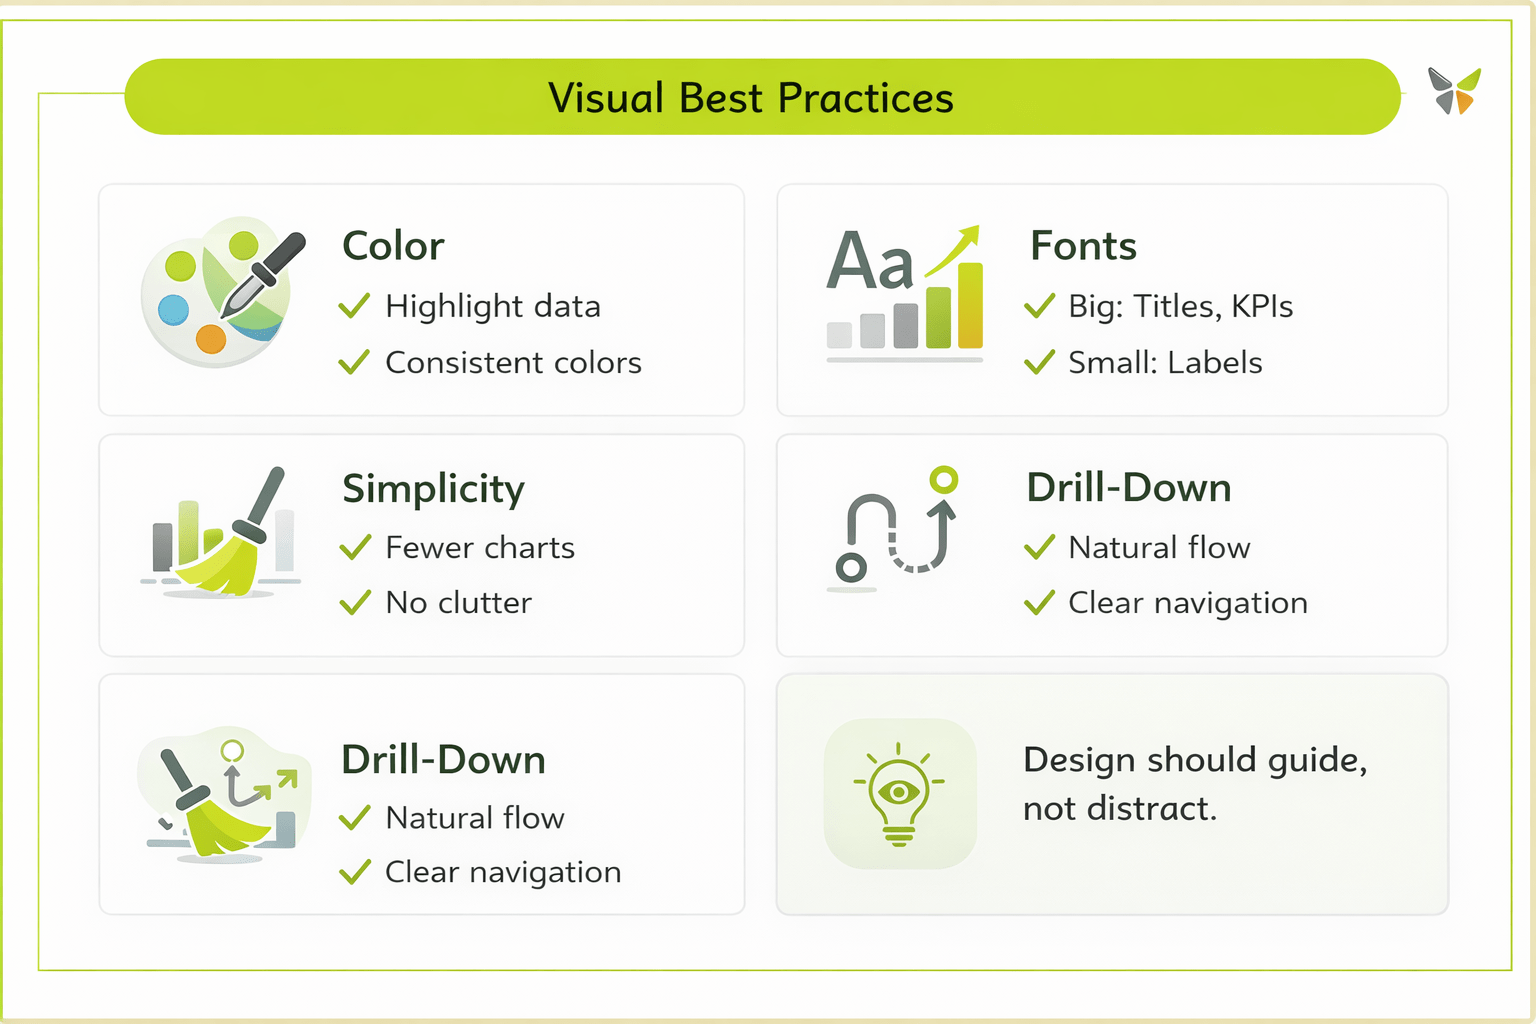
Visual Best Practices
Design should guide,
not distract
5
Together, they create intuitive and effective dashboards
4
Good color use, font hierarchy, and simplicity are essential
3
Visual best practices ensure clarity at every level
2
They allow users to move from summary to detail smoothly
1
Drill-down reports enable in-depth exploration
Summary
Quiz
What is the primary purpose of drill-down reports?
A. To explore data progressively from summary to detail
B. To maintain user orientation
C. To highlight key data and categories
D. To avoid overwhelming users
Quiz-Answer
What is the primary purpose of drill-down reports?
A. To explore data progressively from summary to detail
B. To maintain user orientation
C. To highlight key data and categories
D. To avoid overwhelming users
By Content ITV


