Content ITV PRO
This is Itvedant Content department
Exploration of Futures and Options Trading
Business Scenario
You are working as a Risk Analyst at a financial advisory firm. Your manager asks you to demonstrate how traders use the Option Chain to gauge market sentiment by analyzing Open Interest (OI), Change in Open Interest, Volume, Strike Prices, and Implied Volatility (IV). To make this concrete, you will use real listed company examples from the NSE, focusing on Reliance Industries Ltd. (RELIANCE).
By completing this activity, you will learn how traders interpret the Option Chain, identify support and resistance levels, and compare the risk and reward profiles of different derivative positions.
Pre-Lab Preparation
Topic : Futures & Options
1) Long and short positions
2) Payoff Chart
3) Contract life cycle
4) Mark-to-market mechanism
Task 1: Analyze Option Chain and Payoff Structures
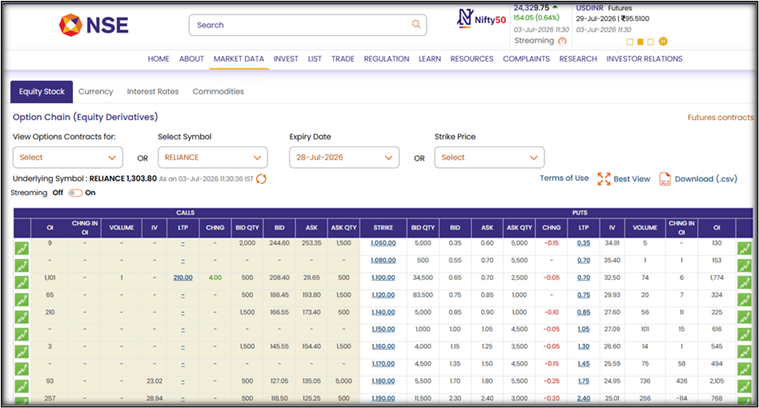
Explore the Reliance Option Chain on the NSE Website
Open the NSE Website
1
Open your web browser (Google Chrome, Microsoft Edge, etc.).
Visit the official website:
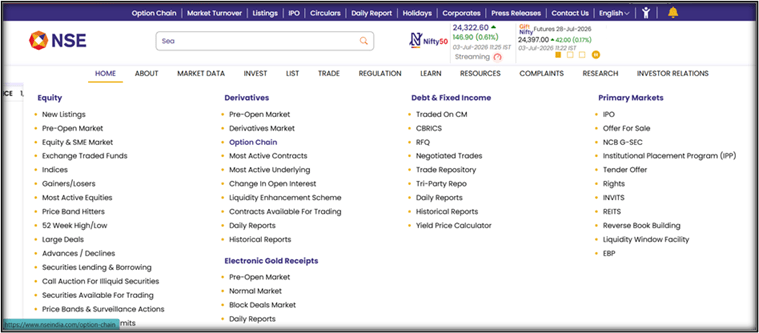
3. From the homepage navigation bar, hover over Market Data and select Option Chain (or navigate directly to the derivatives search bar).
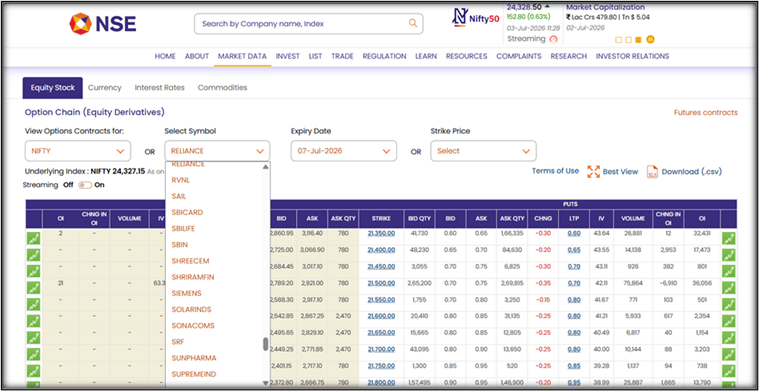
In the Select Symbol drop-down box, type and select RELIANCE (Reliance Industries Ltd.). You can also test other major listed companies like TCS (Tata Consultancy Services), INFY (Infosys), or HDFCBANK (HDFC Bank).
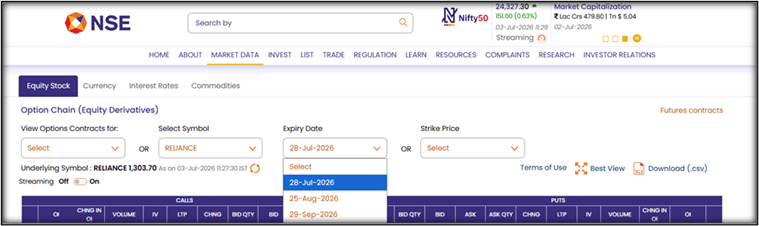
Choose the nearest available expiry date (e.g., the current month's expiry, such as 28-Jul-2026).
Observe the Option Chain Layout
2
Notice that the Option Chain data table is structurally divided into three main sections across the screen:
Call Options (CE): Located on the left side of the table (data for traders betting on or hedging against price rises).
Strike Price: Located in the center column (the fixed, target execution prices for the stock).
Put Options (PE): Located on the right side of the table (data for traders betting on or hedging against price falls).
Understand Each Column
3
Every column in the Option Chain tells a specific story about market activity and liquidity. Here is how professional analysts interpret them:
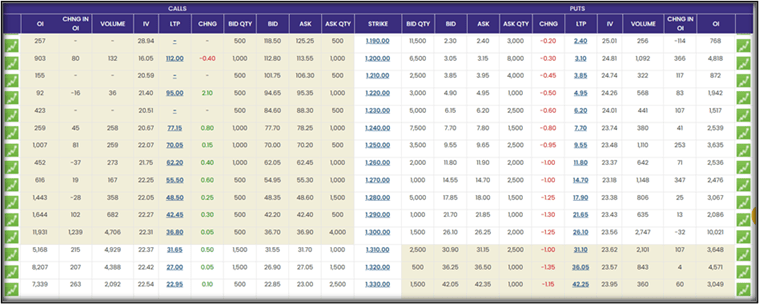
Open Interest (OI): The total number of outstanding, active option contracts currently held by market participants. High OI indicates heavy trader commitment at that strike price.
Under the Call (CE) side for the 1,300 Strike, the OI is 11,931. This means there are currently 11,931 active contracts holding Call positions. On the Put (PE) side for the same strike, the OI is 10,021.
Change in Open Interest (CHNG IN OI): The net addition or subtraction of open contracts during the current trading session. A positive number indicates new positions are being built, while a negative number indicates traders are closing out (unwinding) their positions.
For the 1,300 Call, the CHNG IN OI is +1,239, meaning 1,239 new contracts were created today as fresh money entered the trade. However, for the 1,300 Put, the CHNG IN OI is -32, indicating that 32 existing Put sellers squared off their positions and took their money off the table today.
Trading Volume (VOLUME): The total number of contracts bought and sold during the day. High volume indicates high liquidity, making it easy to enter and exit trades without getting stuck.
The 1,300 Call shows a massive intraday VOLUME of 4,706 contracts traded today, while the 1,300 Put shows 2,747 contracts traded. This high participation proves that the 1,300 strike is currently the most active, liquid trading zone on the entire board.
Implied Volatility (IV): The market's expectation of future price turbulence, expressed as a percentage. Higher IV inflates option premiums because the probability of sharp price swings increases.
IV is 22.31% for the 1,300 Call and 23.56% for the 1,300 Put. If Reliance were to announce a surprise corporate event tomorrow, traders would expect violent price swings, which could cause this IV to spike to 35%—instantly inflating the option premiums even before the stock price moves a single rupee.
Last Traded Price (LTP): The current market price (premium) required to buy or sell that specific option contract right now.
LTP is ₹36.80 for the 1,300 Call. Since Reliance has a market lot size of 250 shares, an investor buying 1 lot of this Call option today would pay a total cash premium of ₹36.80 × 250 = ₹9,200. Meanwhile, the 1,300 Put is trading at an LTP of ₹26.25.
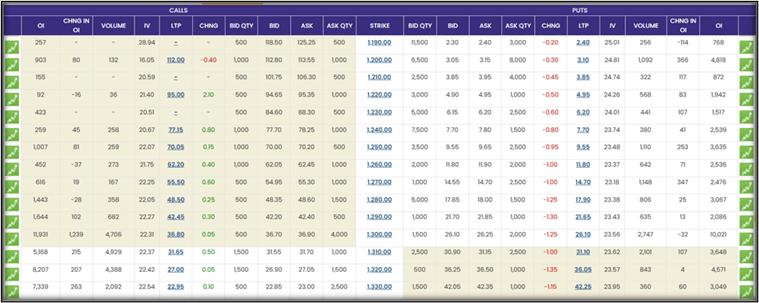
Bid Price (BID) & Bid Quantity (BID QTY): The highest price a buyer is currently willing to pay for the option, and the exact number of shares they want to buy at that price.
Look at the 1,300 Call row: the BID QTY is 500 and the BID is ₹36.70. This means buyers are standing in line waiting to purchase a total of 500 shares (2 lots) at
₹36.70, but they refuse to pay a single paisa higher.
Ask Price (ASK) & Ask Quantity (ASK QTY): The lowest price a seller is currently willing to accept for the option, and the number of shares available for sale at that price.
Next to the Bid on the 1,300 Call, the ASK is ₹36.90 with an ASK QTY of 4,000. If an investor wants to buy this option instantly using a Market Order without waiting in line, they must accept the seller's Ask price of ₹36.90. (Notice the tight 20-paisa difference between the ₹36.70 Bid and ₹36.90 Ask—this tight "Bid-Ask Spread" indicates an extremely healthy, liquid market).
Strike Price (STRIKE): The central reference price in the middle column at which the F&O contract entitles the buyer to buy (Call) or sell (Put) the underlying shares of Reliance
In the RELIANCE 1,300 row, ₹1,300.00 is the Strike Price. It acts as the permanent
anchor line. By buying the 1,300 Call, you lock in the right to buy Reliance shares at exactly ₹1,300 on July 28th, regardless of whether the actual stock market price skyrockets to ₹1,450 or crashes to ₹1,100.
Important Note for Students: Please note that these market prices and figures are subject to change every day in the live trading environment. When you are completing this lab, the actual numbers on your screen may differ from the examples and screenshots shown below.
Identify Support and Resistance Levels
4
Traders use Open Interest (OI) accumulation as a technical map to spot where stock prices might bounce or stall:
Scan the Put Options (PE) side (right column) and find the Strike Price with the Highest Put Open Interest.
Scan the Call Options (CE) side (left column) and find the Strike Price with the Highest Call Open Interest.
Analytical Rule of Thumb:
Highest Put OI = Immediate Support Level: Put option sellers (who are typically well-funded institutional players) write puts when they believe the stock price will not fall below that level. Therefore, massive Put OI acts as a floor (support).
Highest Call OI = Immediate Resistance Level: Call option sellers write calls when they believe the stock price will not rise above that level. Therefore, massive Call OI acts as a ceiling (resistance).
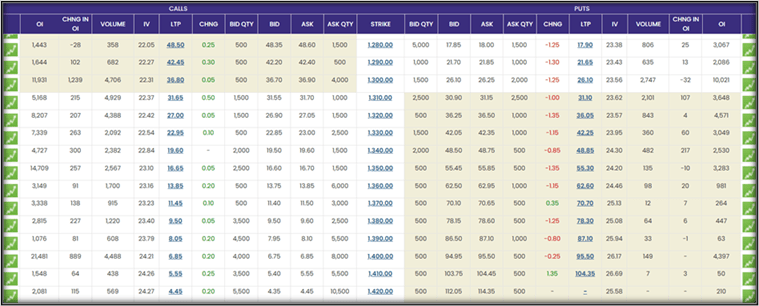
Look closely at the OI columns on the far left (Calls) and far right (Puts) of the screenshot to identify where the biggest concentrations of contracts are trapped:
Finding the Support Floor (Highest Put OI): Scan down the right-hand OI column under PUTS. You will notice that at the 1,300 Strike Price, there is a massive accumulation of 10,021 contracts.
Interpretation: Because 10,021 contracts are written here, institutional Put writers are actively defending this zone. They expect Reliance to stay above ₹1,300, making ₹1,300 the immediate, strong Support Level. (Notice there is also secondary backing down at the 1,200 strike with 4,818 OI).
Finding the Resistance Ceiling (Highest Call OI): Scan down the left-hand OI column under CALLS. You will notice that at the 1,400 Strike Price, the Open Interest peaks at a staggering 21,481 contracts!
Interpretation: Because Call sellers have written over 21,000 contracts at this level, they are betting heavily that Reliance will not rally past this point by the end of the month. This makes ₹1,400 the dominant, major Resistance Level. (Note: There is also an immediate, minor resistance ceiling at the 1,350 strike with 14,709 OI).
Analyze Market Sentiment (The Simple Beginner's Guide)
5
To figure out the "mood" of the market, you do not need complex math. You simply look at where the crowd is rushing and how the prices are reacting:
1. BULLISH SENTIMENT (The Market is going UP!)
What it means: Traders are optimistic and expect the stock price to rally.
The 10-Second Visual Check on your Screen:
The 10-Second Visual Check on your Screen:
Look at the CALLS side (Left column).
Are the Call prices (LTP) going up (turning green)?
Is there a massive number in the VOLUME column for Calls?
Why it's Bullish: Buying a Call is a direct bet that the stock will go up. When you see thousands of traders aggressively buying Calls and driving the premiums up, the market is shouting: "We expect a rally!"
2. BEARISH SENTIMENT (The Market is going DOWN!)
What it means: Traders are pessimistic and expect the stock price to drop or crash.
The 10-Second Visual Check on your Screen:
Look at the PUTS side (Right column).
Are the Put prices (LTP) going up (turning green)?
Is the actual stock price (Spot Price) dropping?
Why it's Bearish: Buying a Put is a direct bet that the stock will fall. When traders get scared of a drop, they rush to buy Put options for protection or profit. Seeing Put premiums surge higher tells you the crowd is preparing for a fall.
3. RANGE BOUND SENTIMENT (The Market is TRAPPED!)
What it means: The stock price is stuck moving sideways. It will not make a big move up or a big move down; it will just bounce back and forth in a tight corridor.
Think of the stock as a tennis ball trapped inside a small room. The massive Put OI acts as a solid concrete floor (Support), and the massive Call OI acts as a solid roof (Resistance). Until one of those walls breaks, the ball is simply trapped bouncing back and forth in the middle!
The Verdict: This Stock is Range Bound
Based on the live data for RELIANCE, the market mood is completely Range Bound because the stock is trapped in a multi-level corridor between its institutional floor and ceilings:
The Market is in a Standoff: Neither buyers nor sellers have enough power to clear out the opposing side. The stock price will likely drift sideways, bouncing up and down within a tight trading corridor.
The Institutional Floor is Holding: The massive boundary of 10,021 Put contracts at the ₹1,300 strike acts as a concrete floor. Big institutional players are actively defending this price zone, betting that Reliance will not fall below it.
The Overhead Ceilings Are Heavy: The stock faces an immediate minor roadblock at ₹1,350 (14,709 Call contracts) and a dominant, ultimate ceiling at ₹1,400 (21,481 Call contracts). These walls act as heavy resistance barriers, preventing any sudden upward breakout.
The Risk Analyst's Advice: Buying regular Call or Put options in this sideways environment is highly risky because option premiums will slowly lose value every single day due to time decay. It is best to wait patiently for the stock to actively blast past the floor or a ceiling before placing a directional trade
Activity
Student Task : Market Sentiment Analysis
Navigate the live NSE platform for at least two listed companies and complete your findings in the structured table below.
| Observation / Metric | Example Company: RELIANCE | Student Selection 1 (e.g., TCS) | Student Selection 2 (e.g., HDFC Bank) |
|---|---|---|---|
| Selected Company Symbol | RELIANCE | ||
| Current Stock Price (Spot) | ₹1,303.80 | ||
| Selected Expiry Date | 28-Jul-2026 | ||
| Strike Price with Highest Call OI (Major Resistance | 1,400.00 (OI: 21,461) | ||
| Strike Price with Immediate Call OI (Near Resistance) | 1,350.00 (OI: 14,709) | ||
| Strike Price with Highest Put OI (Support) | 1,300.00 (OI: 10,021) | ||
| Strike Price with Highest Trading Volume | 1,300.00 (Call Vol: 4,706) | ||
| Overall Market Sentiment | Range Bound (Trapped between ₹1,300 Support and ₹1,350/₹1,400 Resistance) |
Congratulations on completing this lab!
You explored the NSE Option Chain and learned how to analyze Open Interest (OI), Change in OI, Volume, Implied Volatility (IV), and Strike Prices. You also identified support and resistance levels and interpreted bullish, bearish, and range-bound market conditions using real market data. These concepts provide a strong foundation for option chain analysis and derivatives trading.
Checkpoint
By Content ITV