Tidy data

| male | female | |
|---|---|---|
| 2015 | 18 | 21 |
| 2016 | 22 | 19 |
| avg weight at the age of 6 | male | female |
|---|---|---|
| 2015 | 18 | 21 |
| 2016 | 22 | 19 |
| male | female | |
|---|---|---|
| 2015 | 18 | 21 |
| 2016 | 22 | 19 |
| avg weight at the age of 6 |
|---|
1. clean
2. tidy
3. non-tidy data


data cleaning
blank values
-
unknown
-
not applicable
-
non existent
-
0, "", []
open time
missing: contains uncertainty!
non existent: ok
2019-11-01: impossible
#legs
0: ok for snake
for tree: not applicable
-3: impossible
-
0.5 vs 50%
-
132 vs "132"
-
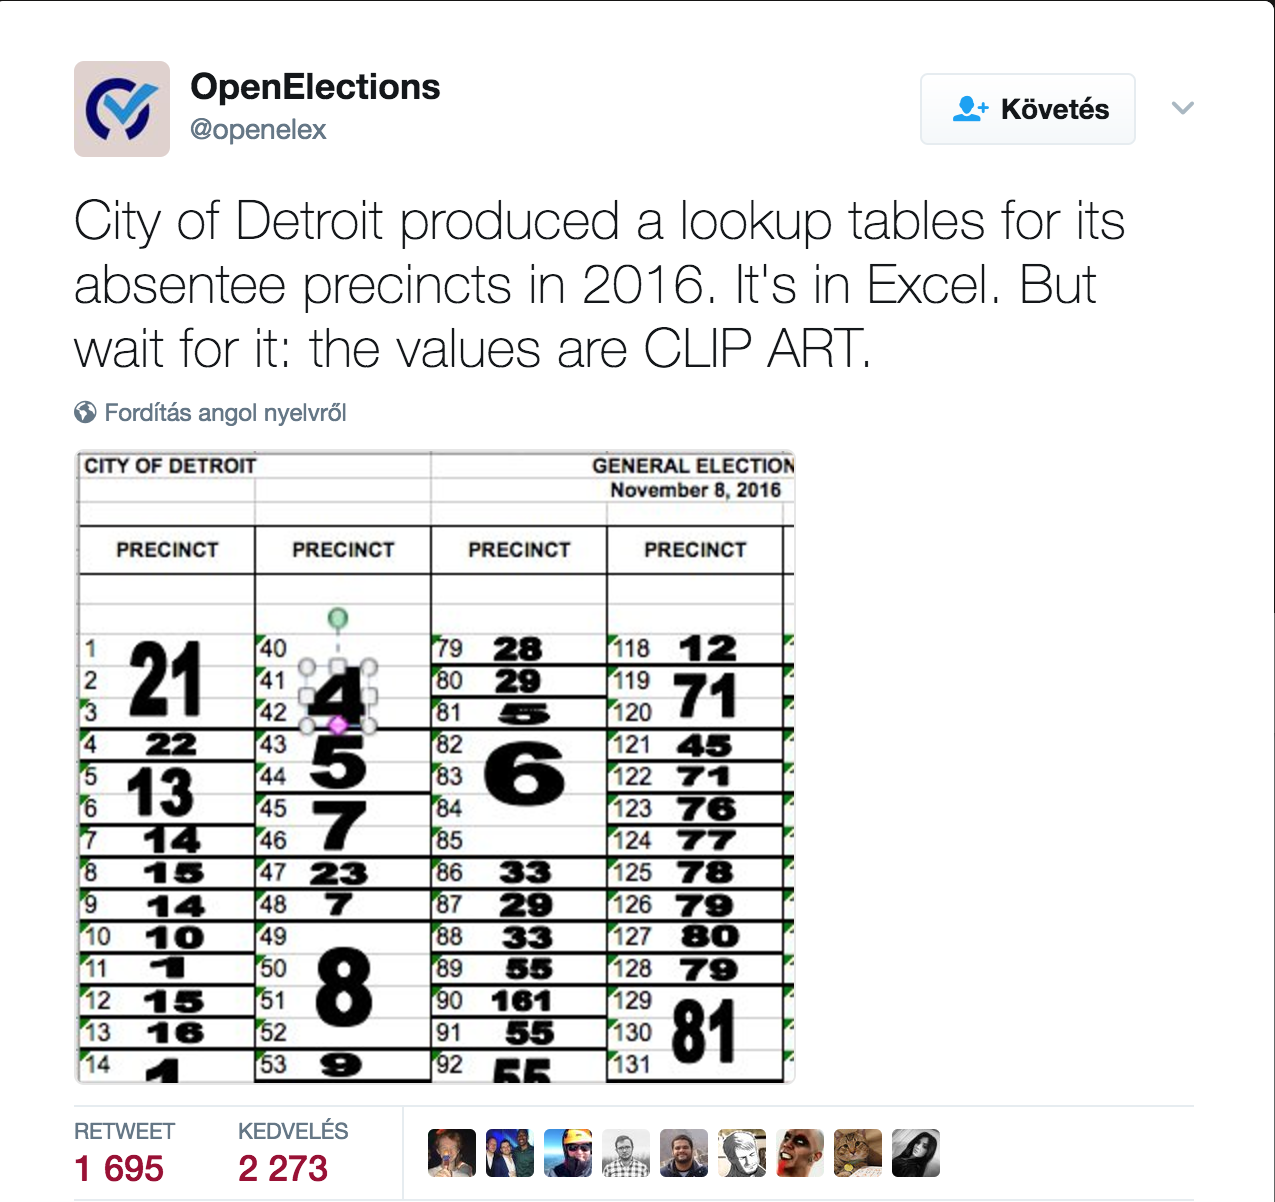
105% open rate
-
"gmail.com" vs "gmail.com "
data tidying
clean & flexible
Formal rules
-
column variable
-
observation row
-
table variable type
-
tables are linked
? variable, ? observation
height
mobile phone number
compare observations
combine variables
| send_day | num_open | num_click |
|---|---|---|
| ápr. 15. | 1000 | 300 |
| ápr. 16. | 15000 | 500 |
| send_day | event_type | number |
|---|---|---|
| ápr. 15. | click | 300 |
| ápr. 15. | open | 1000 |
| ápr. 16. | click | 500 |
| ápr. 16. | open | 15000 |
ggplot(dt, aes(x = date, y = value, col = variable)) +
geom_point() +
geom_line() +
labs(x = NULL, y = NULL) +
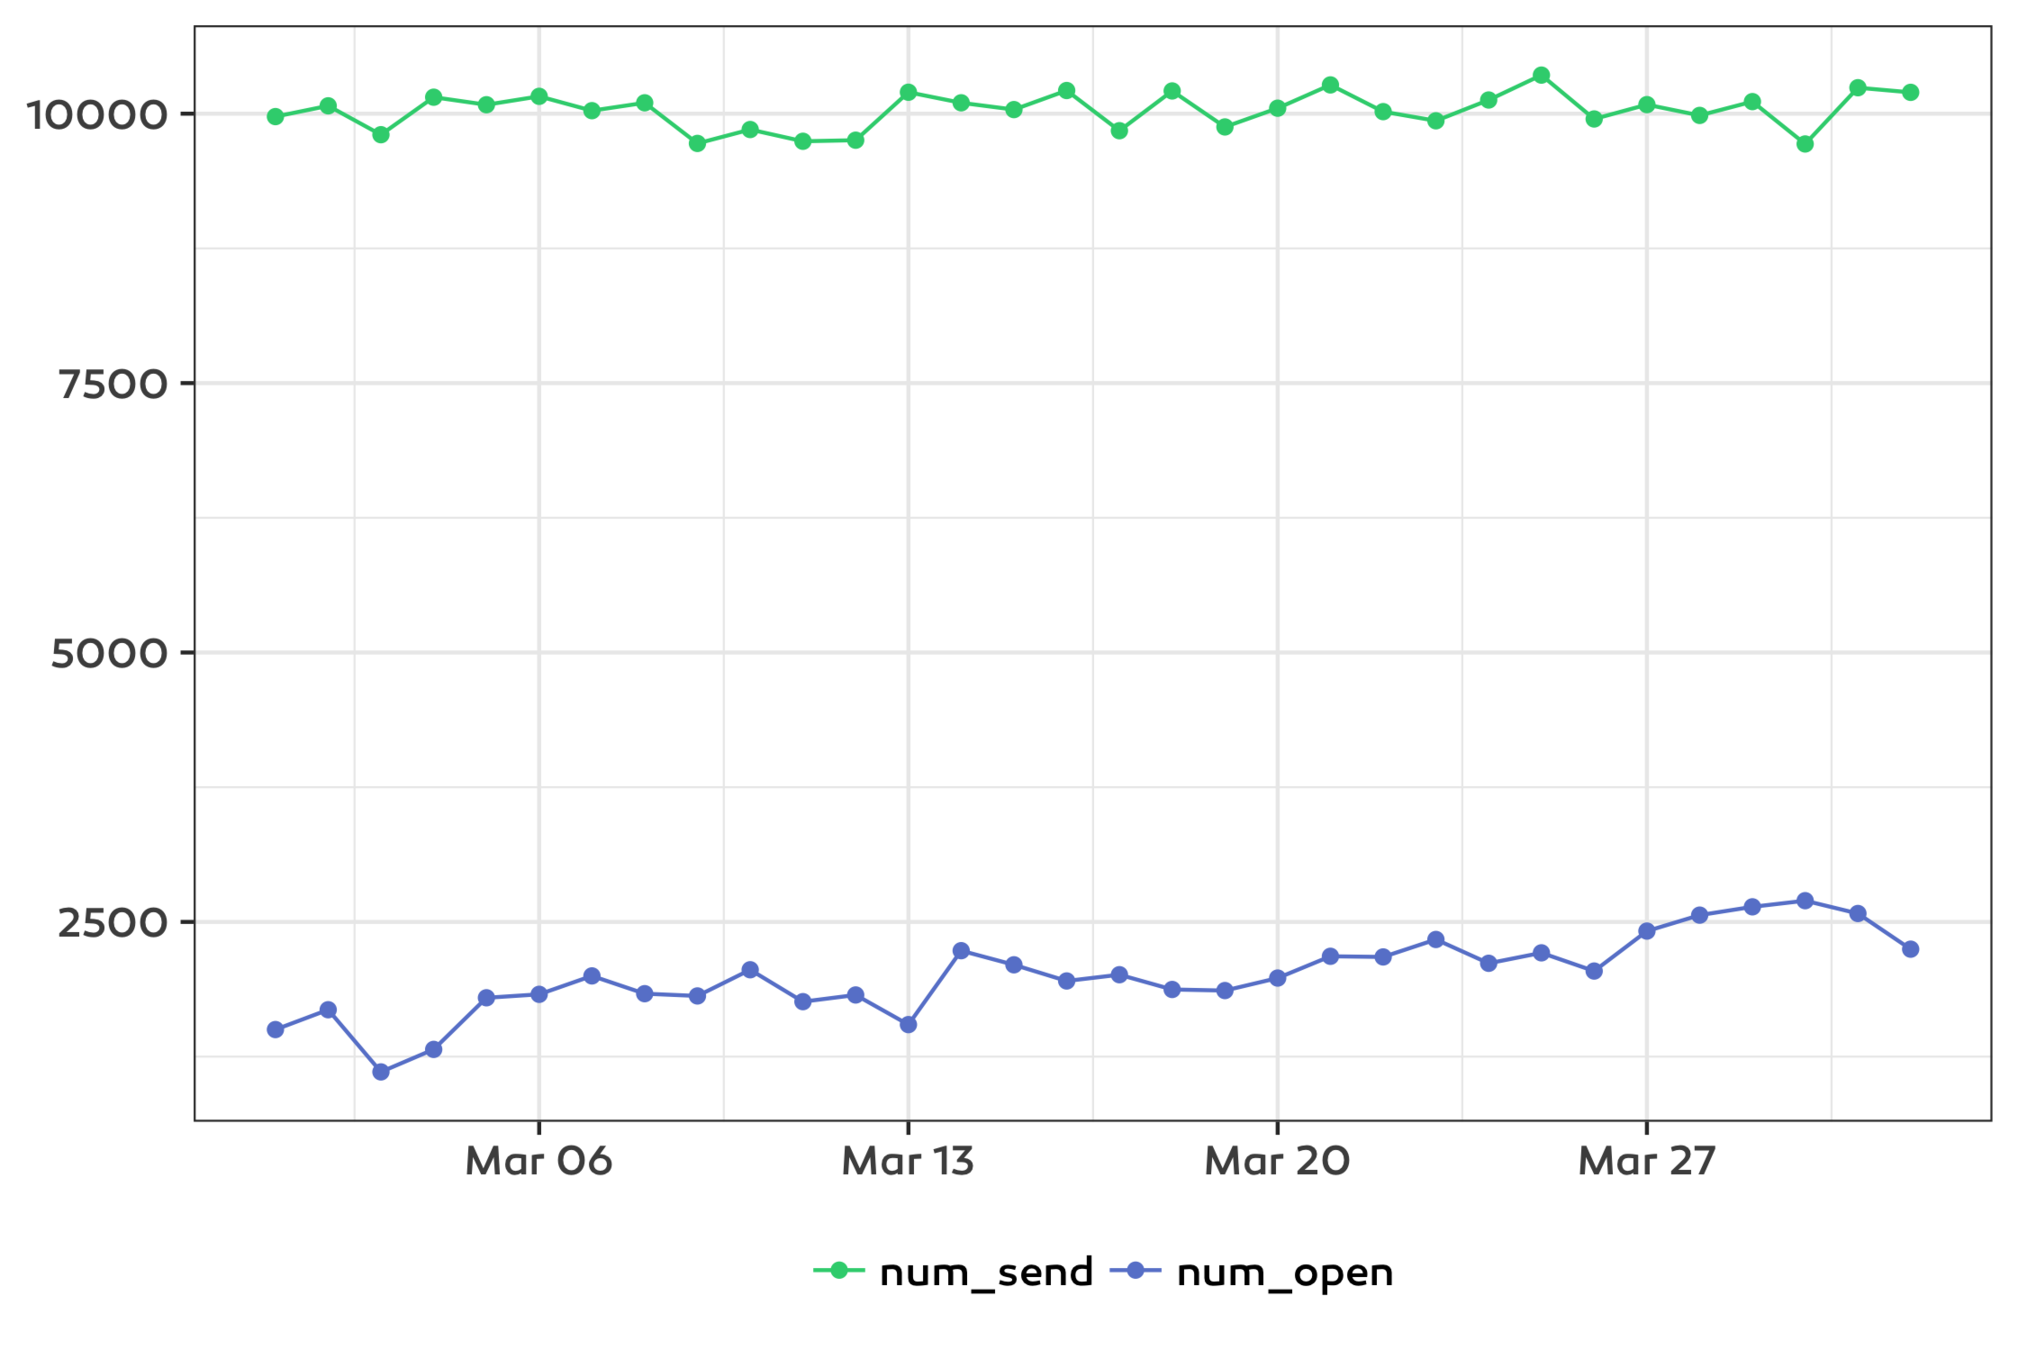
theme(legend.title = element_blank())ggplot(dt, aes(x = date)) +
geom_point(aes(y = num_send), col = ems_colors[['green1']]) +
geom_line(aes(y = num_send), col = ems_colors[['green1']]) +
geom_point(aes(y = num_open), col = ems_colors[['blue1']]) +
geom_line(aes(y = num_open), col = ems_colors[['blue1']]) +
labs(x = NULL, y = NULL) +
geom_point(data = data.table('v' = c('num_send', 'num_open'),
'date' = as.Date('2017-03-01'),
'y' = 2500),
mapping = aes(col = v, y = y, shape = NA)) +
geom_line(data = data.table('v' = c('num_send', 'num_open'),
'date' = as.Date('2017-03-01'),
'y' = 2500),
mapping = aes(col = v, y = y, linetype = NA)) +
theme(legend.title = element_blank())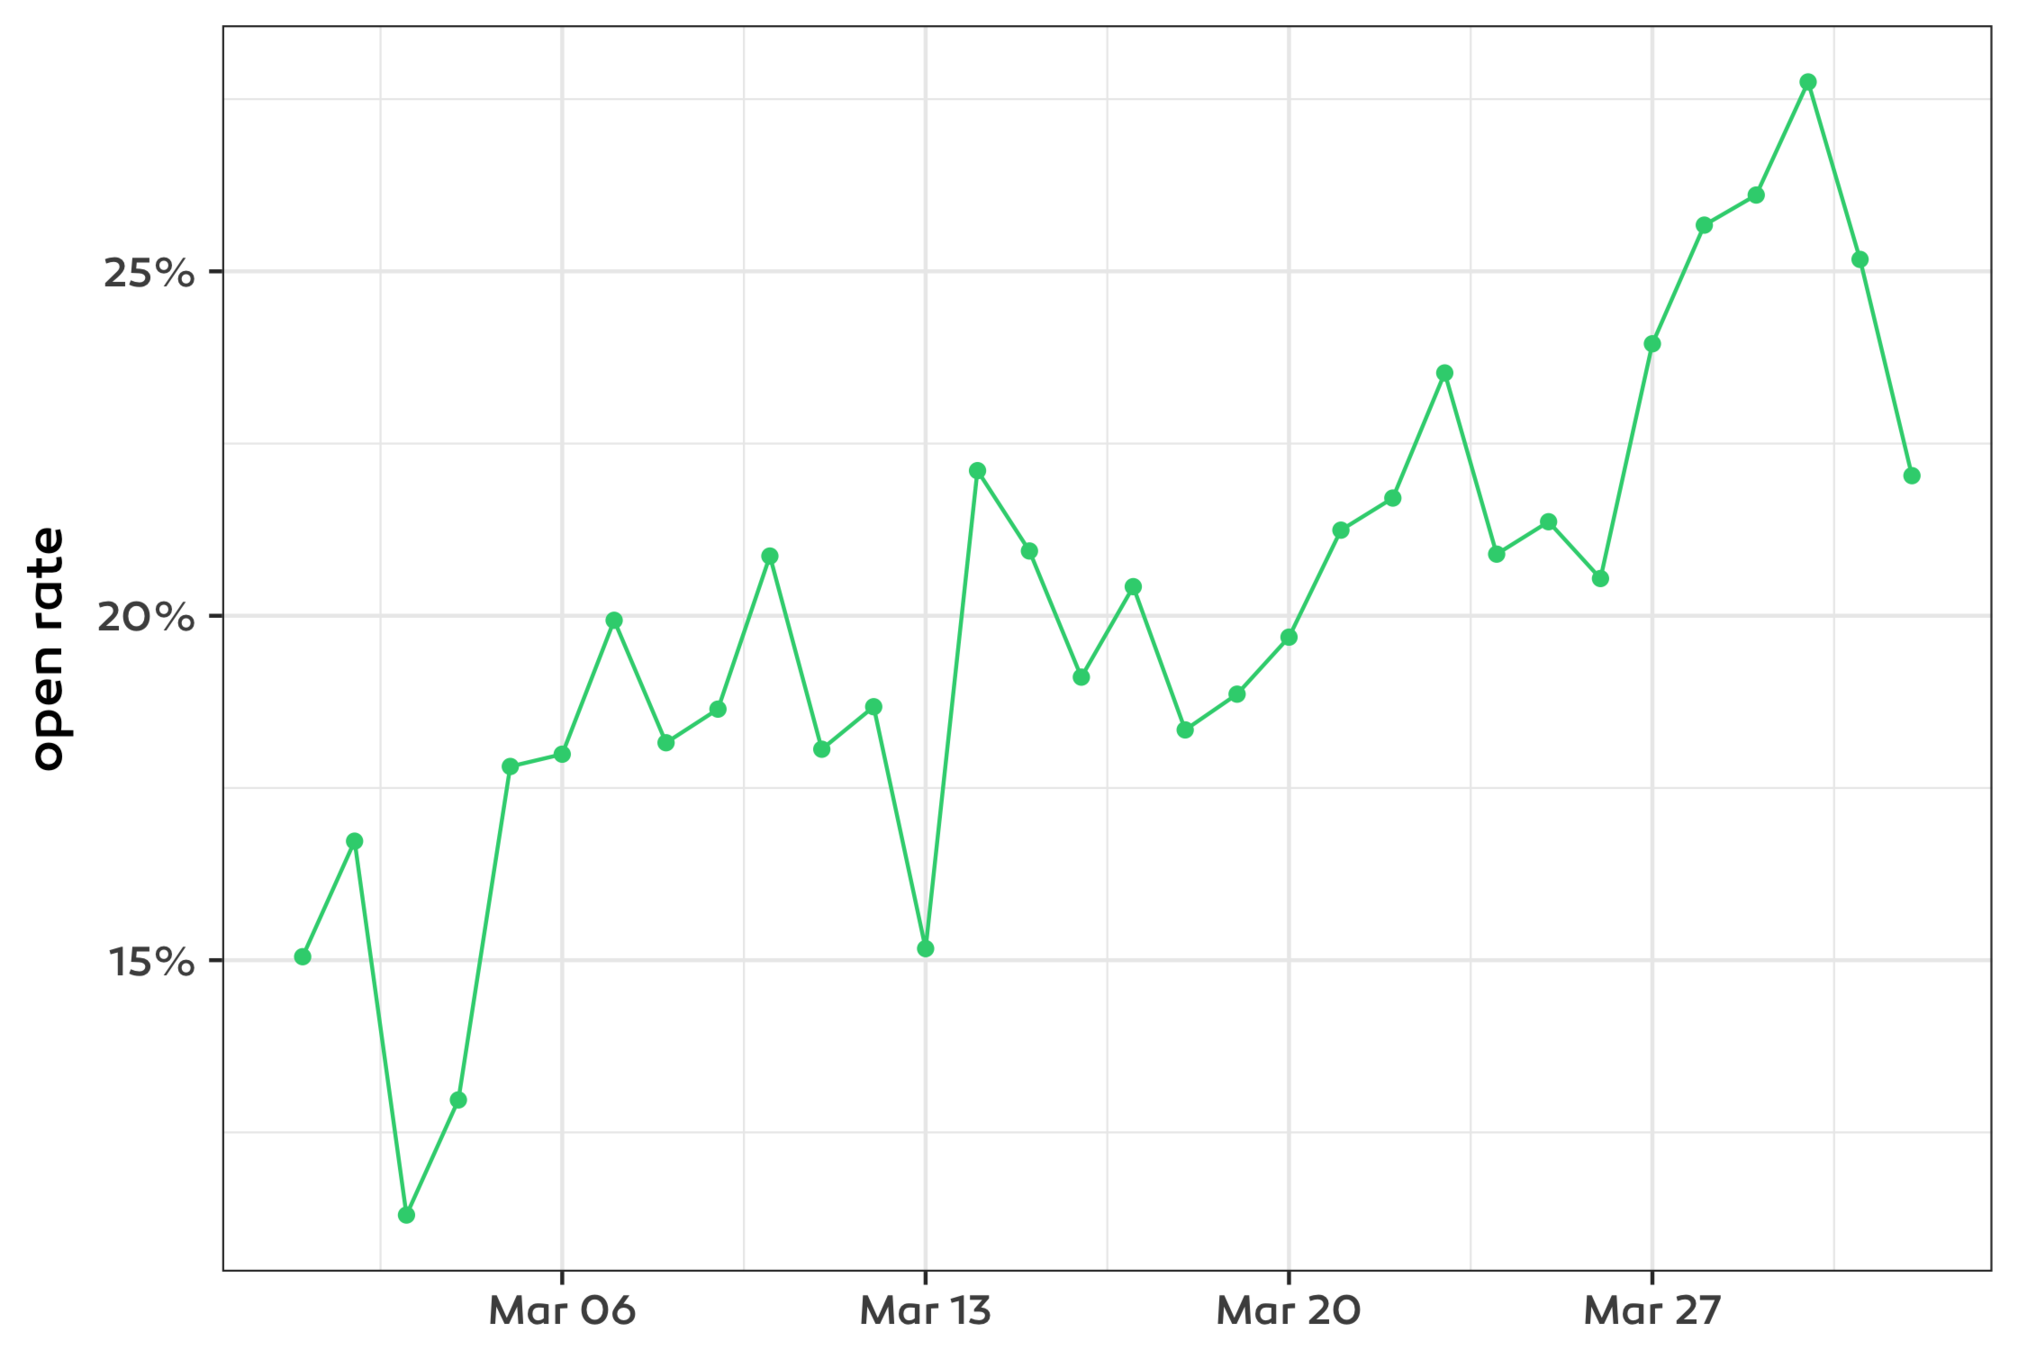
ggplot(dt, aes(x = date, y = num_open / num_send)) +
    geom_point() +
    geom_line() +
    scale_y_continuous(labels = scales::percent_format()) +
    labs(x = NULL, y = 'open rate')
gather
separate
spread
unite
| send_day | num_open | num_click |
|---|---|---|
| ápr. 15. | 1000 | 300 |
| ápr. 16. | 15000 | 500 |
| send_day | event_type | number |
|---|---|---|
| ápr. 15. | click | 300 |
| ápr. 15. | open | 1000 |
| ápr. 16. | click | 500 |
| ápr. 16. | open | 15000 |
gather
spread
| user | birth year | spend |
|---|---|---|
| Catherine | 1995 | 300 |
| Jácint | 1997 | 500 |
| user | century | year | spend |
|---|---|---|---|
| Catherine | 19 | 95 | 300 |
| Jácint | 19 | 97 | 500 |
separate
unite
| user | demographic | spend |
|---|---|---|
| Catherine | us_1995 | 300 |
| Jácint | hu_1997 | 500 |
| user | language | birth | spend |
|---|---|---|---|
| Catherine | us | 1995 | 300 |
| Jácint | hu | 1997 | 500 |
separate
unite
Non-tidy data
-
efficiency
-
history
graph
corpus
matrix
data
tools & usage
Tidy data
By Czeller Ildi
Tidy data
Tidy data concepts, its relationship to relational databases, data cleaning, and how it eases modelling, visualising and transforming as well.


