Introduction to GIS
Intro
A GIS consists of:
Digital Data –-- the geographical information that you will view and analyse using computer hardware and software.
Computer Hardware –-- computers used for storing data, displaying graphics and processing data.
Computer Software –-- computer programs that run on the computer hardware and allow you to work with digital data. A software program that forms part of the GIS is called a GIS Application.
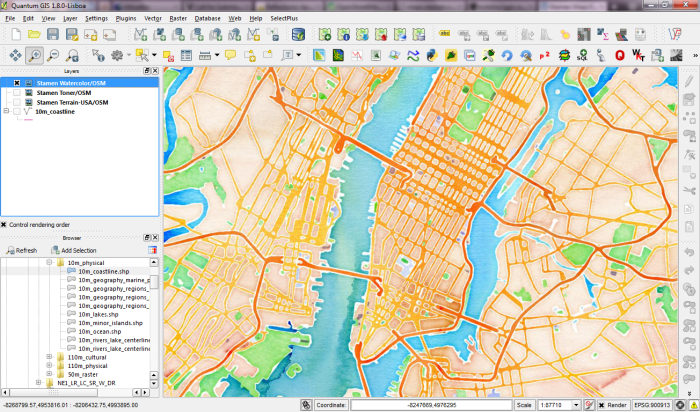
Intro
GIS is a relatively new field — it started in the 1970’s. These days, anyone with a personal computer or laptop can use GIS software. GIS is more than just software, it refers to all aspects of managing and using digital geographical data. In the tutorials that follow we will be focusing on GIS Software.
There is no clear definition of what a GIS software is, one I like is "a toolbox to support spatial thinking"
Where it began
Intro
GIS Applications are normally programs with a GUI that can be manipulated using the mouse and keyboard. The application provides menus near to the top of the window (File, Edit etc.) which, when clicked using the mouse, show a panel of actions.
Note: there are other ways, Python, R, etc. offer scriptable GIS tools / workflows
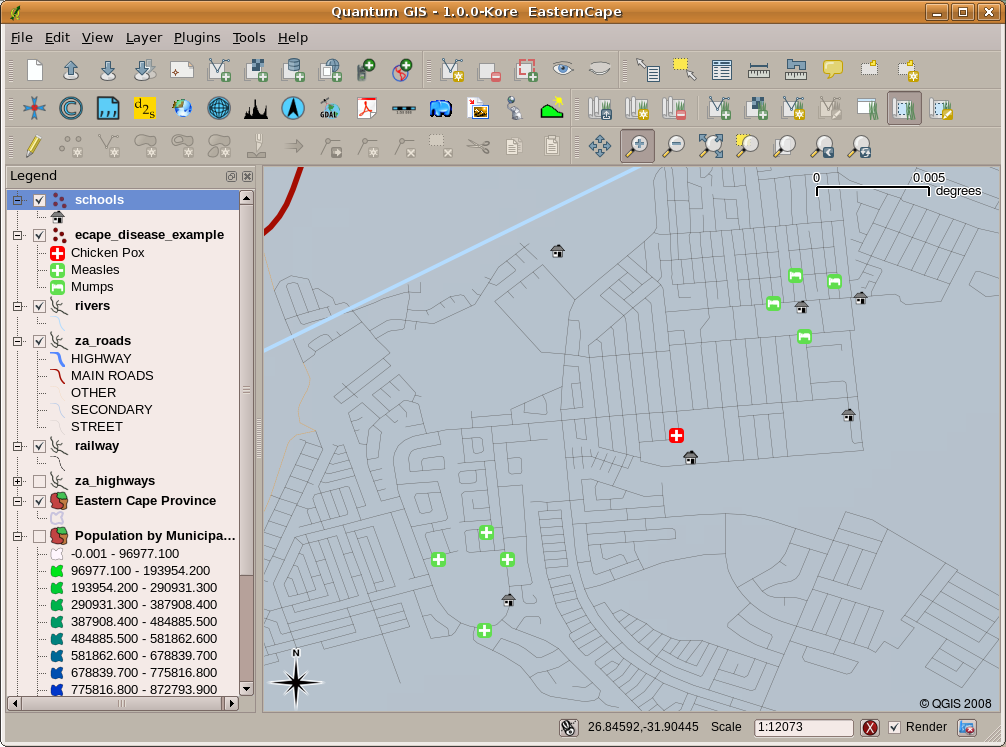
apps
Intro
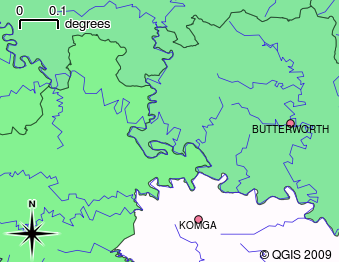
A common feature of GIS is that they allow you to associate information (non-geographical data) with places (geographical data).
For example, a health care worker could store the person’s age and gender on her table. When the GIS Application draws the layer, you can tell it to draw the layer based on gender, or based on disease type, and so on.
The big idea
Intro
- Geoscience: why not?
- web integration: the future
- Open source: my bias
- Mapmaking
This course focusses on:
This course doesn't cover:
This course focusses on:
This course focusses on:
- Databases
- Spatial statistics
Thinking spatially
GIS is a relatively new field — it started in the 1970’s. These days, anyone with a personal computer or laptop can use GIS software. GIS is more than just software, it refers to all aspects of managing and using digital geographical data. In the tutorials that follow we will be focusing on GIS Software.
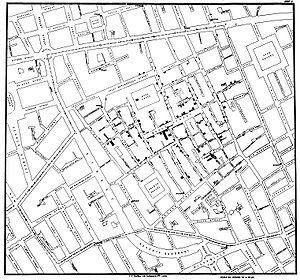
Where it began
Thinking spatially
Observe as much as you can in the room and think about how these things are related or interacting with one another spatially
Write down the ways you could:
1) Describe the spatial relationships you see
2) What the spatial relationships might mean

Spatial thinking excercise
Thinking spatially
Always try to:
- ask questions about spatial patterns and relationships
- form hypotheses about patterns and relationships and their underlying process
- question assumptions about what we think we might be know
Spatial thinking should be critical
Thinking spatially
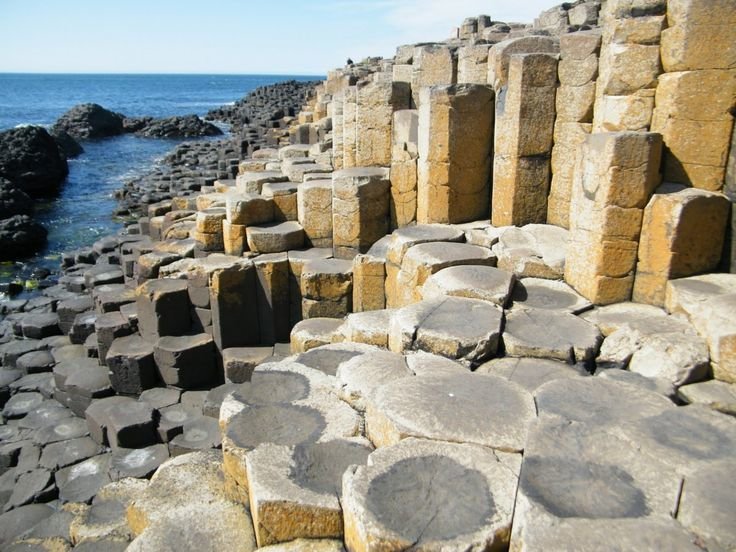
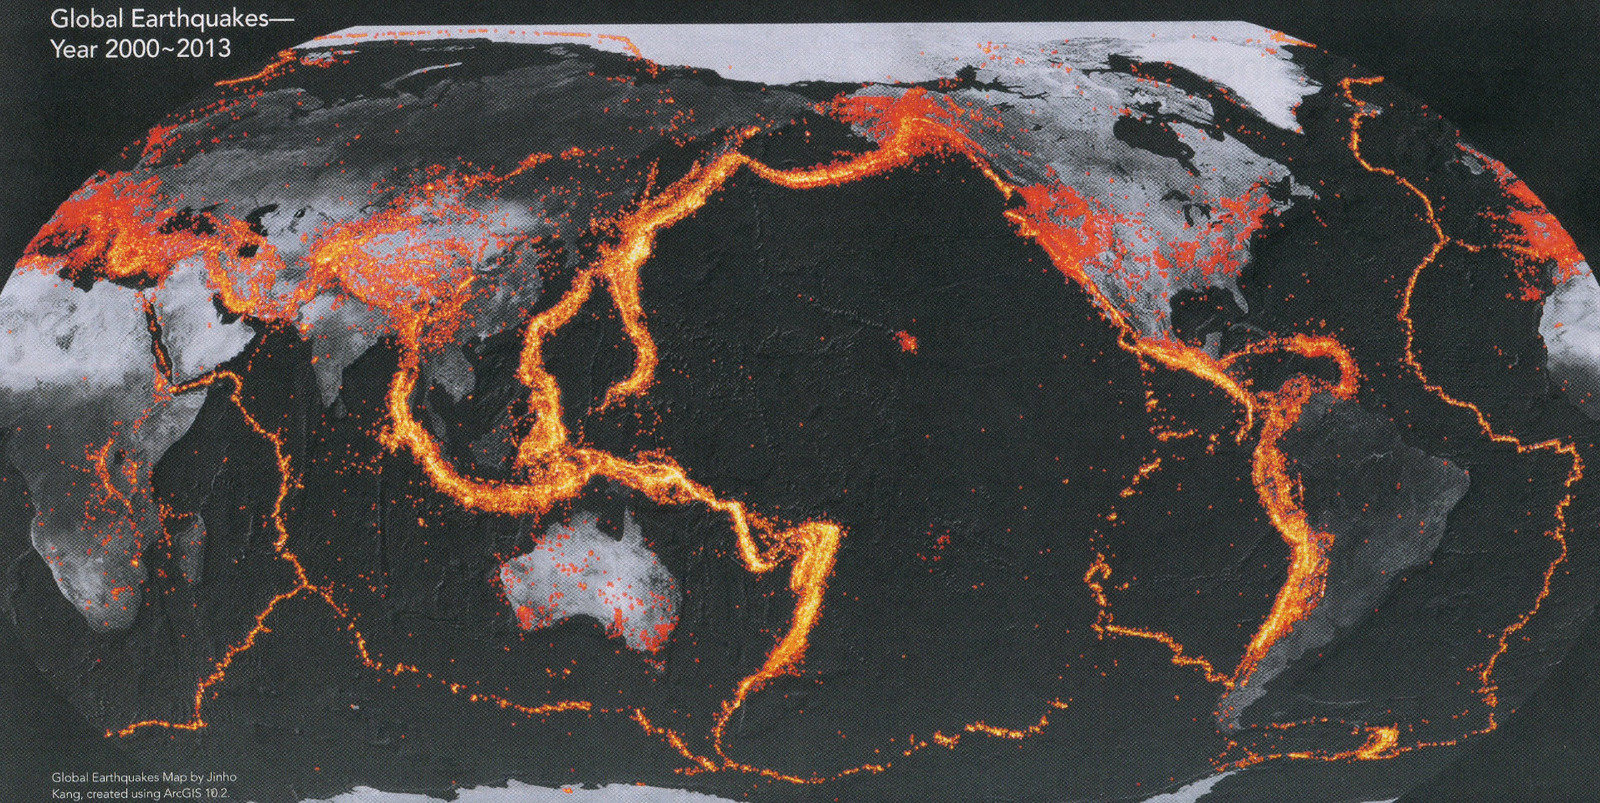
We are generally interested in patterns that are non-random
There is typically an underlying process that results in the establishment of the pattern
Spatial configuration
Thinking spatially
- Random
- Clustered
- Regular
- Periodic
- Self-similar (scale invariant)
Types of patterns

Thinking spatially
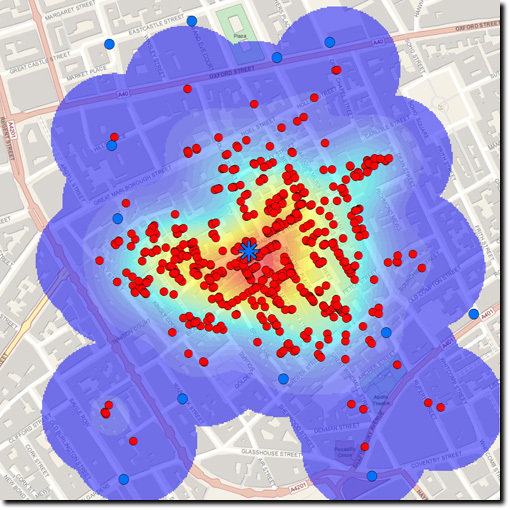
Point classification (machine learning)

Thinking spatially
Connectivity
- nodes / vertices / adjacency
- Orientation
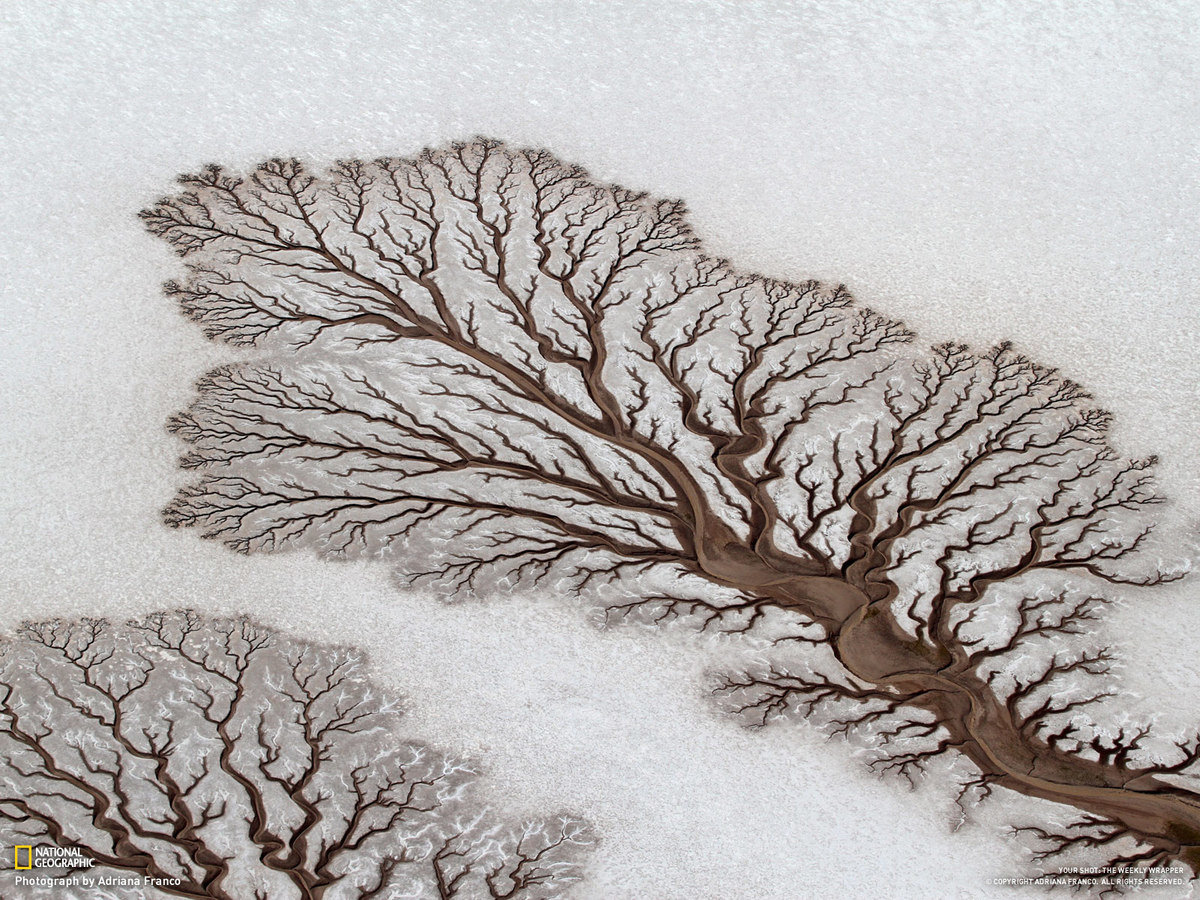
- Self-similarity (scale invariant)
For a stone, when it is examined, will be found a mountain in miniature. John Ruskin
Thinking spatially
Connectivity
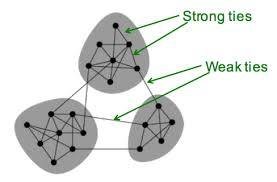
- nodes / vertices / adjacency
- Orientation
- Self-similarity (scale invariant)
Thinking spatially
Connectivity
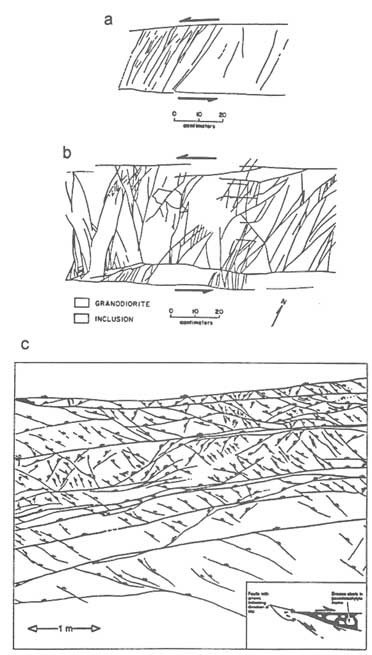
- nodes / vertices / adjacency
- Orientation
- Self-similarity (scale invariant)
Thinking spatially
The idea of developing our ability to think spatially and conduct geospatial analysis, has required us to develop methods of creating and storing geospatial data

Where it led to

GIS data models
Vector data provide a way to represent real world features within the GIS environment. A feature is anything you can see on the landscape. Imagine you are standing on the top of a hill. Looking down you can see houses, roads, trees, rivers, and so on (see figure_landscape). Each one of these things would be a feature when we represent them in a GIS Application
Vector data
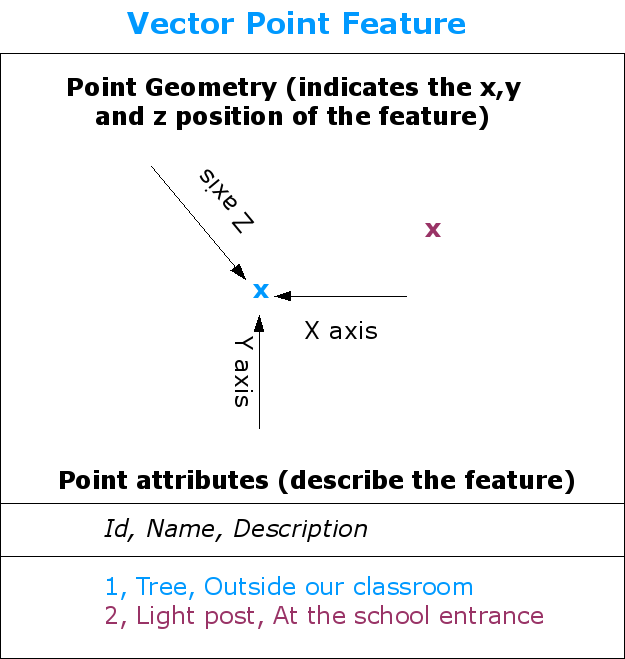
A vector feature has its shape represented using geometry. The geometry is made up of one or more interconnected vertices. A vertex describes a position in space using an X, Y and optionally z axis. Geometries which have vertices with a Z axis are often referred to as 2.5D since they describe height or depth at each vertex, but not both.
Vector data
GIS data models
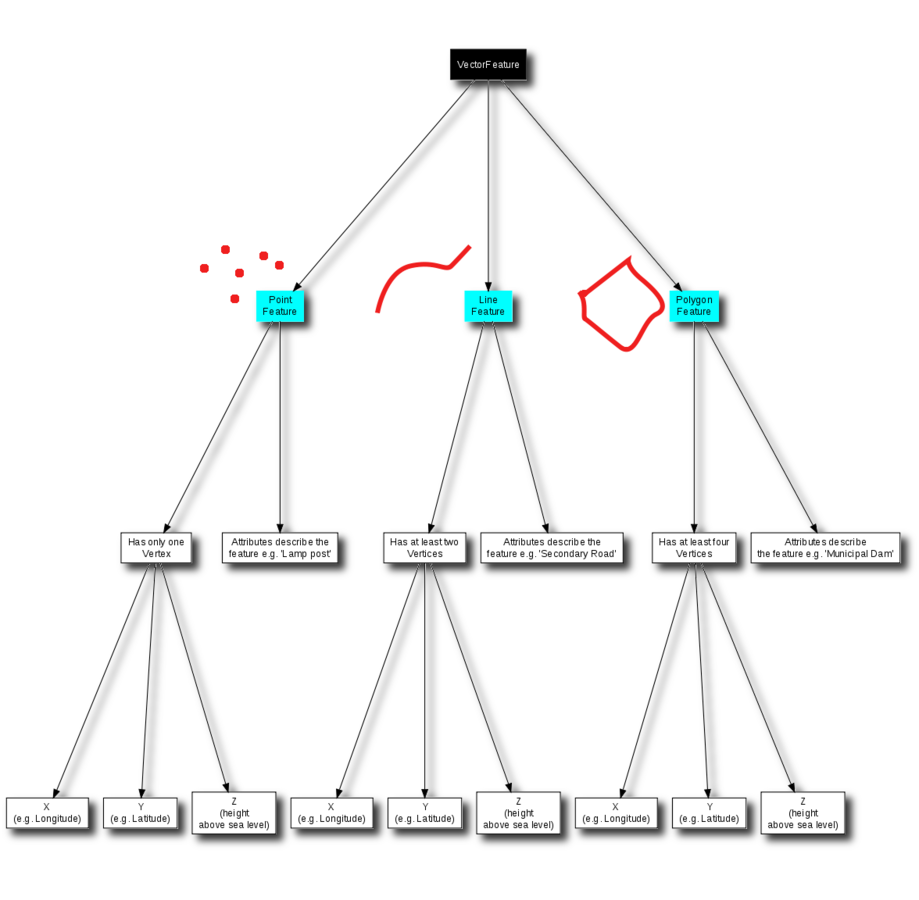
When a feature’s geometry consists of only a single vertex, it is referred to as a point feature. Where the geometry consists of two or more vertices and the first and last vertex are not equal, a polyline feature is formed. Where three or more vertices are present, and the last vertex is equal to the first, an enclosed polygon feature is formed.
Points lines polygons
GIS data models
The first thing we need to realise when talking about point features is that what we describe as a point in GIS is a matter of opinion, and often dependent on scale. let’s look at cities for example. If you have a small scale map (which covers a large area), it may make sense to represent a city using a point feature.

Points in detail
GIS data models
The shapefile format is a popular geospatial vector data format for geographic information system (GIS) software. It is developed and regulated by Esri as a (mostly) open specification for data interoperability among Esri and other GIS software products.
Mandatory files
.shp — shape format; the feature geometry itself
.shx — shape index format; a positional index of the feature geometry to allow seeking forwards and backwards quickly
.dbf — attribute format; columnar attributes for each shape, in dBase IV format
Other files
.prj — projection format; the coordinate system and projection information, a plain text file describing the projection using well-known text format
.sbn and .sbx — a spatial index of the features
Shapefiles
GIS data models
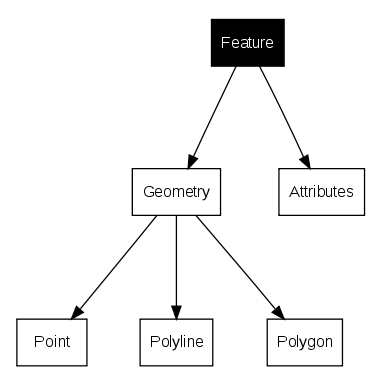
Now that we have described what vector data is, let’s look at how vector data is managed and used in a GIS environment. Most GIS applications group vector features into layers. Features in a layer have the the same geometry type (e.g. they will all be points) and the same kinds of attributes (e.g. information about what species a tree is for a trees layer).
Features and Layers
GIS data models
vector attributes
If every line on a map was the same colour, width, thickness, and had the same label, it would be very hard to make out what was going on. The map would also give us very little information.

Overview
vector attributes
Attribute data is the power behind GIS

Why is it important
vector attributes
All attribute data can be categorized as one of:
- nominal - descriptive, categorical
- ordinal - imply a ranking (but not scale)
- interval - numeric values
- cyclic - some kind of continuous data, that repeats
attributes abstractly
vector attributes
It is very common to want to classify attribute data,
interval data is commonly divided into classes using:
- natural breaks - an algorithm `looks` for breaks
- quantile breaks - each group has the same sumber of observation
- equal interval breaks
- standard deviation
Classification
vector attributes
A table is the two dimensional set of rows and columns that store our data:
- Each row represents a unique data point or record.
- Each column represents a field, or an attrubute
- Tables are also called flat files - particularly when compared to other database types.
Tables

vector attributes
The fact that features have attributes as well geometry in a GIS Application opens up many possibilities. For example we can use the attribute values to tell the GIS what colours and style to use when drawing features. The process of setting colours and drawing styles is often referred to as setting feature symbology.
Symbology
We've discussed spatial data models - vectors and rasters.
It's going to be really important to learn how to visualise these data types
Brainstorm, what are the basic ways we could represent and represent points with different attributes?
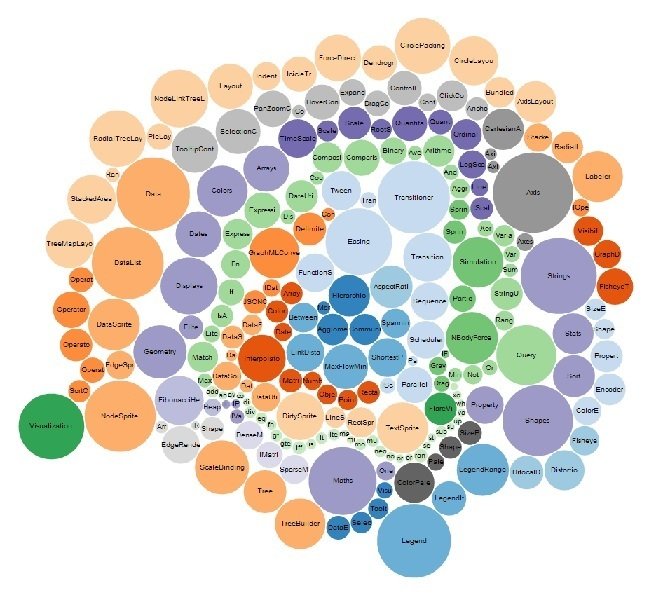
(or styling)
Symbology
A really easy way to visualise data (particularly non-numeric data) is to generate a classification scheme, linking unique attribute values to a symbol
How many buckets before the information you're conveying becomes overwhelming?
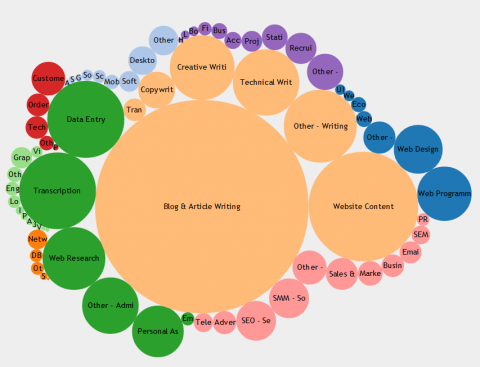
Points: classifications
Symbology
If a feature is symbolised without using any attribute table data, it can only be drawn in a simple way. For example with point features you can set the colour and marker (circle, square, star etc.) but that is all. You cannot tell the GIS to draw the features based on one of its properties in the attribute table.
Symbols
Symbology
Sometimes the attributes of features are not numeric, but instead strings are used. ‘String’ is a computer term meaning a group of letters, numbers and other writing symbols. Strings attributes are often used to classify things by name. We can tell the GIS Application to give each unique string or number its own colour and symbol.
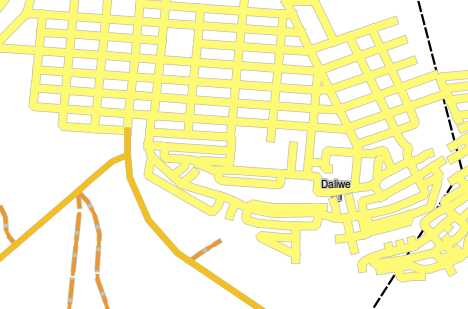
Unique symbols
Symbology
Sometimes it is useful to draw features in a colour range from one colour to another. The GIS Application will use a numerical attribute value from a feature (e.g. contour heights or pollution levels in a stream) to decide which colour to use.
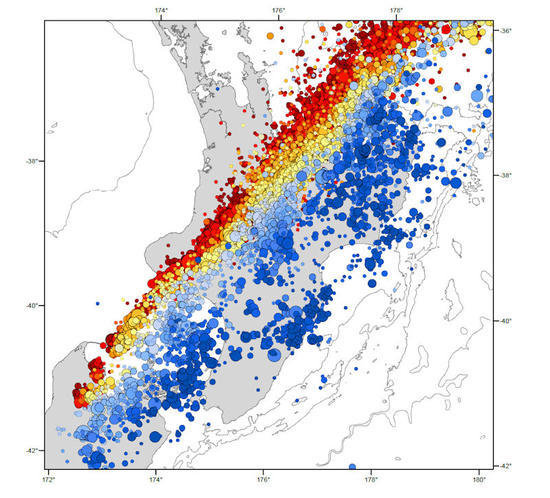
Continuous colour symbols
Symbology
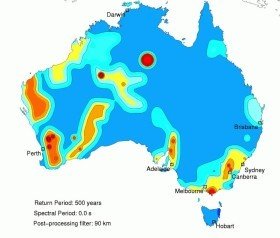
Setting colours based on discrete groups of attribute values is called Graduated Symbology in QGIS.
Contour lines are a good example of this. Each contour usually has an attribute value called ‘height’ that contains information about what height that contour represents.
Graduated colour symbols
Topology
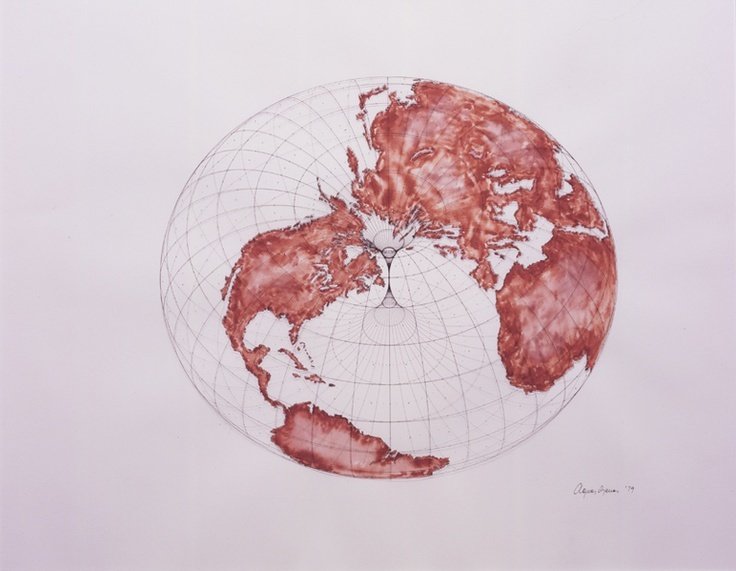
Topology has several meanings.
Within mathematics, topology is the mathematical study of the properties that are preserved through deformations, twistings, and stretchings of objects.
Definitions
Topology
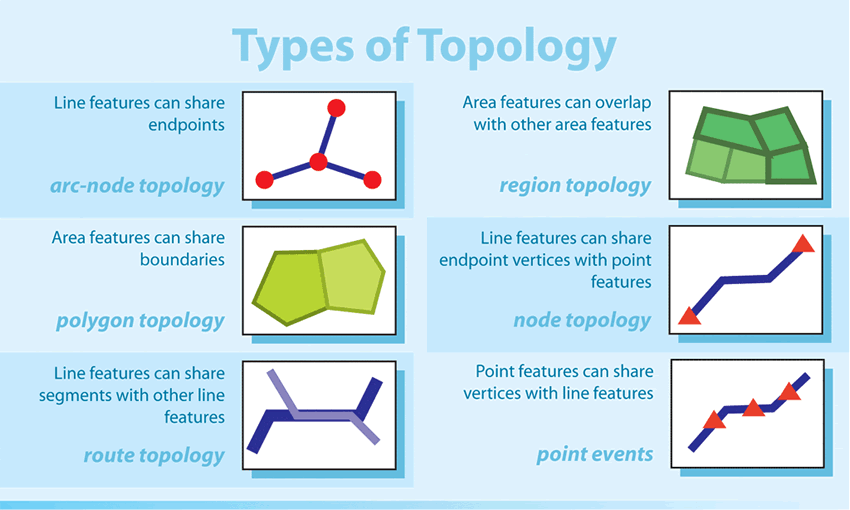
Within GIS, topology refers to the spatial relationships between connecting or adjacent features (points, polylines and polygons) in a geographic data layer.
...or, rules that describe how geographic elements interact with one another
Many phenomena are subject to topological constraints: for example, two counties cannot overlap, two contours cannot cross, and the boundary of an area cannot cross itself.
Definitions
Topology
Topology
Elements may interact with one another via:
- adjacency
- containment
- overlap
- intersection
- proximity
Definitions
Topology
Many GIS applications provide tools for topological editing. For example in QGIS you can enable topological editing to improve editing and maintaining common boundaries in polygon layers. A GIS such as QGIS ‘detects’ a shared boundary in a polygon map so you only have to move the edge vertex of one polygon boundary and QGIS will ensure the updating of the other polygon boundaries as shown in
Tools

Topology
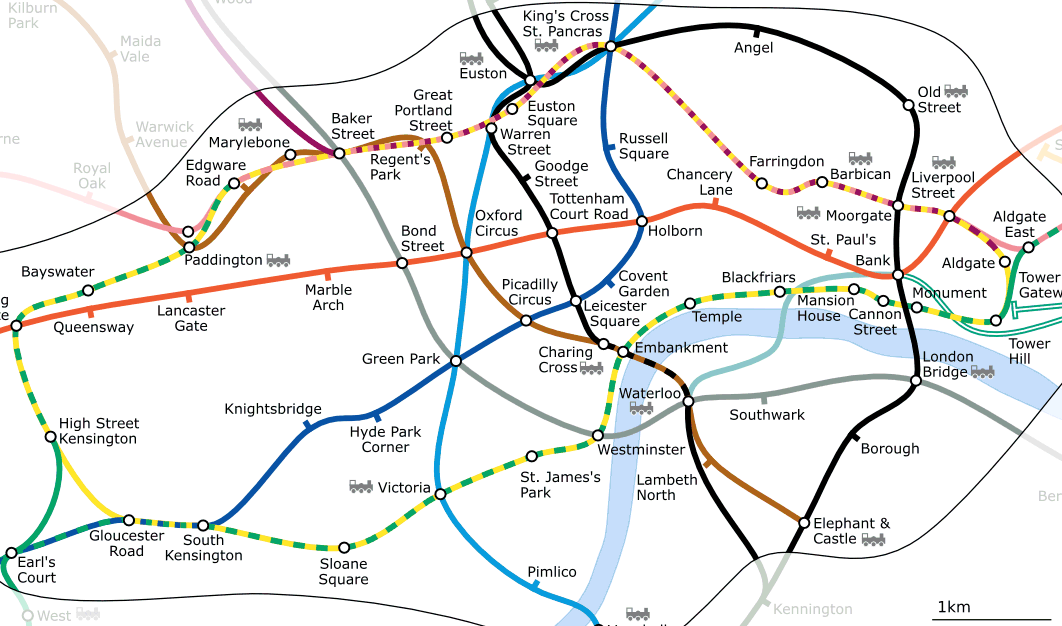
On a sightseeing tour of London you plan to visit St. Paul’s Cathedral first and in the afternoon Covent Garden Market for some souvenirs. This requires topological information (data) about where it is possible to change trains. Looking at a map of the underground, the topological relationships are illustrated by circles that show connectivity.
Topic

Topology
There are different types of topological errors and they can be grouped according to whether the vector feature types are polygons or polylines. Topological errors with polygon features can include unclosed polygons, gaps between polygon borders or overlapping polygon borders. A common topological error with polyline features is that they do not meet perfectly at a point (node)
Errors

Databases & queries
We have discussed feature attribute tables - which are a kind of database, and are commonly called flat files.
For larger projects, it may be useful to create a proper database.
Databases & queries
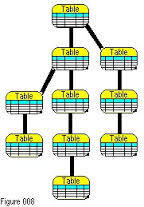
Hierarchical files store data in more than one type of record. This method is usually described as a "parent-child, one-to-many" relationship. One field is key to all records, but data in one record does not have to be repeated in another.
Databases & queries
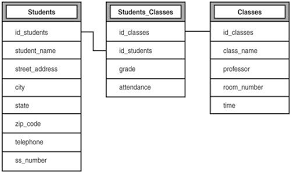
Relational database: A relational database is a database that groups data using common attributes found in the data set. The resulting "clumps" of organized data are much easier for people to understand.
A data structure in which collections of tables are logically associated with each other by shared fields.
Databases & queries
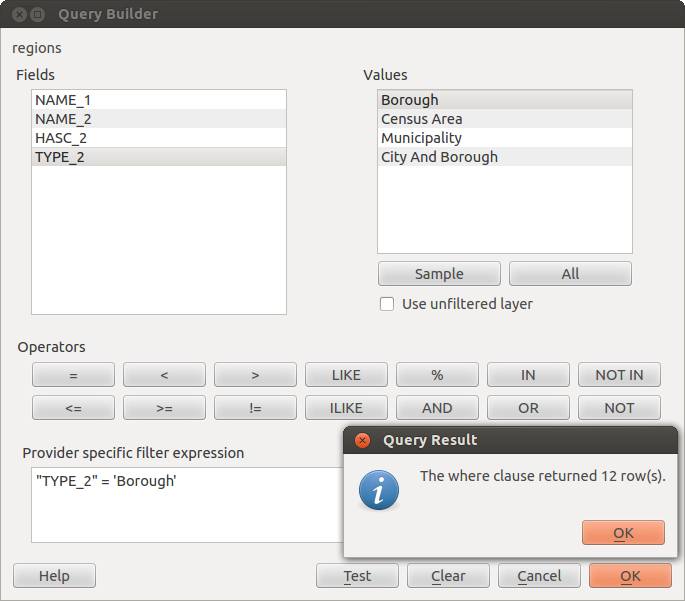
Queries will be covered in a separate lecture...but we need to know a little bit now
The QGIS Query Builder allows you to define a subset of a table using a SQL-like WHERE clause and display the result in the main window. The query result then can be saved as a new vector layer.
Queries / filtering
Databases & queries

Queries / filtering
The Fields list contains all attribute columns of the attribute table to be searched. To add an attribute column to the SQL where clause field, double click its name in the Fields list. Generally you can use the various fields, values and operators to construct the query or you can just type it into the SQL box.
The Values list lists the values of an attribute table. To list all possible values of an attribute, select the attribute in the Fields list and click the [all] button. To list the first 25 unique values of an attribute column, select the attribute column in the Fields list and click the [Sample] button. To add a value to the SQL where clause field, double click its name in the Values list.
The Operators section contains all usable operators. To add an operator to the SQL where clause field, click the appropriate button. Relational operators ( = , > , ...), string comparison operator (LIKE), logical operators (AND, OR, ...) are available.
Databases & queries
Spatial queries are core to many types of GIS analysis. In QGIS, this functionality is available via the Spatial Query. This allows you to make a spatial query (i.e., select features) in a target layer with reference to another layer.
Spatial queries
- Contains
- Equals
- Overlap
- Crosses
- Intersects
- Is disjoint
- Touches
- Within
Joins
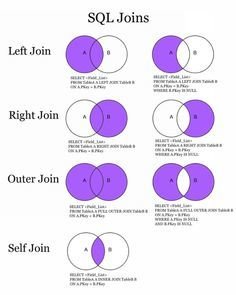
Table joins
Not every dataset you want to use comes as a shapefile, or in a spatial format. Often the data would come as a table or a spreadsheet and you would need to link it with your existing spatial data for use in your analysis. This operation is known as a Table Join and this tutorial will cover how to carry out table joins in QGIS.
Joins
Spatial joins
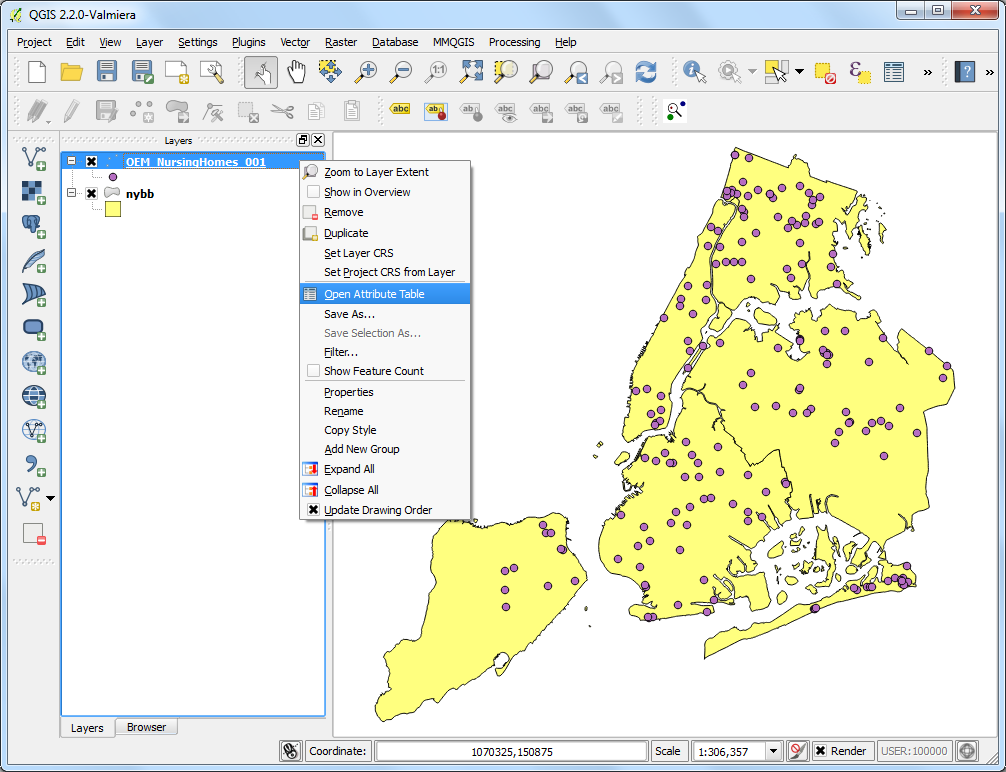
Spatial Join is a classic GIS problem - transferring attributes from one layer to another based on their spatial relationship. In QGIS, this functionality is available through the Join Attributes by Location tool.
A spatial join would enable you to sum a field stored on points, an a per polygon basis. Alternatively, you might want to transfer polygon attributes to the points they enclose.
Spatial analysis
Now that you have edited a few features, you must want to know what else one can do with them. Having features with attributes is nice, but when all is said and done, this doesn’t really tell you anything that a normal, non-GIS map can’t.
The key advantage of a GIS is this: a GIS can answer questions.
Overview
Spatial analysis
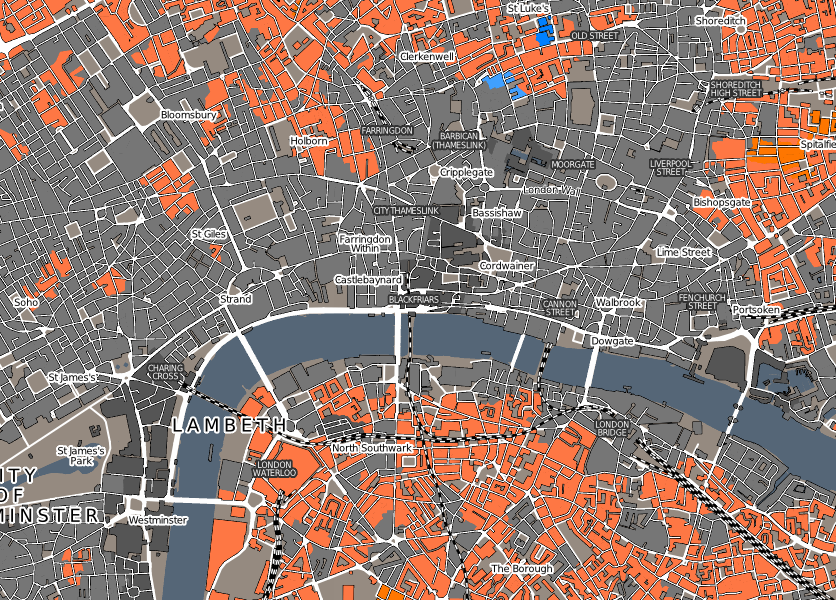
Spatial analysis uses spatial information to extract new and additional meaning from GIS data. Usually spatial analysis is carried out using a GIS Application. GIS Applications normally have spatial analysis tools for feature statistics (e.g. how many vertices make up this polyline?) or geoprocessing such as feature buffering.

Overview
Spatial analysis
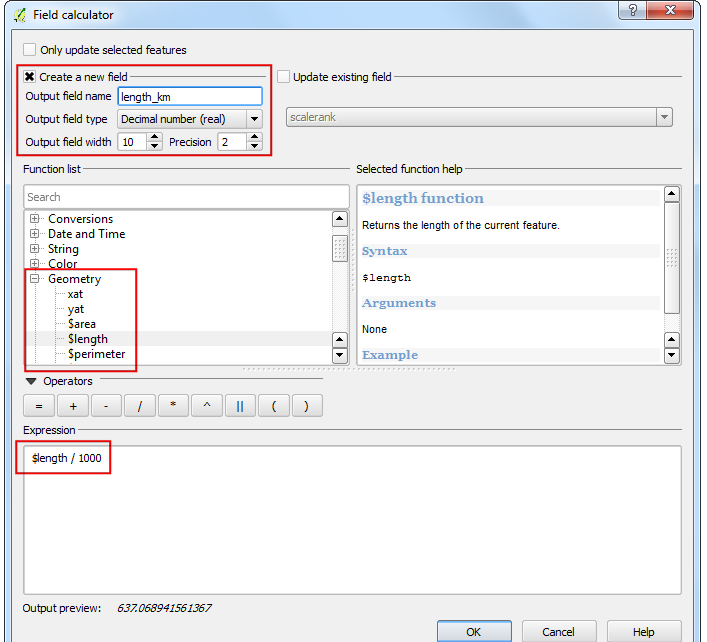
Geometry statistics can easily be computed on shapefiles:
- length
- area
- perimeter
Geometry stats.
Spatial analysis
Buffering usually creates two areas: one area that is within a specified distance to selected real world features and the other area that is beyond. The area that is within the specified distance is called the buffer zone.
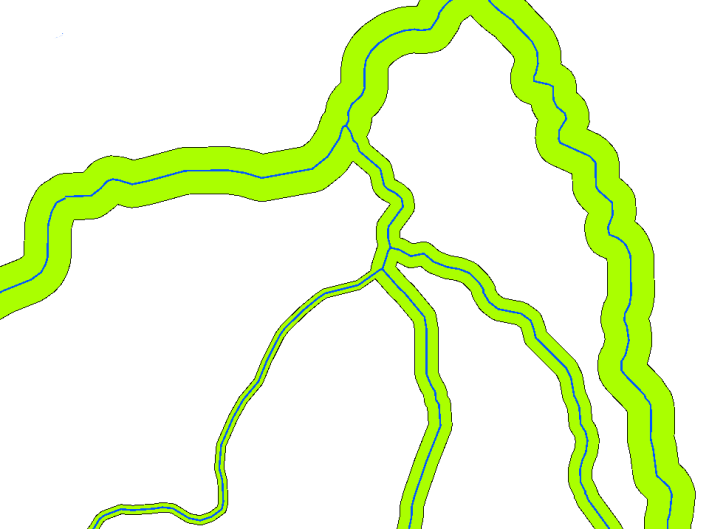
Buffers
Spatial analysis
Spatial overlay is a process that allows you to identify the relationships between two polygon features that share all or part of the same area. The output vector layer is a combination of the input features information .

Spatial overlay
Spatial analysis
The power of GIS lies in analysing multiple data sources together. Often the answer you are seeking lies in many different layers and you need to do some analysis to extract and compile this information. One such type of analysis is Points-in-Polygon. When you have a polygon layer and a point layer - and want to know how many or which of the points fall within the bounds of each polygon, you can use this method of analysis.
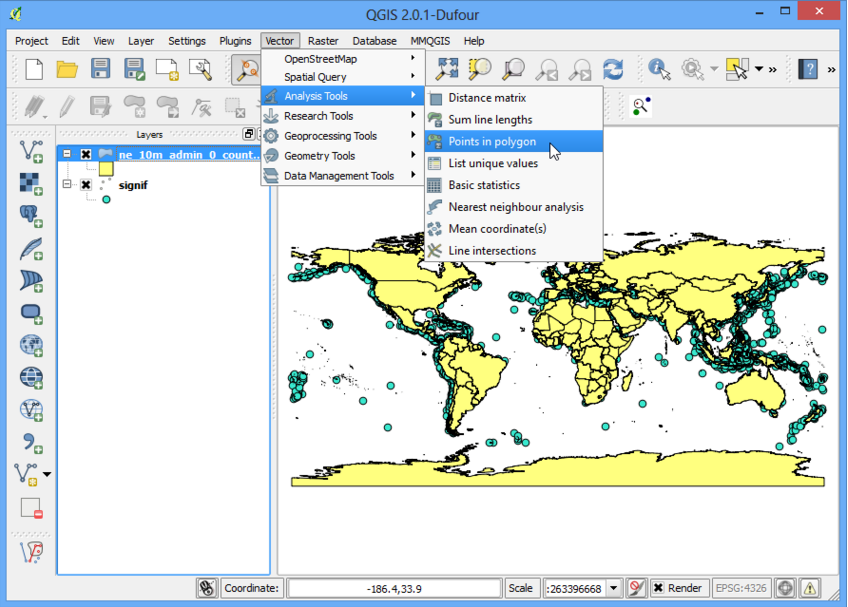
Points in polygon
Spatial analysis
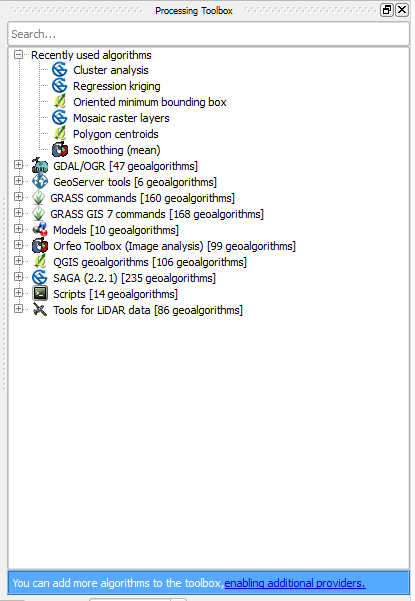
The Toolbox is the main element of the processing GUI, and the one that you are more likely to use in your daily work. It shows the list of all available algorithms grouped in different blocks, and it is the access point to run them, whether as a single process or as a batch process involving several executions of the same algorithm on different sets of inputs.
The toolbox
Spatial analysis
The toolbox contains all the available algorithms, divided into so-called “Providers”.
Providers can be (de)activated in the settings dialog. A label in the bottom part of the toolbox will remind you of that whenever there are inactive providers. Use the link in the label to open the settings window and set up providers. We will discuss the settings dialog later in this manual.

The toolbox
Spatial analysis
Once you double-click on the name of the algorithm that you want to execute, a dialog similar to that in the figure below is shown (in this case, the dialog corresponds to the ‘Polygon centroids’ algorithm).
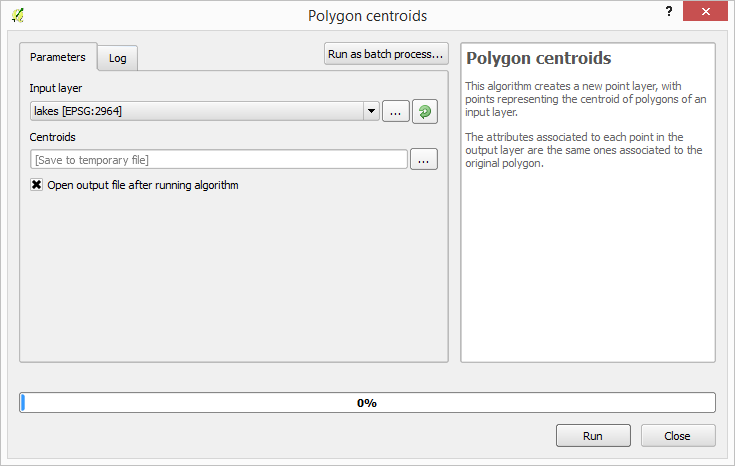
algorithm dialog
Spatial analysis
Data objects generated by an algorithm can be of any of the following types:
A raster layer
A vector layer
A table
An HTML file (used for text and graphical outputs)

algorithm output
Spatial analysis
Can be useful for many reasons,
here the centroids were a useful indication of topology errors - can you identify these?
Polygon centroids
GIS lecture 1
By Dan Sandiford
GIS lecture 1
- 918


