Introduction to GIS 2
Intro
This lecture covers:
- Map projections
- Raster data model
- Raster analysis
- Interpolation
- Web data and open source
- Plugins
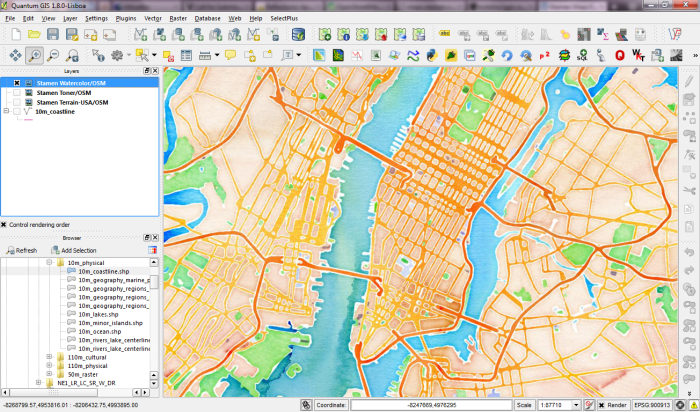
Map projections
Map projections try to portray the surface of the earth or a portion of the earth on a flat piece of paper or computer screen. A coordinate reference system (CRS) then defines, with the help of coordinates, how the two-dimensional, projected map in your GIS is related to real places on the earth. The decision as to which map projection and coordinate reference system to use, depends on the regional extent of the area you want to work in, on the analysis you want to do and often on the availability of data.
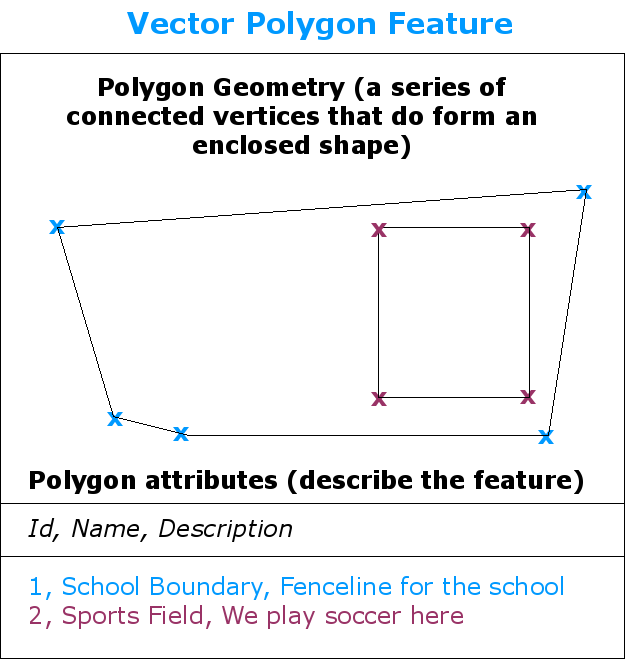
Overview
Map projections
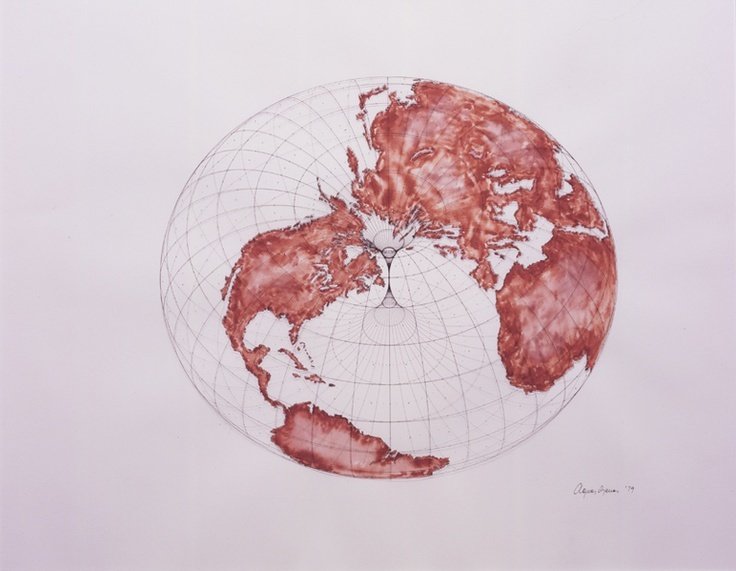
A traditional method of representing the earth’s shape is the use of globes. There is, however, a problem with this approach. Although globes preserve the majority of the earth’s shape and illustrate the spatial configuration of continent-sized features, they are very difficult to carry in one’s pocket. They are also only convenient to use at extremely small scales (e.g. 1:100 million).
Overview
Map projections
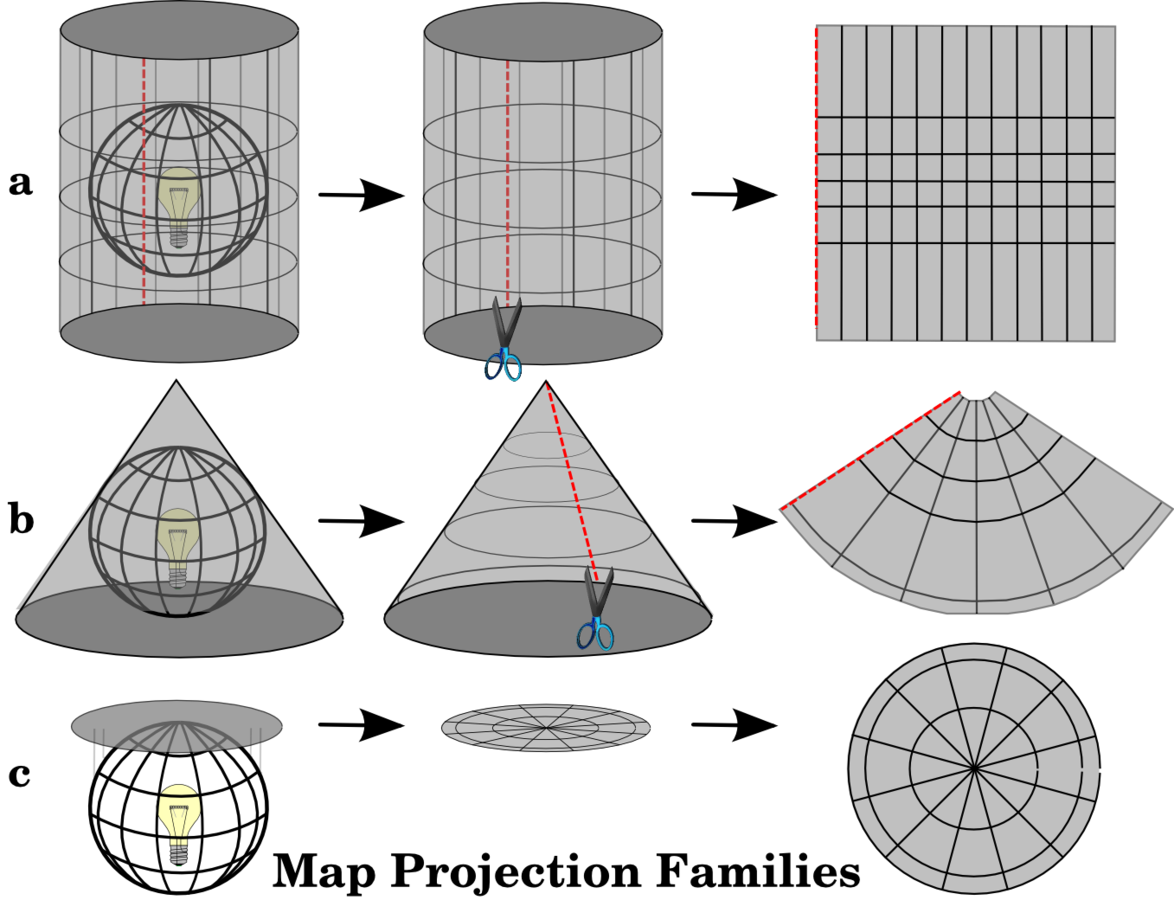
The process of creating map projections can be visualised by positioning a light source inside a transparent globe on which opaque earth features are placed. Then project the feature outlines onto a two-dimensional flat piece of paper. Different ways of projecting can be produced by surrounding the globe in a cylindrical fashion, as a cone, or even as a flat surface.
The three families of map projections
Map projections
The process of creating map projections can be visualised by positioning a light source inside a transparent globe on which opaque earth features are placed. Then project the feature outlines onto a two-dimensional flat piece of paper. Different ways of projecting can be produced by surrounding the globe in a cylindrical fashion, as a cone, or even as a flat surface.

The three families of map projections
Map projections
Therefore, there is a family of planar projections, a family of cylindrical projections, and another called conical projections

The three families of map projections
Map projections
Map projections are never absolutely accurate representations of the spherical earth. As a result of the map projection process, every map shows distortions of angular conformity, distance and area.
It is usually impossible to preserve all characteristics at the same time in a map projection. This means that when you want to carry out accurate analytical operations, you need to use a map projection that provides the best characteristics for your analyses.

Accuracy of map projections
Map projections
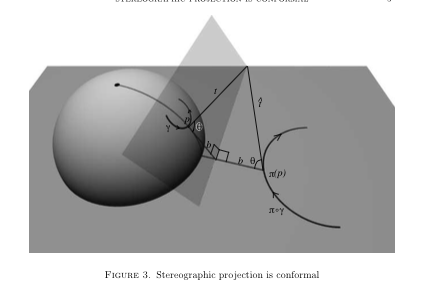
Maintaining correct angular properties can be preserved on a map projection as well. A map projection that retains this property of angular conformity is called a conformal or orthomorphic projection. These projections are used when the preservation of angular relationships is important. No projection can be both equal-area and conform. Examples:
- Mercator projection
- stereographic
- Lambert Conformal Conic projection
map projections¶that preserve angle
Map projections
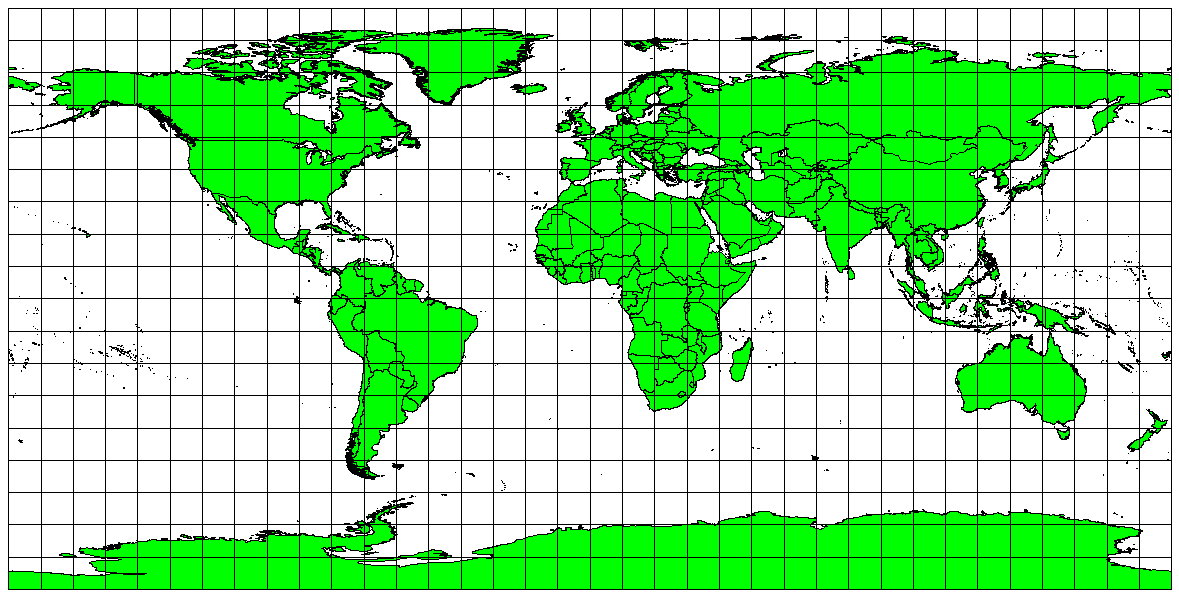
If your goal in projecting a map is to accurately measure distances, you should select a projection that is designed to preserve distances well. Such projections, called equidistant projections, require that the scale of the map is kept constant. A map is equidistant when it correctly represents distances from the centre of the projection to any other place on the map. Examples:
- Plate caree
map projections with equal distance
Map projections
When a map portrays areas over the entire map, so that all mapped areas have the same proportional relationship to the areas on the Earth that they represent, the map is an equal area map. Examples:
- Alber’s equal area,
- Lambert’s equal area
- Mollweide Equal Area Cylindrical
map projections with equal areas

Map projections
Projecting the sphere, or ellipsoid onto a surface is just one aspect of producing a useful map. We also need a coordinate system.
With the help of coordinate reference systems (CRS) every place on the earth can be specified by a set of three numbers, called coordinates.
In general CRS can be divided into projected coordinate reference systems (also called Cartesian or rectangular coordinate reference systems) and geographic coordinate reference systems.
Coordinate Reference System (CRS) in detail
Map projections
What Is A Geographic Coordinate System?
You can think of a Geographic Coordinate Systems as data that is defined by a 3-D surface and measured in latitude and longitude. An example of a Geographic Coordinate System would be "WGS 1984".
You may also wonder what a "Datum" is. A datum typically defines the surface (radius for a sphere, major axis and minor axis or inverse flattening for an ellipsoid) and the position of the surface relative to the centre of the earth.
Just remember that the term "Datum" and "Geographic Coordinate System" can usually be used interchangeably.
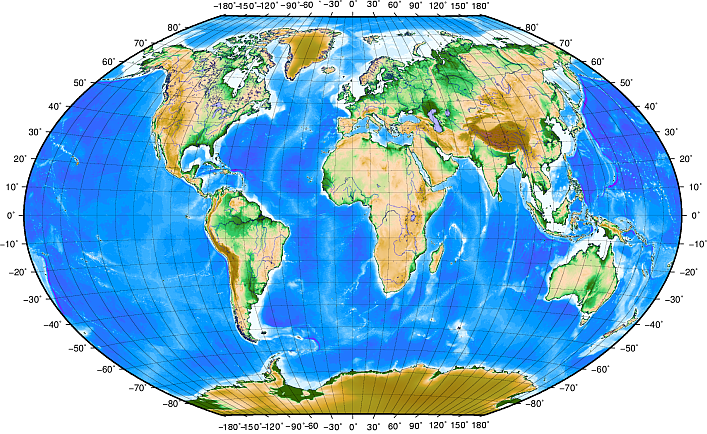
A geographic coordinate system
Map projections
The most convenient way to identify points on the curved surface of the Earth is with a system of reference lines called parallels of latitude and meridians of longitude. On some maps, the meridians and parallels appear as straight lines. On most modern maps, however, the meridians and parallels appear as curved lines.
To avoid the inconvenience of pinpointing locations on curved reference lines, cartographers superimpose on the map a rectangular grid consisting of two sets of straight. This grid is designed so that any point on the map can be designated by its latitude and longitude or by its grid coordinates, and a reference in one system can be converted into a reference in another system.
A geographic coordinate system

Map projections
So a projected coordinate systems refers to data that is defined by a flat 2-D surface and can be measured in units of meters (or feet). One example would be USA Albers Equal Area Conic which has a measuring unit of Meters. "Map projections" and "Projected Coordinate Systems" can be used interchangably as well.
A projected coordinate system

Map projections
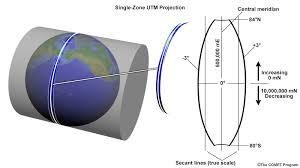
The Universal Transverse Mercator (UTM) coordinate reference system has its origin on the equator at a specific Longitude. Now the Y-values increase southwards and the X-values increase to the West. The UTM CRS is a global map projection.
The position of a coordinate in UTM south of the equator must be indicated with the zone number (35) and with its northing (y) value and easting (x) value in meters.
UTM

Map projections
The UTM projection divides the world into 60 zones that begin at longitude 180º, the International Date Line
UTM zones
Map projections
Many GIS include a functionality called on-the-fly projection. It means, that you can define a certain projection when you start the GIS and all layers that you then load, no matter what coordinate reference system they have, will be automatically displayed in the projection you defined. In order to use OTF projection, either your data must contain information about its coordinate reference system or you will need to define a global, layer or project-wide CRS.
On-The-Fly Projection
Map projections
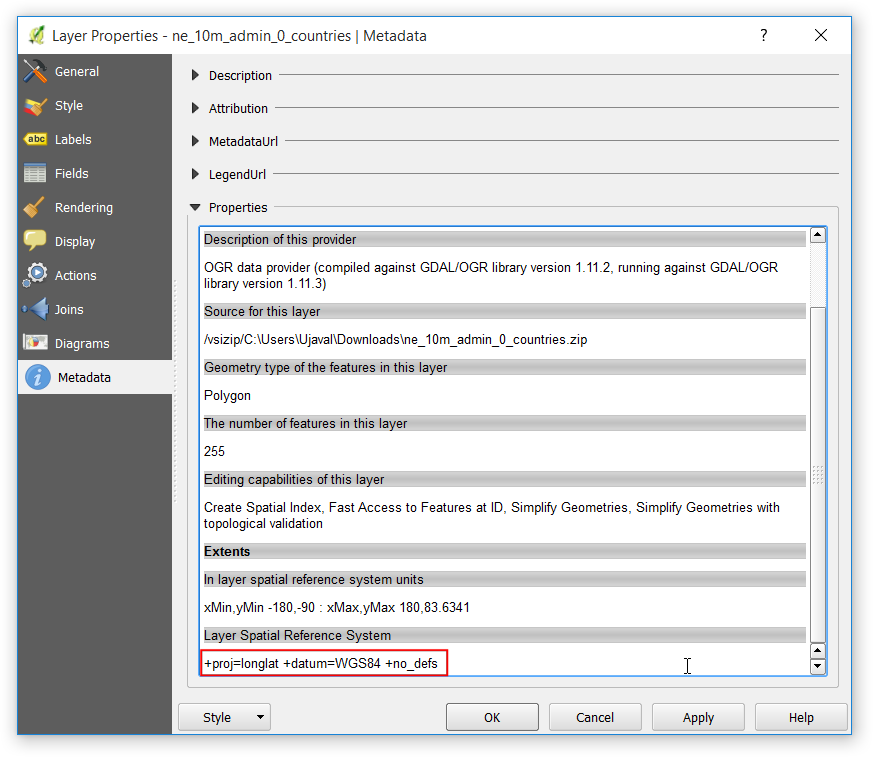
The CRS for a layer in QGIS can be checked by looking at the Metadata tab in the Layer Properties dialog. Expand the Properties section. At the bottom, you will see the definition for the projection under Layer Spatial Reference System. This definition is in the PROJ.4 format.
Projections in QGIS
Map projections
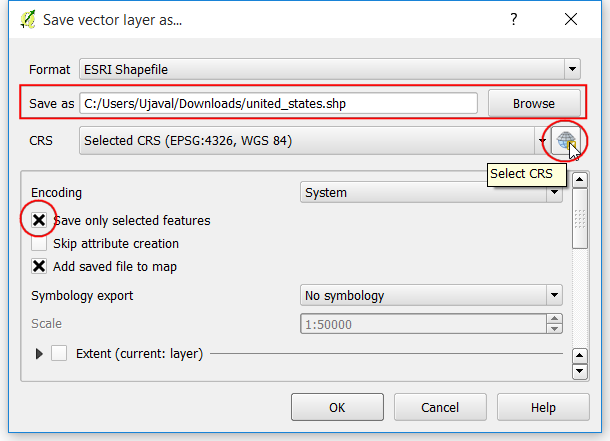
This operation is called Re-Projection. Rather than re-projecting the entire layer, we can also re-project some features from the layer. Use the Select features by area or single click tool and click on United States feature to select it.
Change projections in QGIS
Map projections
QGIS has support for approximately 2,700 known CRSs. Definitions for each CRS are stored in a SQLite database that is installed with QGIS.
Overview of Projection Support
GIS data models
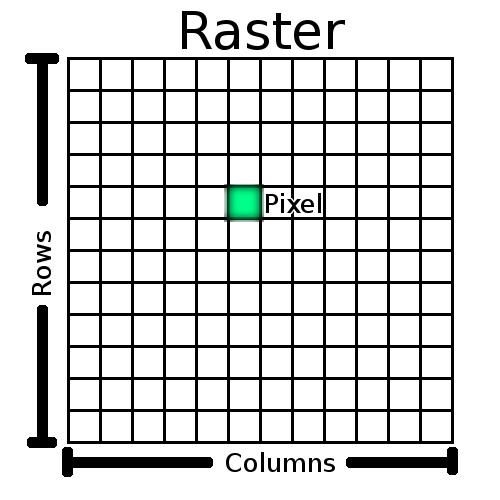
Rasters are made up of a matrix of pixels (also called cells), each containing a value that represents the conditions for the area covered by that cell.
Raster data is used in a GIS application when we want to display information that is continuous across an area and cannot easily be divided into vector features.
Raster data
GIS data models
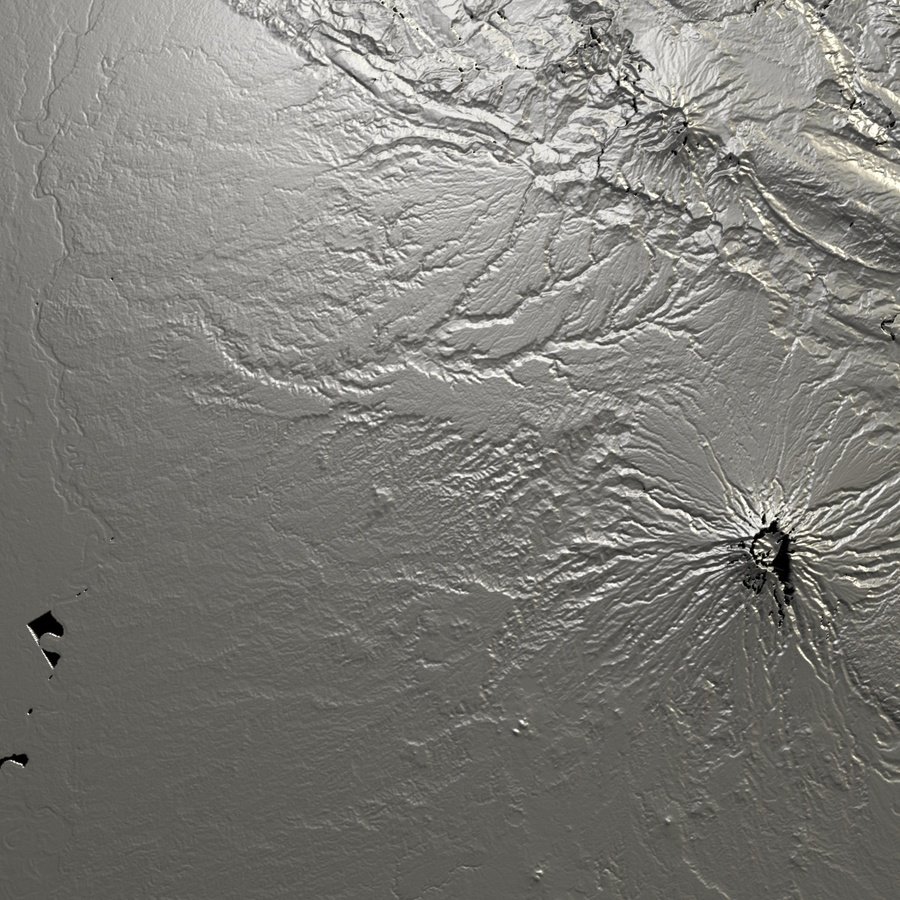
A lot of scientific observations and research produces raster datasets.
Many people use raster data as a backdrop to be used behind vector layers in order to provide more meaning to the vector information. The human eye is very good at interpreting images and so using an image behind vector layers, results in maps with a lot more meaning.
Raster data
GIS data models
Several factors determine the spatial resolution of an image. For remote sensing data, spatial resolution is usually determined by the capabilities of the sensor used to take an image. For example SPOT5 satellites can take images where each pixel is 10 m x 10 m.
In raster data that is computed by spatial analysis (i.e through interpolation techniques), the spatial density of information used to create the raster will usually determine the spatial resolution.
Spatial resolution
GIS data models
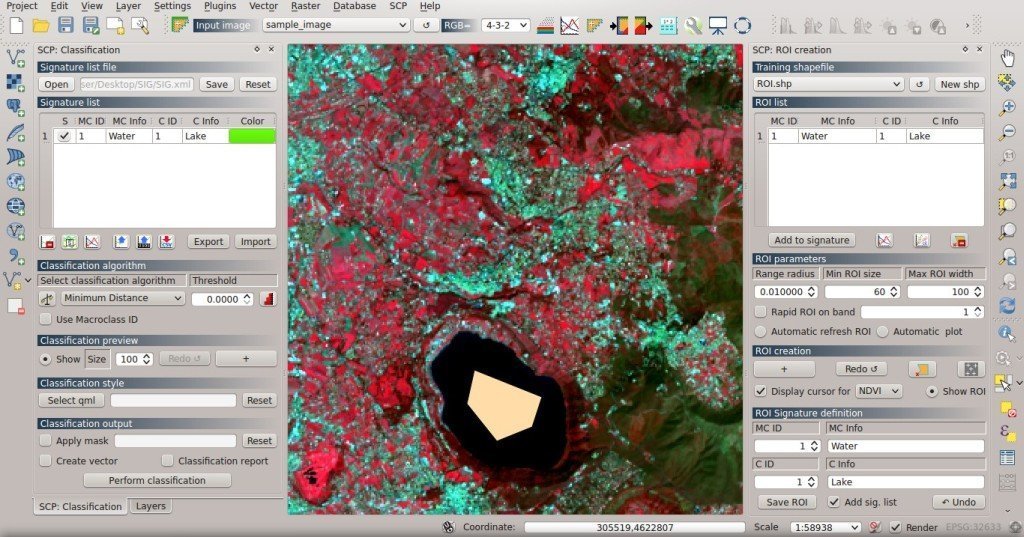
When a colour picture is displayed on a screen or printed out, the red, green and blue (RGB) information is combined to show you an image that your eyes can interpret. While the information is still in digital format though, this RGB information is stored in separate colour bands.
Raster images that include data for non-visible parts of the light spectrum are often referred to as multi-spectral images. In GIS recording the non-visible parts of the spectrum can be very useful. For example, measuring infra-red light can be useful in identifying water bodies.
Spectral resolution
GIS data models
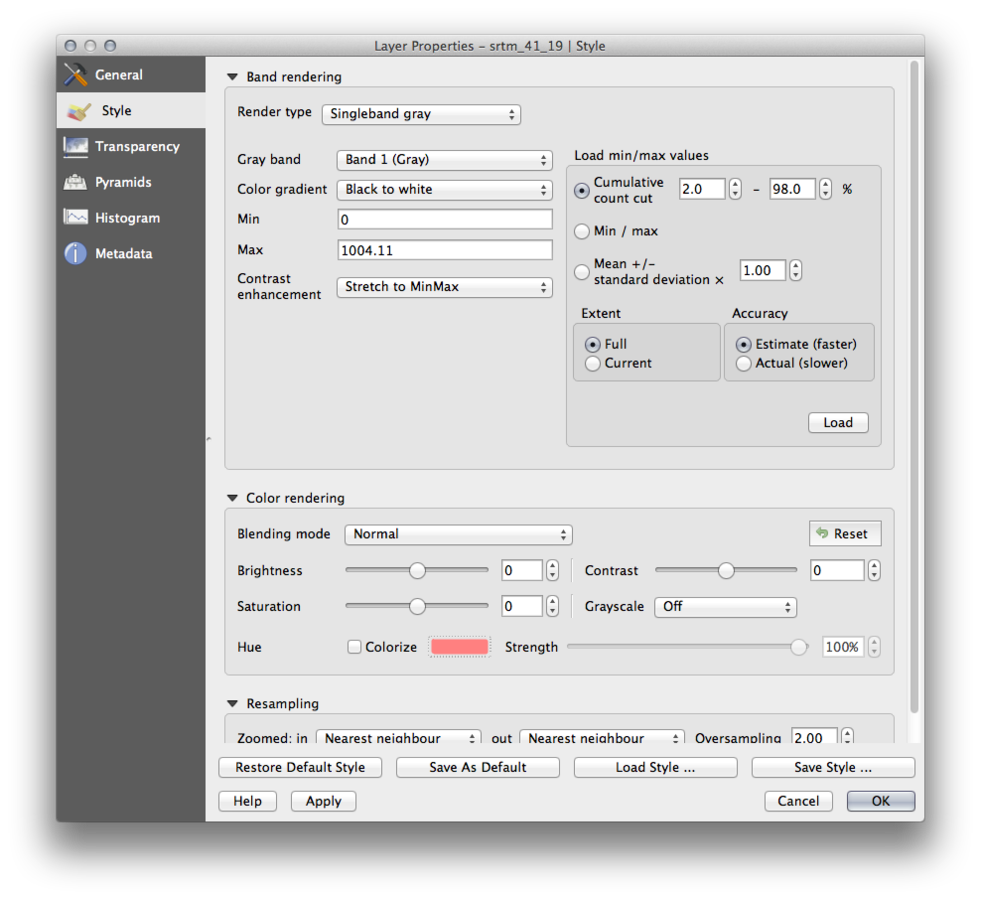
To view and set the properties for a raster layer, double click on the layer name in the map legend, or right click on the layer name and choose Properties from the context menu. This will open the Raster Layer Properties
Raster properities
GIS data models
When we load a raster, QGIS applies a default colour scheme. In the image opposite we see the render type is Single band grey . This is just one way to look at a DEM, some others are:
- Multiband color - if the file comes as a multiband with several bands (e.g., used with a satellite image with several bands)
- Paletted - if a single band file comes with an indexed palette
- Singleband pseudocolor - This is a render option for single-band files, including a continous palette. You can also create individual colour maps for the single bands here.
Raster styling

GIS data models
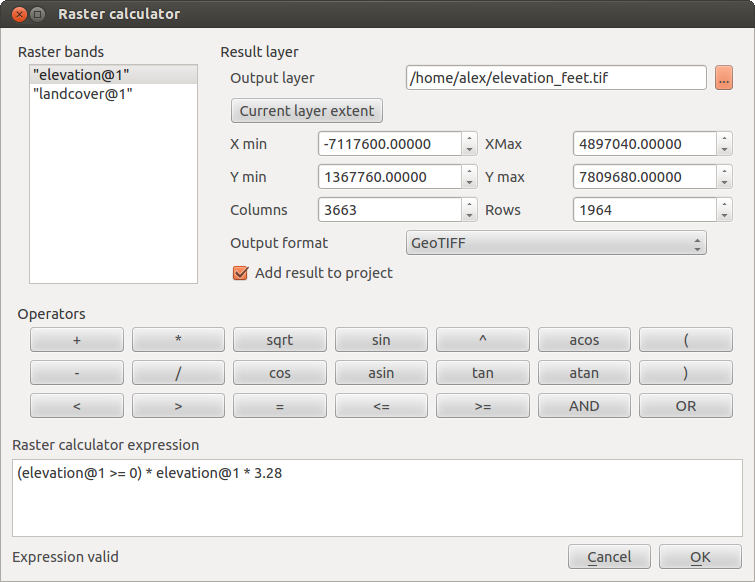
Raster mathematics is available through the Raster calculator. This alllows you to perform calculations on the basis of existing raster pixel values. The results are written to a new raster layer with a GDAL-supported format.
Raster calculator
GIS data models
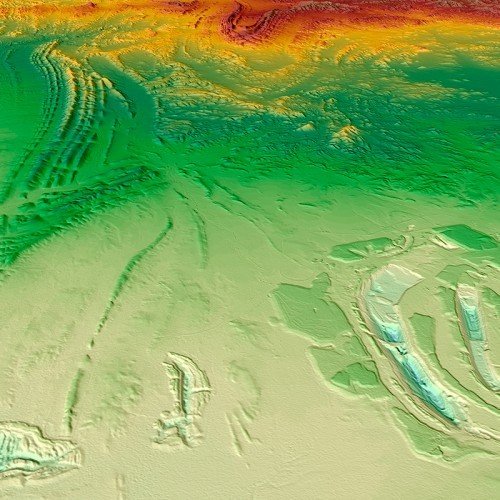
A very common technique for imaging rasters is t overlay multiple stylings to simulate shadow, and hence, 3-dimensionality.
Terrain analyis
GIS data models
There are a great many analytical tools that can be run on raster data which cannot be used with vector data. For example, rasters can be used to model water flow over the land surface. This information can be used to calculate where watersheds and stream networks exist, based on the terrain. Examples:
- agriculture (crop yields, health)
- disasters (flood, fire, landslide)
Raster analysis

GIS data models
.tif image files are plain TIF files, not GeoTIFF files. That means they do not have any projection information. To use these images in a GIS, you need to georeference them. A georeference contains 2 types of information - image extents and projection. Typically, the extents are stored in a file known as World file and they have extensions like .tfw or .jgw.
Raster data -projections
Plugins
Plugins in QGIS add useful features to the software. Plugins are written by QGIS developers and other independent users who want to extend the core functionality of the software.
Core plugins are already part of the standard QGIS installation. Example:
- Spatial Query Plugin

overview
Plugins
Plugins in QGIS add useful features to the software. Plugins are written by QGIS developers and other independent users who want to extend the core functionality of the software.
External plugins are available in the QGIS Plugins Repository and need to be installed by the users before using them. An easy way to browse and install these plugins is by using the Plugin Manager tool.
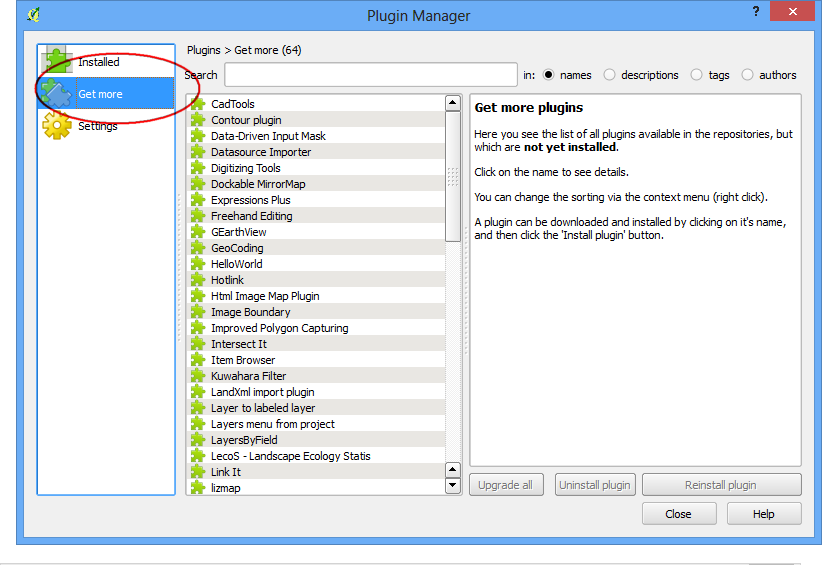

overview
Plugins
The Spatial Query Plugin:
This is a core plugin, though it seems like more than a plugin - really it is core GIS functionality.
Allows you to make a spatial query (i.e., select features) in a target layer with reference to another layer. The functionality is based on the GEOS library and depends on the selected source feature layer.
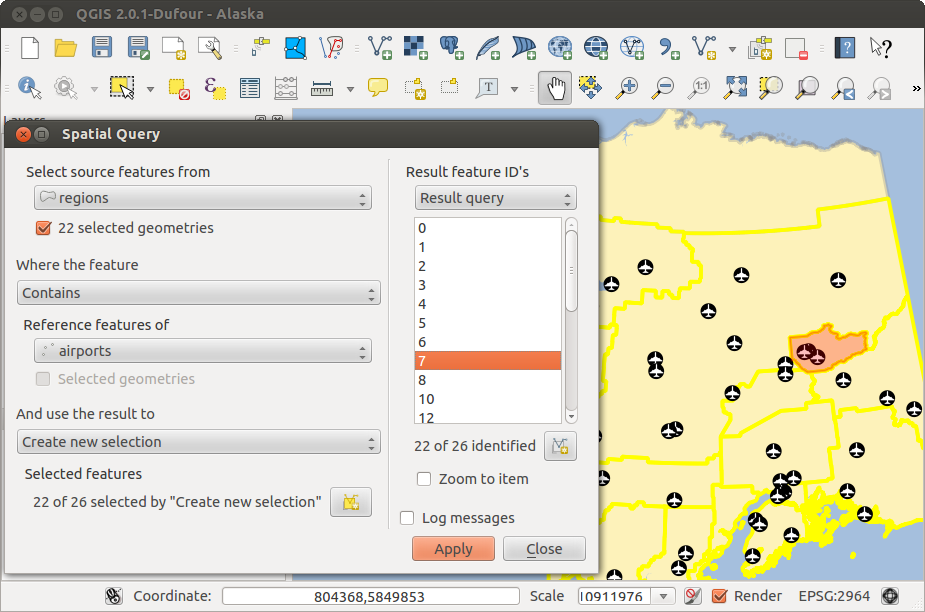
useful plugins
Plugins
The Spatial Query Plugin: Possible operators are:
- Contains
- Equals
- Overlap
- Crosses
- Intersects
- Is disjoint
- Touches
- Within

useful plugins
Plugins
The OpenLayers Plugin:
Basemaps from OpenStreetMap, Google Maps, Bing Maps, MapQuest layers and more
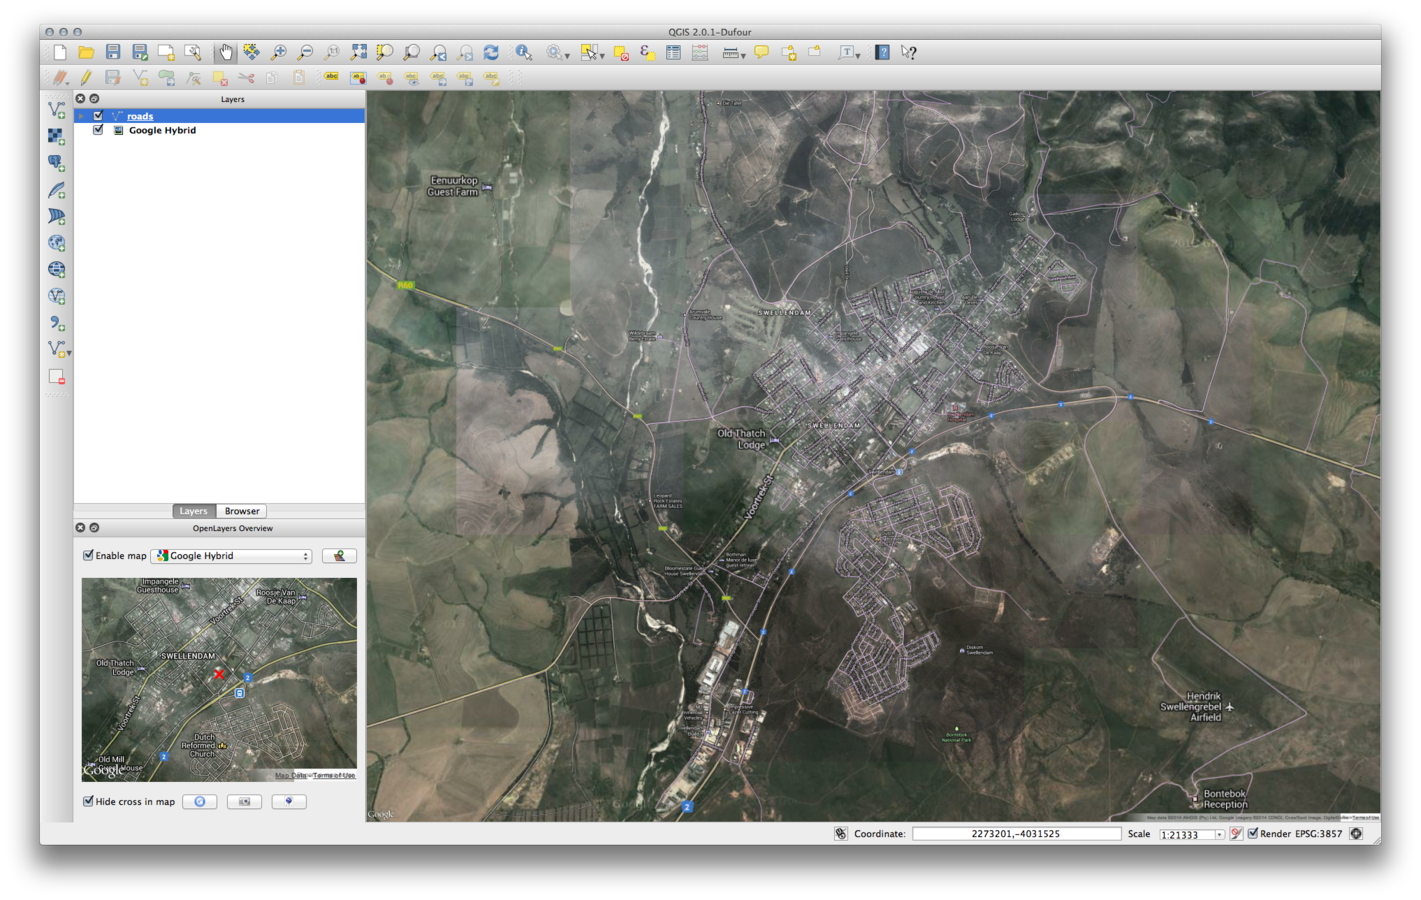
useful plugins
Plugins
The Raster Terrain Analysis Plugin
The Raster Terrain Analysis plugin ships standard with newer versions of QGIS:
- Slope: Calculates slope angle for each cell in degrees (based on first order derivative estimation).
- Aspect: Exposition (starting with 0 for north direction, in degrees counterclockwise).
- Hillshade: Create shaded map using light and shadow to provide a more three-dimensional appearance for a shaded relief map.
- Ruggedness Index: A quantitative measurement of terrain heterogeneity as described by Riley et al. (1999). It is calculated for every location, by summarizing the change in elevation within the 3x3 pixel grid.
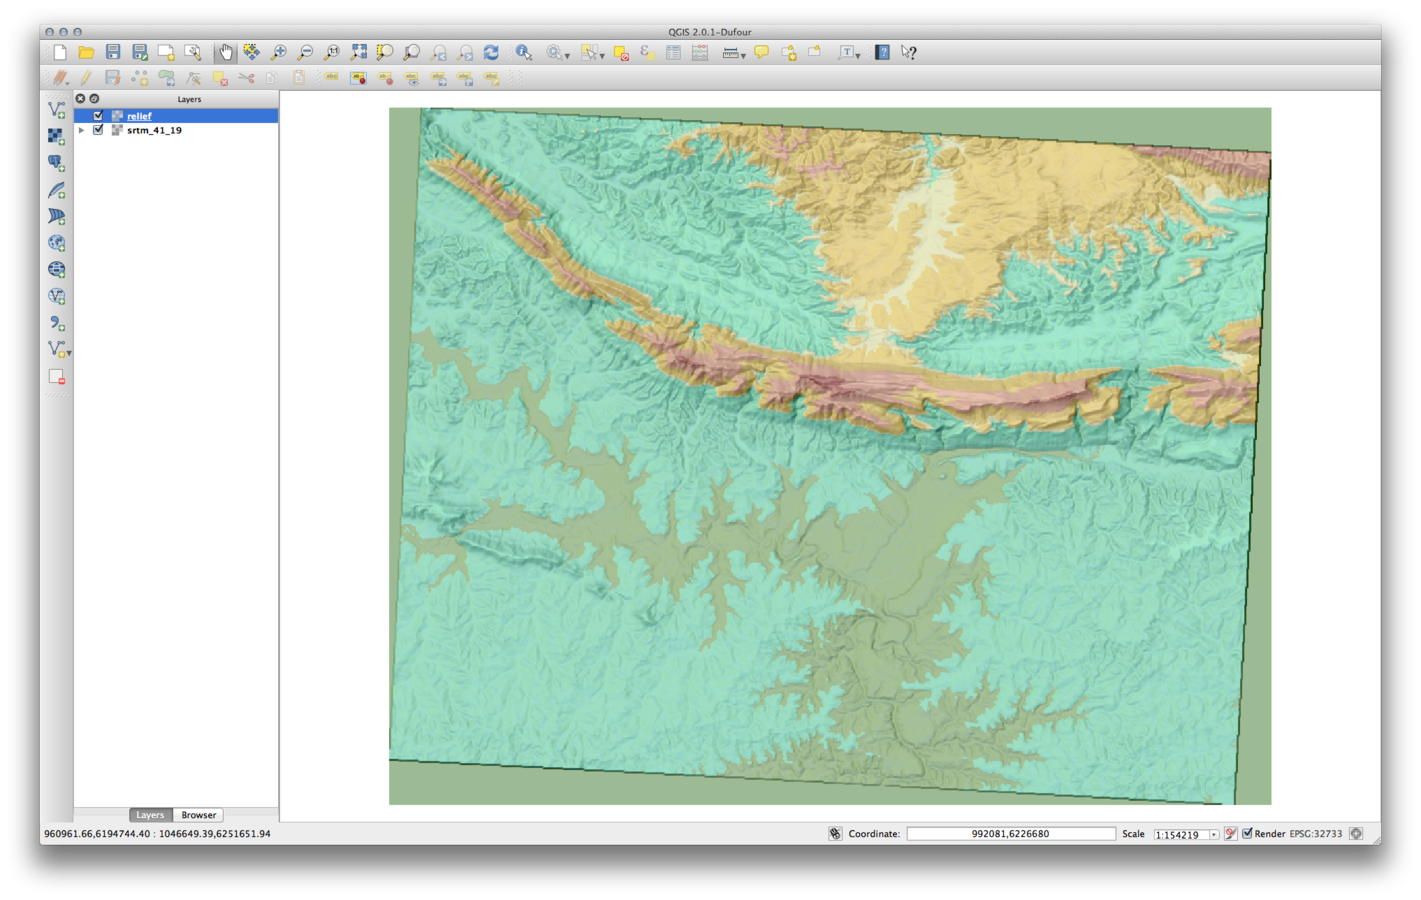
- Relief: Creating a shaded relief map from digital elevation data. Implemented is a method to choose the elevation colors analysing the frequency distribution.
useful plugins
web
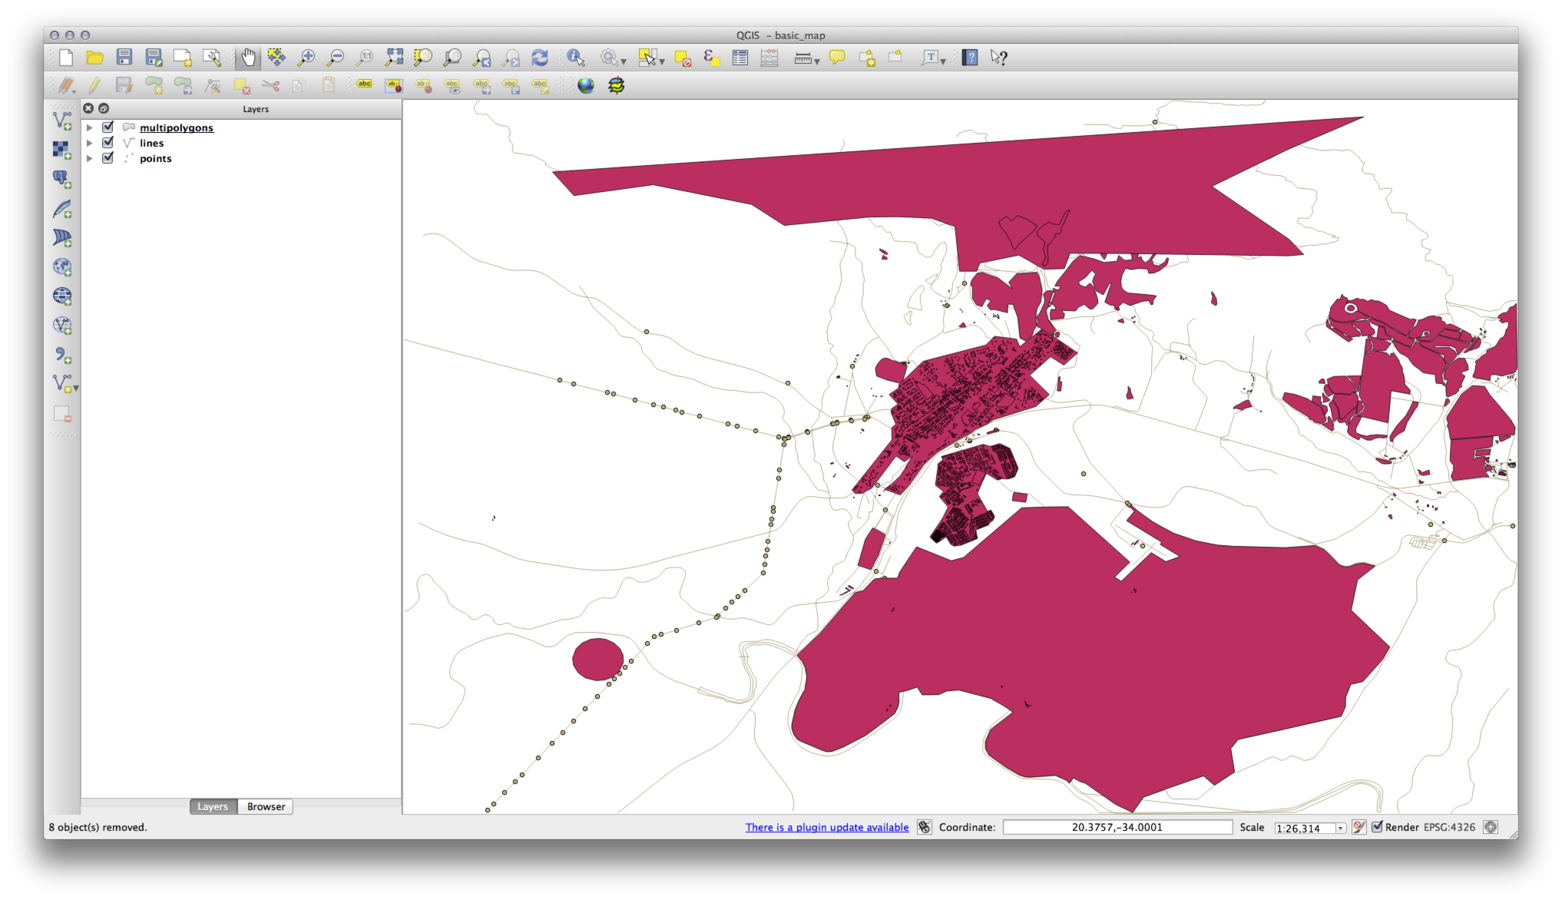
There a number of ways of interacting directly with web data. The most important being:
openstreetmaps (OSM) data
Open Geospatial Consortium (OGC) data.
qgis web integration
web
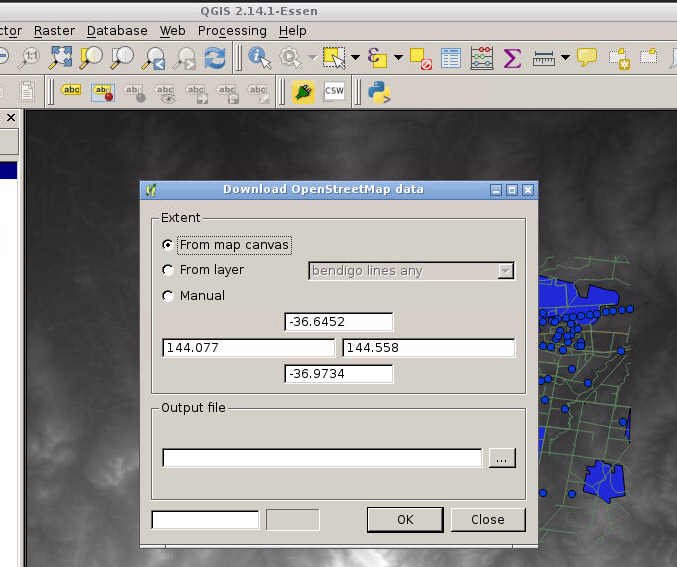
The openstreetmap project data is available through the main vector dropdown:
You will be provided with a couple of ways to choose an extent - as seen in the picture opposite. Choosing From Layer is probable the best option, otherwise it can be easy to start a very large download.
openstreetmaps
web
OGC services are increasingly being used to exchange geospatial data between different GIS implementations and data stores.

Open Geospatial Consortium
web
A WMS server acts upon requests by the client (e.g., QGIS) for a raster map with a given extent, set of layers, symbolization style, and transparency. The WMS server then consults its local data sources, rasterizes the map, and sends it back to the client in a raster format. For QGIS, this format would typically be JPEG or PNG.

Open Geospatial Consortium
web
In QGIS, a WFS layer behaves pretty much like any other vector layer. You can identify and select features, and view the attribute table. Since QGIS 1.6, editing WFS-T is also supported.
In general, adding a WFS layer is very similar to the procedure used with WMS. The difference is that there are no default servers defined, so we have to add our own.
Only WFS 1.0.0 is supported.
Open Geospatial Consortium
web
Let's try this together...
Natural Earth Raster
web
The openstreetmap project data is available through the main vector dropdown:
You will be provided with a couple of ways to choose an extent - as seen in the picture opposite. Choosing From Layer is probable the best option, otherwise it can be easy to start a very large download.

Natural earth data
GIS lecture 2
By Dan Sandiford
GIS lecture 2
- 1,020


