Predicting Customer Satisfaction: how to use deep learning and statistics together
What do you (and I) take away from this talk?
- Deep learning is not just CNN/RNN: RBMs and other less-used methods can be as effective!
- Core statistical methods are not used often nowadays - but they can help you with better data-driven insights about the problem
- How to approach a complex problem of a DIFFERENT domain? (as customer satisfaction is not face recognition!)
- Explore the wide range of 'other' models out there (statistical or otherwise) .. not be confined to the same ole!
What is this about?
- Customer satisfaction problem - how to approach
- Deep learning used - RBMs
- Statistical techniques as well - GLMs, KDE, and more
- Comparative study with diff models, diff kernels and diff error metrics.
If you feel the other slides are TL;DR!
Should we make a distinction b/w statistical and DL/ML methods?
(I mean, aren't they interdependent and used together?)
- Yes and no.
- These days there is a lot of focus on DL techniques (not without reason, of course!)
- But it is less common to try and involve both DL and 'traditional statistics' to get better data-driven insights
That is what this talk will show you!
Statistical Methods used
- Kernel density estimation, MCMC
- Statistical generative methods
- Correlation, cross correlation, moving average, (partial) auto-correlation, ARIMA
- MMD, K-L divergence
- GLM (or GLIM)
- AIC, BIC
DL/ML Methods used
- Restricted Boltzmann machines
- Logistic regression/SVM classifier atop RBM to predict labels
- Autoencoders for dimensionality reduction
- KNN, CNN etc for comparative purposes with primary model
Step 1
Feature selection, Dimensionality reduction
- Histograms- visualise distribution of columns
- Encode features to categorical
- Check correlation from correlation matrix
- use PCA, autoencoders and the like for dimensionality reduction
Code Snippets

Code Snippets
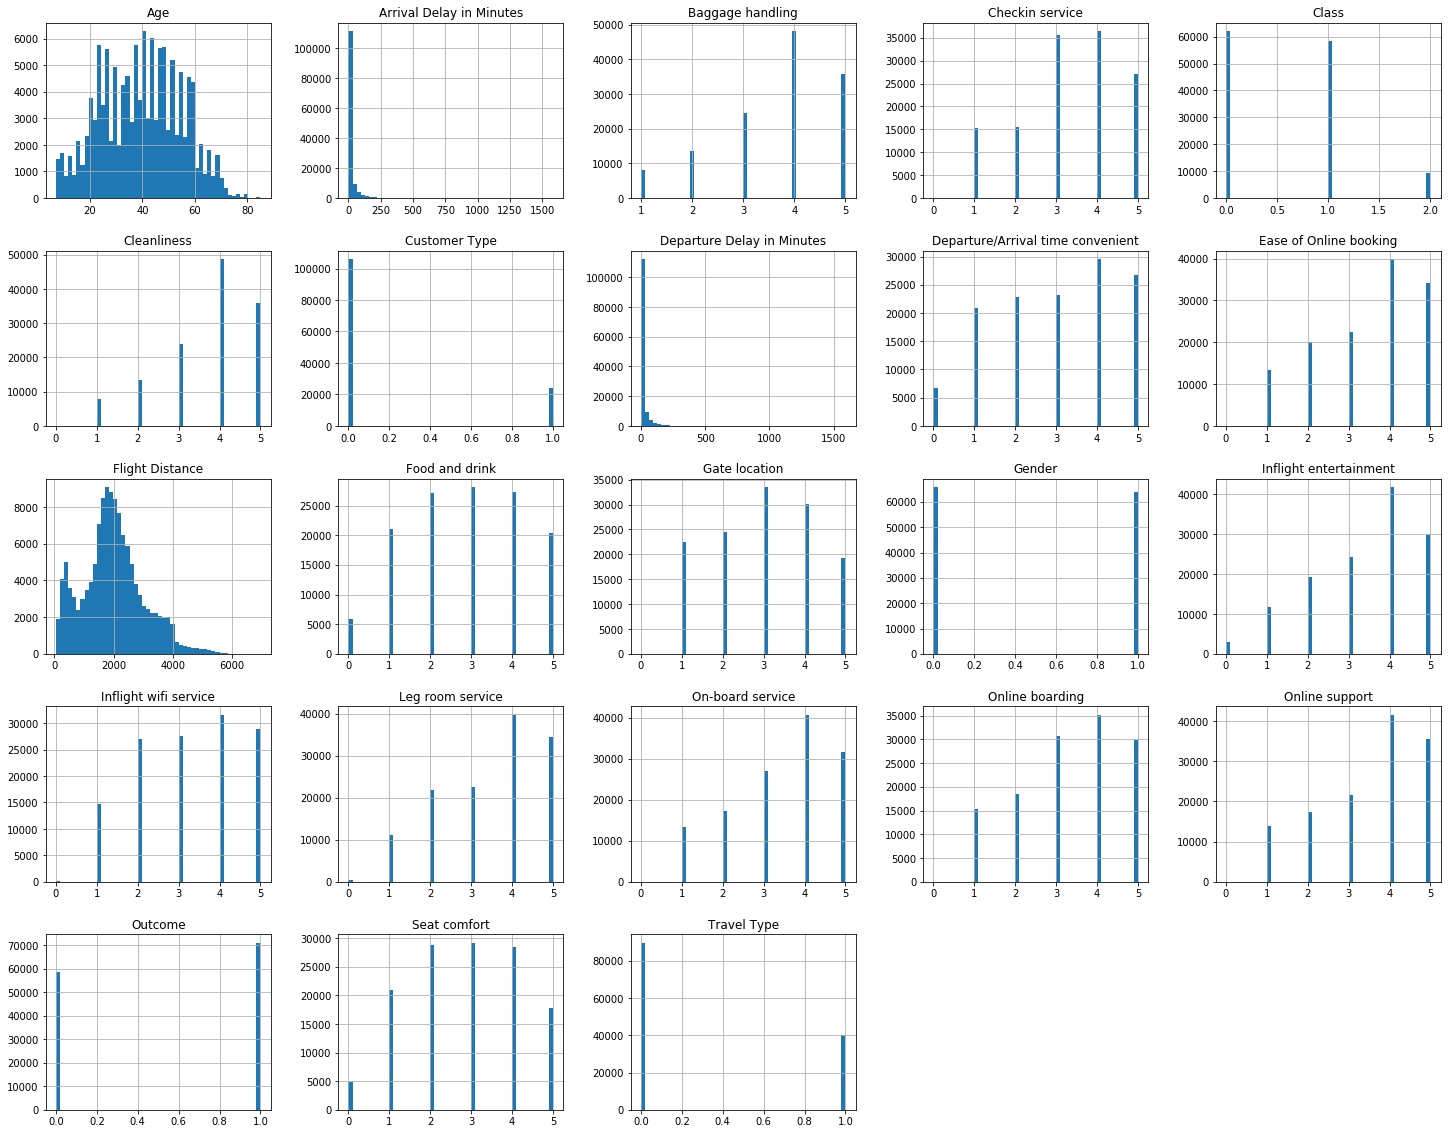
Histograms of 23 features, one per column. The histogram is a representation of the distribution of data. This will help in basic understanding of how the data points vary in different columns. In most columns, the data points are uniform (encoded categorically) except some like age and flight distance.
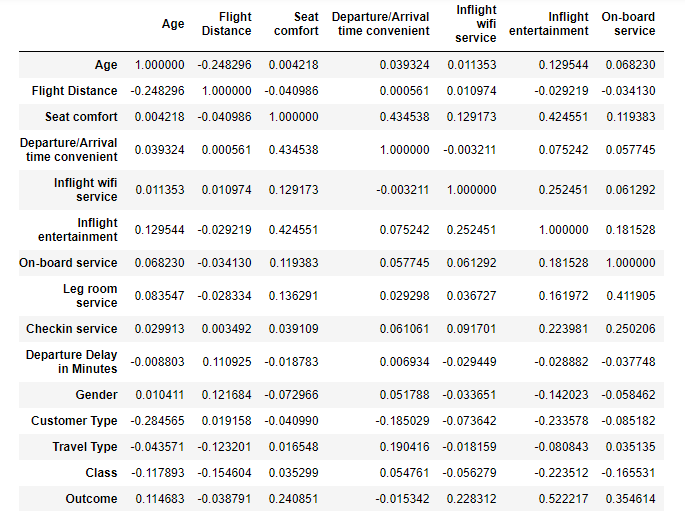
This is part of the correlation matrix. Note the different variables and the correlation values among each pair.
Hacks and Insights..
- calculate auto correlation, partial auto correlation, etc. (treated data as time-series)
- Inspect correlation on overlapping mini batches for greater accuracy
- Best technique for dimensionality reduction was estimating batchwise correlation and cross correlation values- not PCA (lossy) or AE!
- Include more
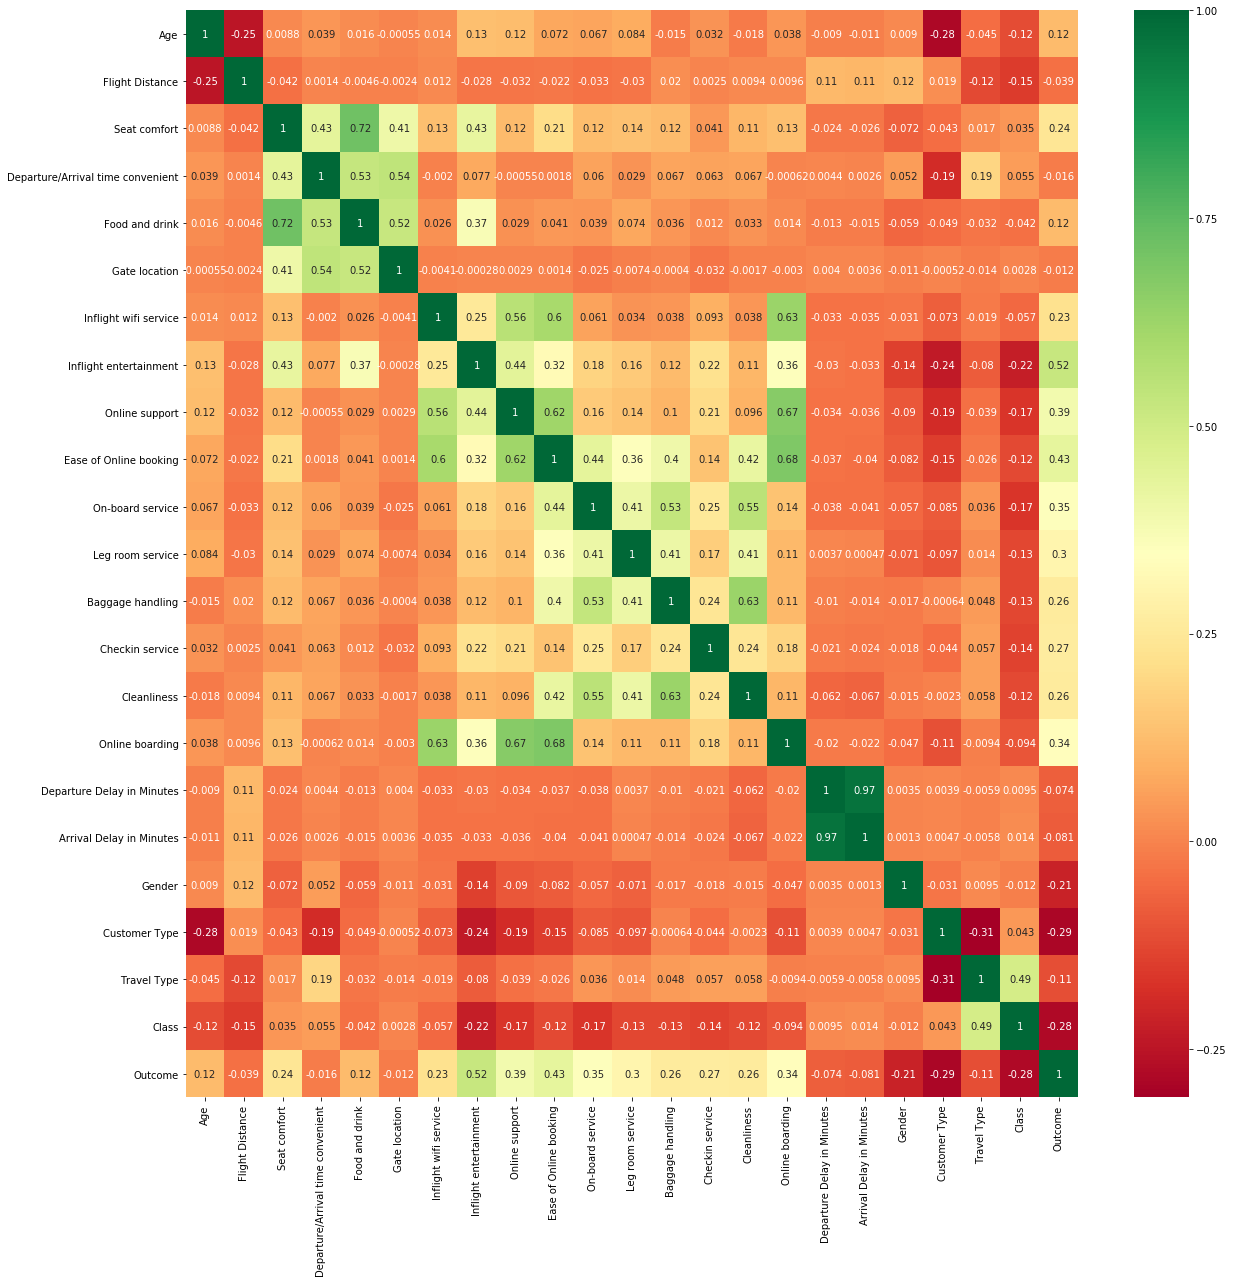
Correlation heatmap: The difference in colors show the difference in the correlation among pairs of variables.
Step 2 : The RBM
- Choosing the hidden and visible units- from conditional probablitiy and cross correlation
- Batch wise correlation and cross correlation
- Heuristic (above) and meta-heuristic ( SVM classifier checks correlation ) ... see next slide!
- and then compare both
Code Snippets

Heuristic methods..
- Means you don't have to reach a perfect solution : a satisfactory one is enough
- Tested and commonly used methods
- Problem dependent: fail to obtain global optimum
and metaheuristic ones.
- Means you hope to achieve global optimum
- Problem independent: black boxes, not greedy
- General purpose
- Metaheuristic performs better (quite logical) in our comparative study
Also, exact algorithms, hyper-heuristics?
Why RBM and not a neural network (CNN/RNN etc.)?
-
'restriction' in RBMs makes it easier to handle than normal Boltzmann machines, and thus less complex
-
As opposed to neural networks, RBM is only a 'two-layer' model if we may call it so (i.e., hidden and visible units comprising 2 layers independently)
-
Deep neural network (DNN) may be comprised of multiple hidden layers.
-
Also RBM, contrary to DNN, is an unsupervised model
-
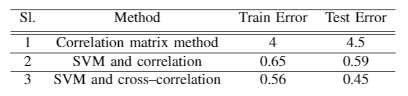
Comparative study made with GLM, KNN, SVM and CNN - see table!
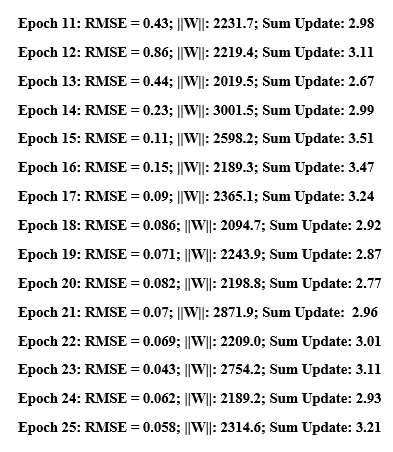
RBMs in use for this problem. Note the error rates, sum updates and weights of the model in training.
Results
- Note the comparison of the above methods - heuristic and meta-heuristic. The latter is better, obviously.
- Label accuracy 92% ..Satisfied, Dissatisfied, Neutral (Multi-class classification)
- Also other comparison tables.
Ongoing efforts..
- Currently focusing on the metaheuristic method - aim to finetune it
- Decrease error rate
- Introduce statistical generative methods
- More stats!
Challenges .. and Lessons learnt.
- high size of data and complex variable interrelationships
- Dimensionality: a LOT of features in the dataset
- new domain - completely not au fait with
- limited access to GPUs : perennial problem!
- Not a stats nerd nor a fan
If you want to contribute:
- Ping me on LinkedIn!
- Send me a mail!
Customer satisfaction
By deya_not_diya

