


Dhrumil Mehta
Database Journalist, Politics @ FiveThirtyEight
(1) Join this Slack:
https://ledeprogram.slack.com/
join and star the following channels:
#data-ms-2023, #reporting-ii-2023
(2) Fill out the Polly survey
In the #reporting-ii-2023 Slack channel
If you have any questions, just raise your hand 🖐!
Welcome! Let's get rolling!
Hello, my name is...
Associate Prof. of Journalism @ Columbia U.
Deputy Director of Tow Center
Visiting Associate Prof of Public Policy @ Harvard Kennedy School
dhrumil.mehta@columbia.edu
@datadhrumil
@dmil
You will meet Prof. Denise Ajiri next week!
- Meet Dhrumil
- Meet each other! (Introductions & Survey Responses)
- Syllabus Overview
- Data Journalism: Possibilities And Limitations
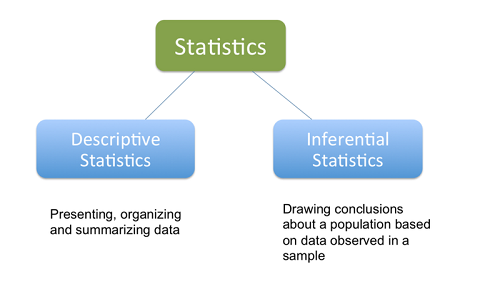
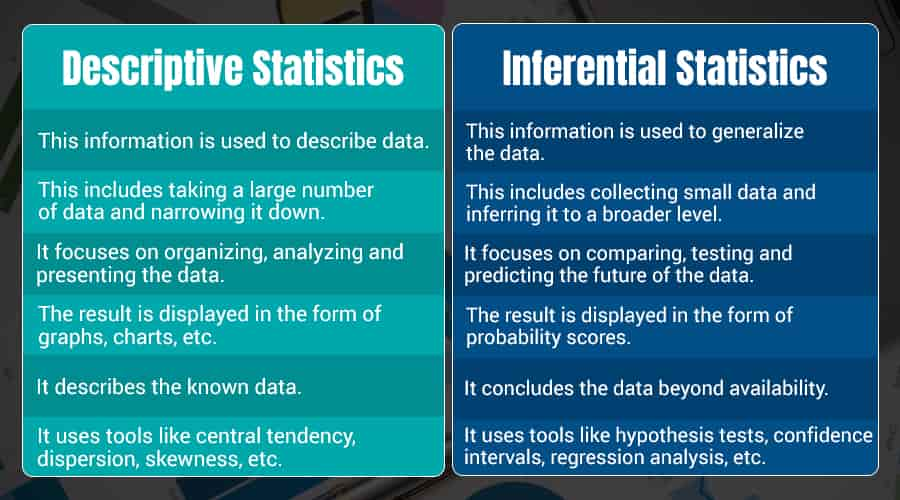
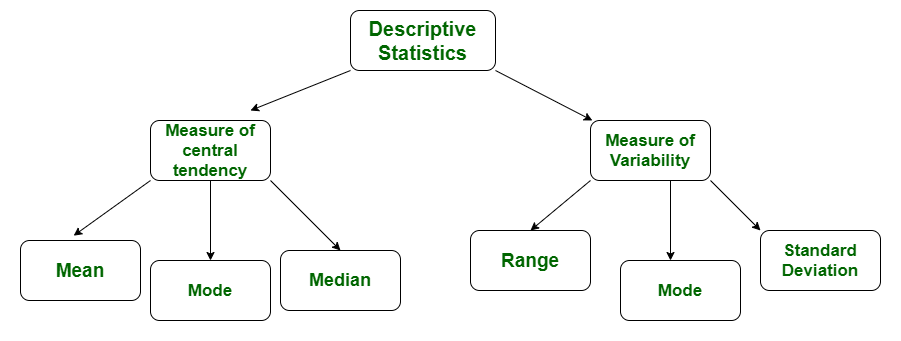
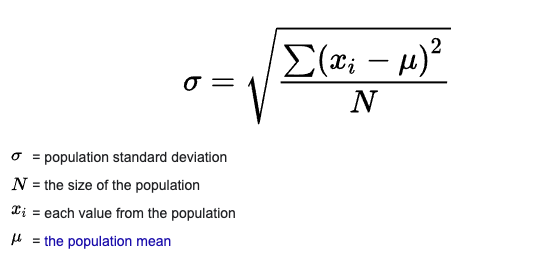
- Intro to Descriptive Statistics
- Homework Overview
Currently
Associate Prof. @ Columbia Graduate School of Journalism
Visiting Associate Prof. @ Harvard Kennedy School
Previously
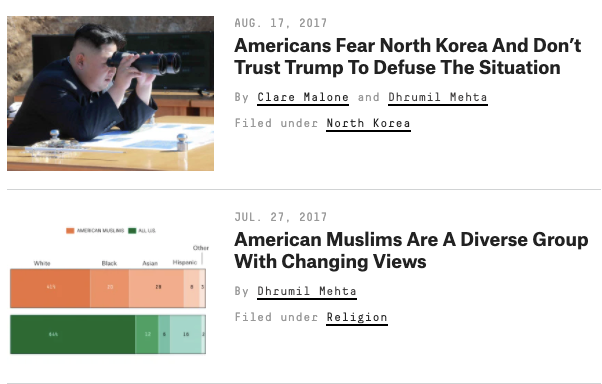
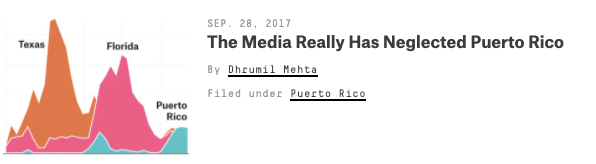
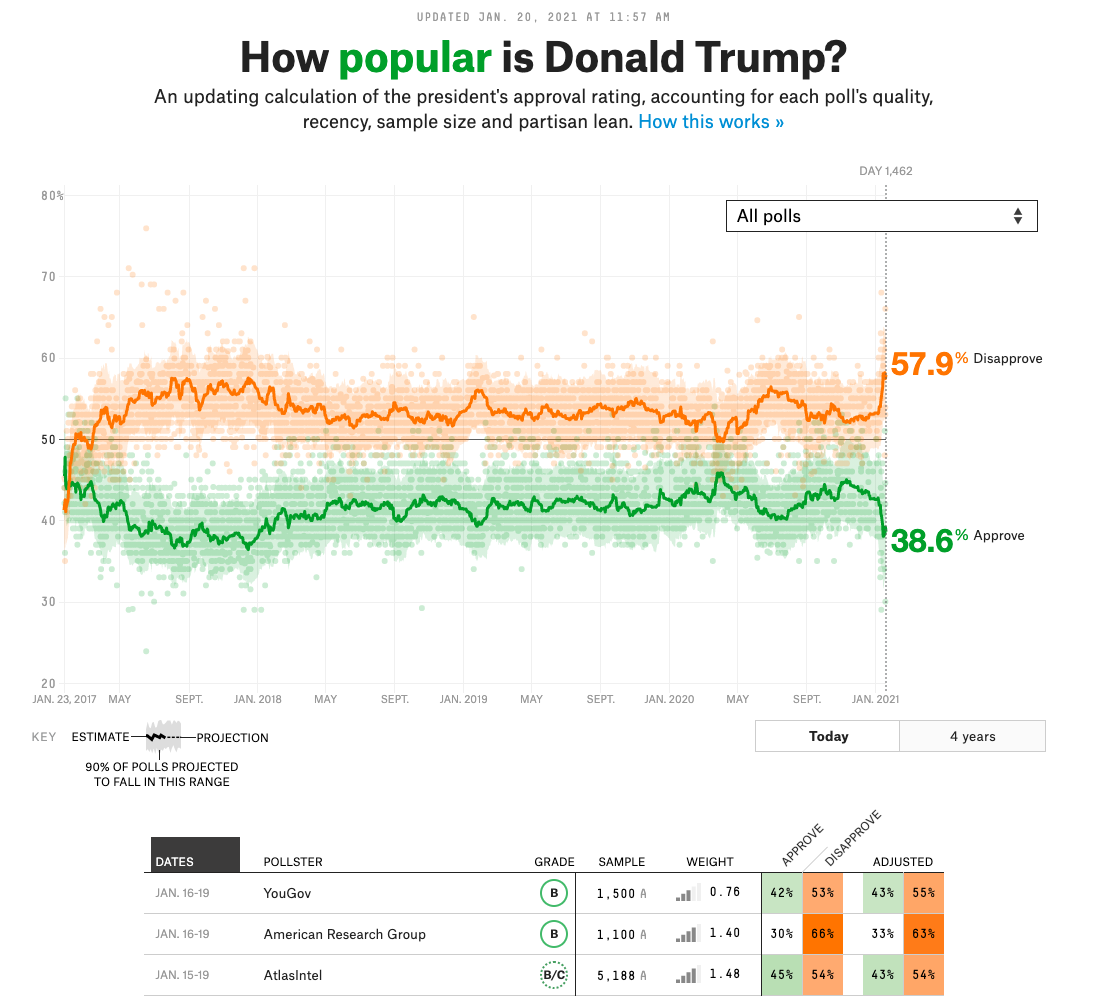
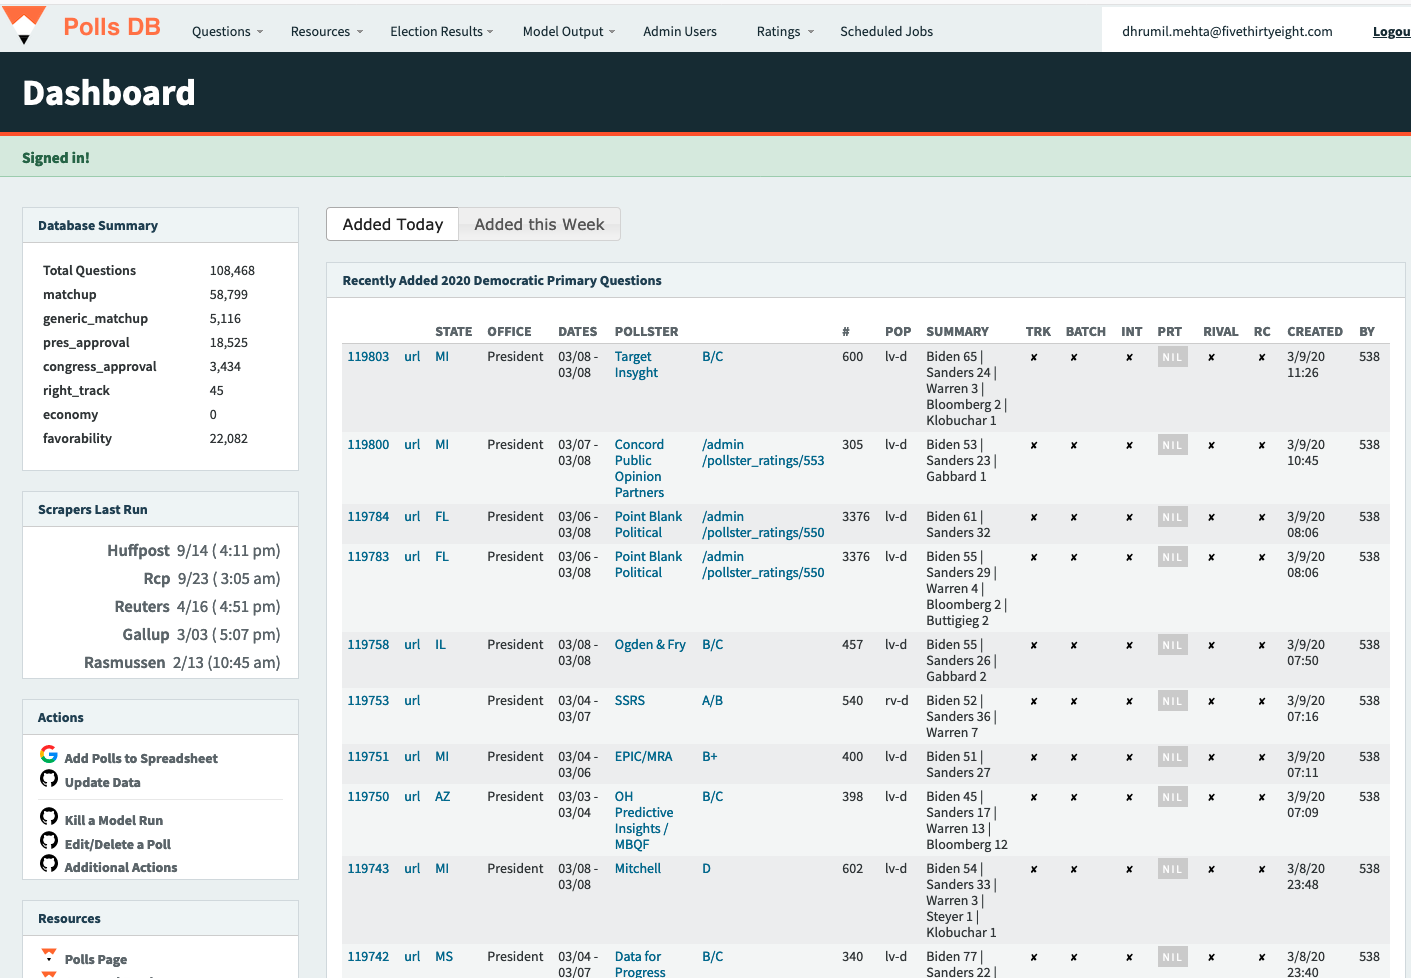
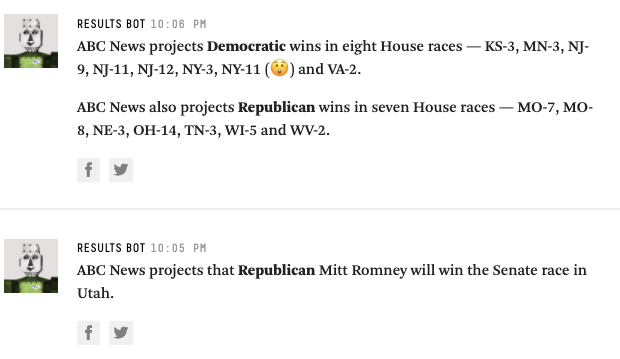
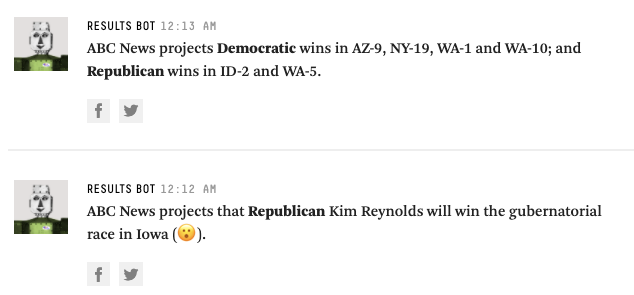
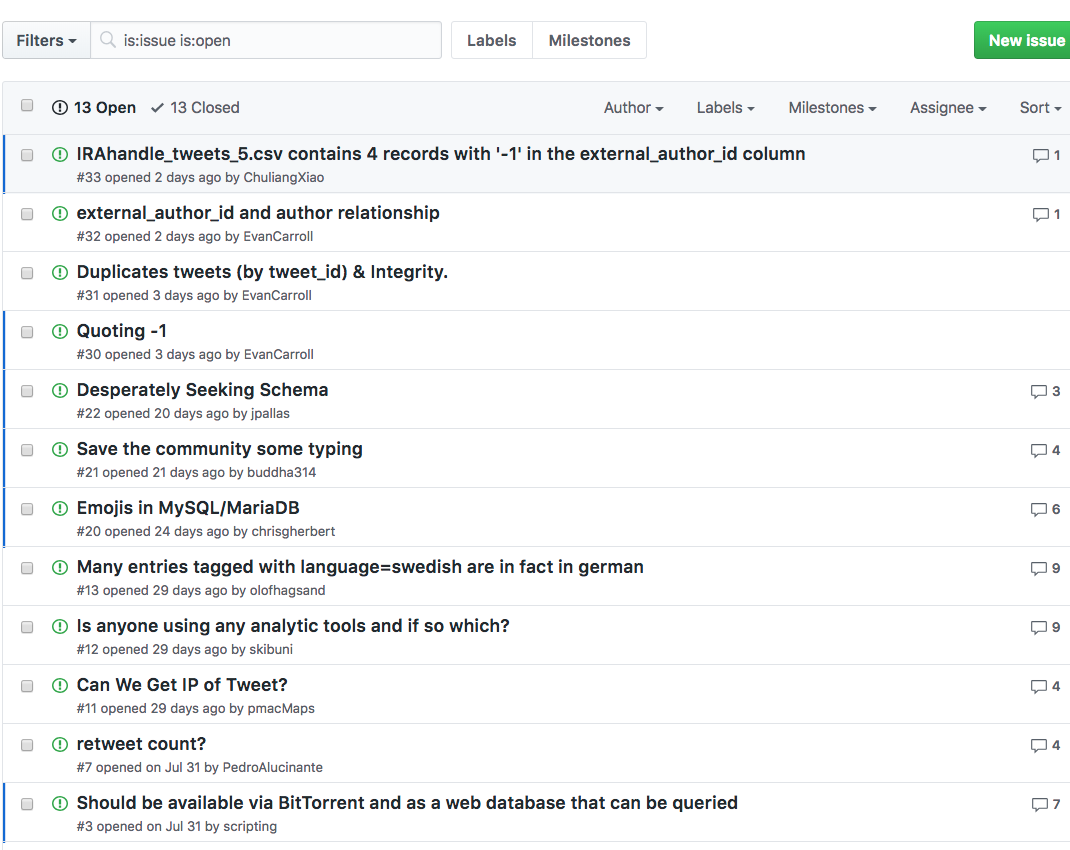
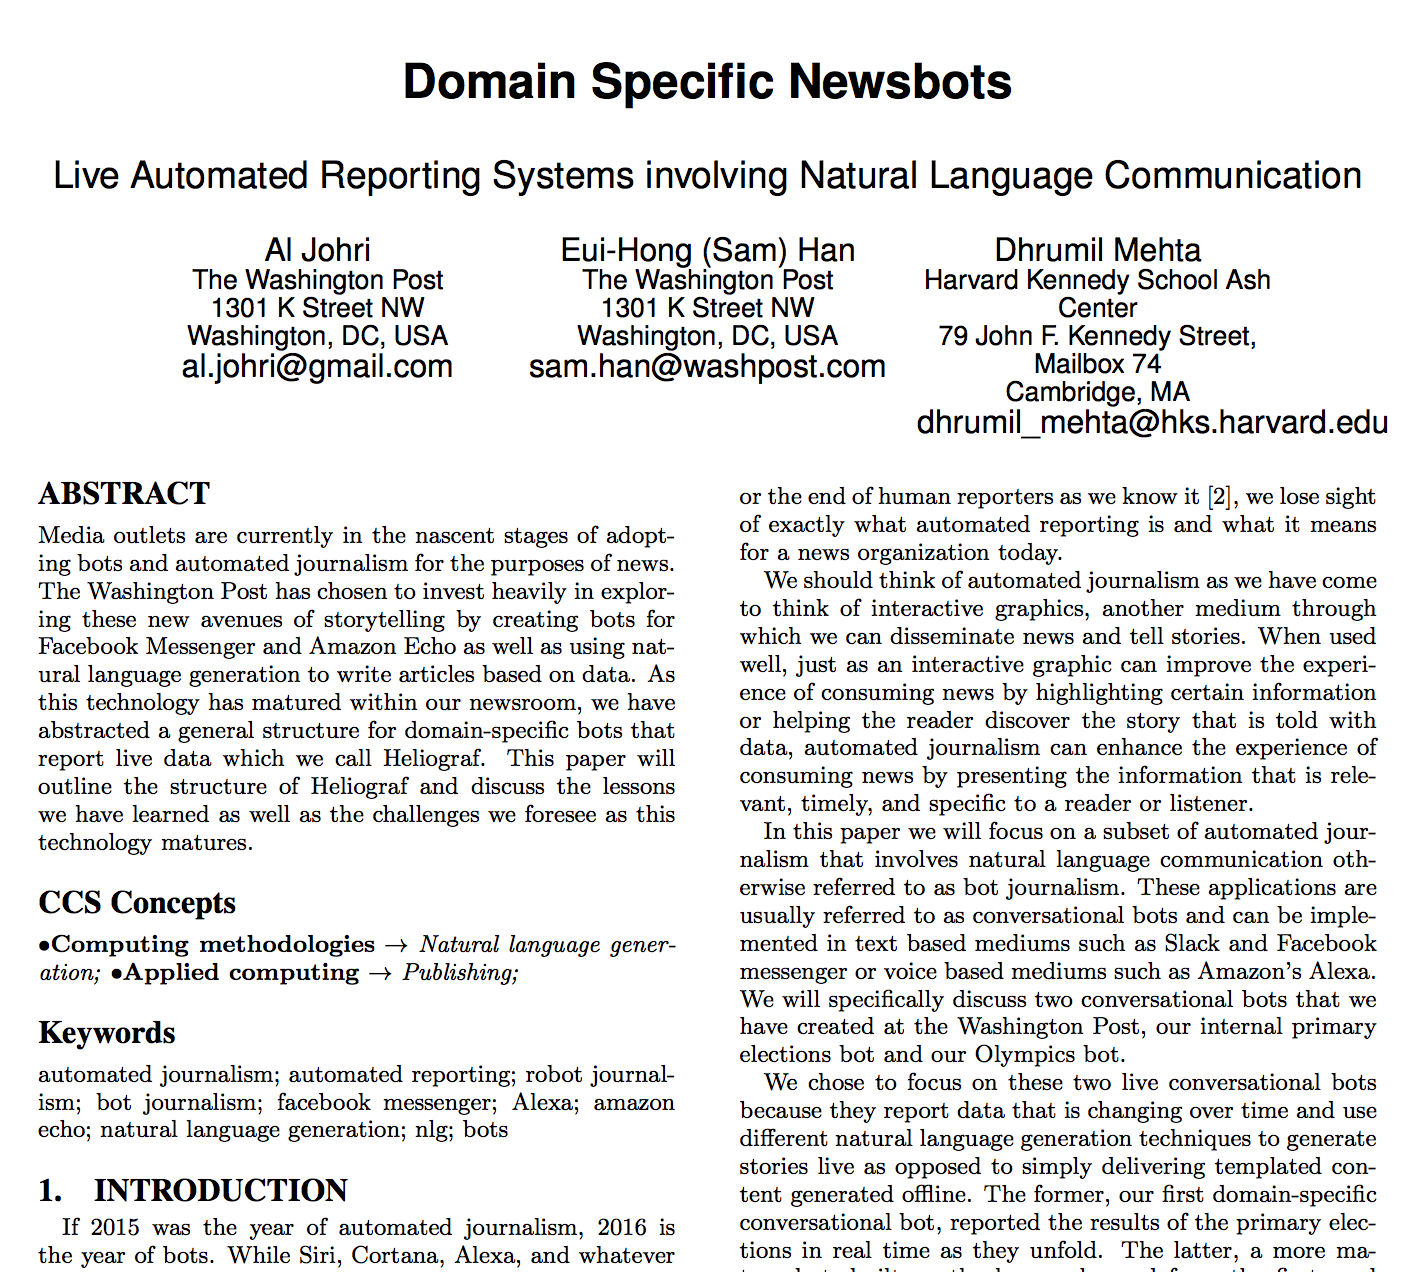
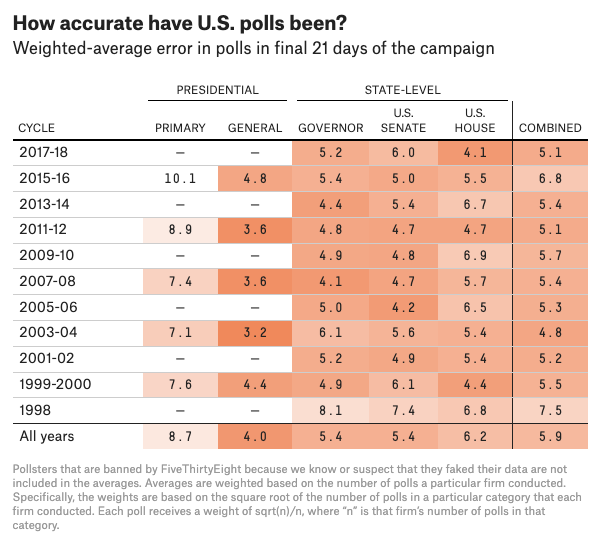
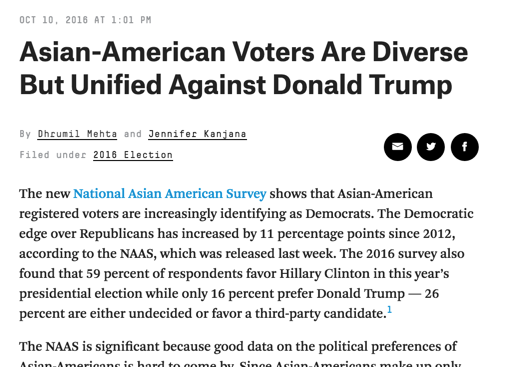
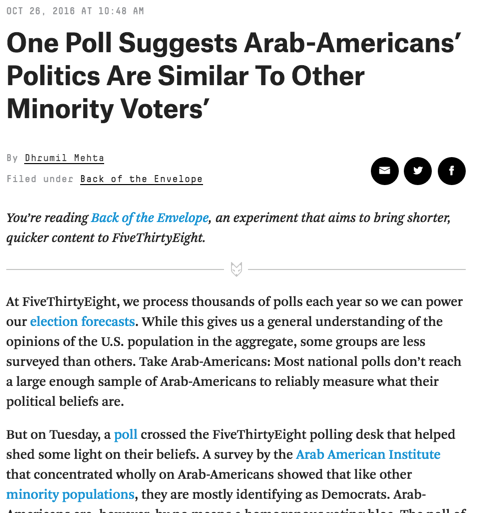
Database Journalist, Politics @ FiveThirtyEight
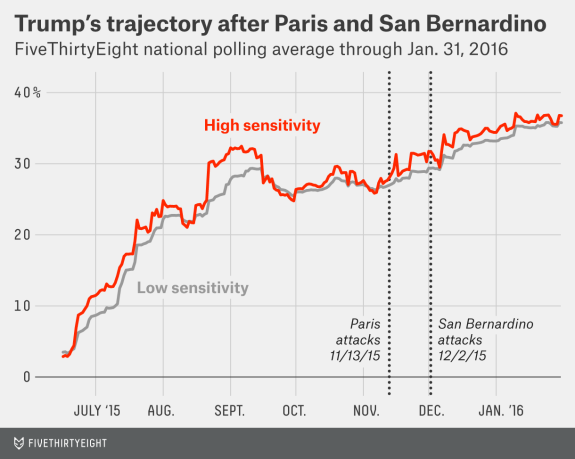
Database Journalist, Politics
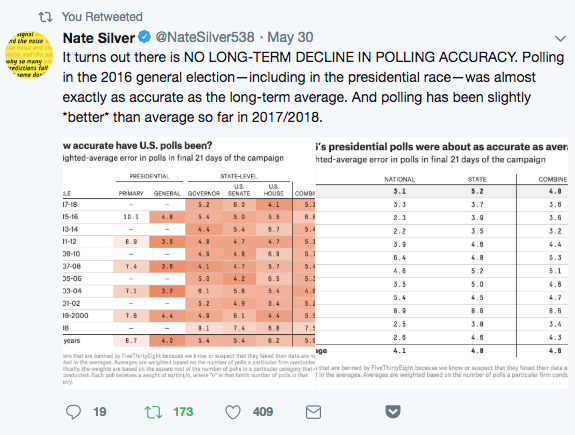
https://projects.fivethirtyeight.com/trump-approval-ratings/
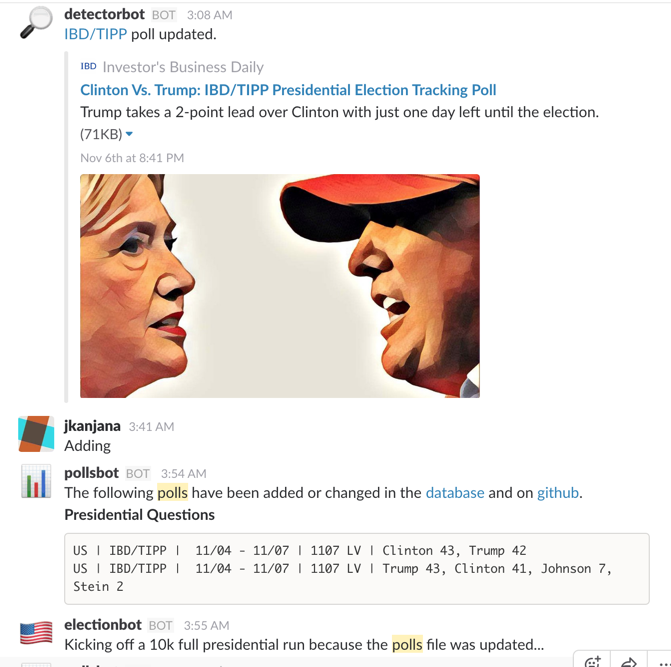
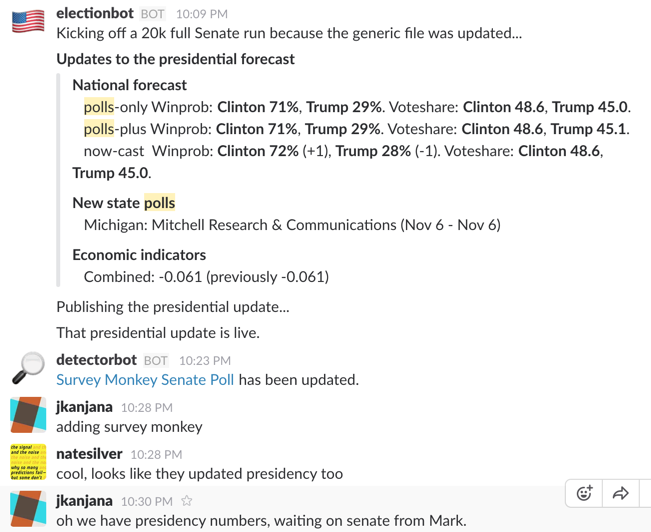
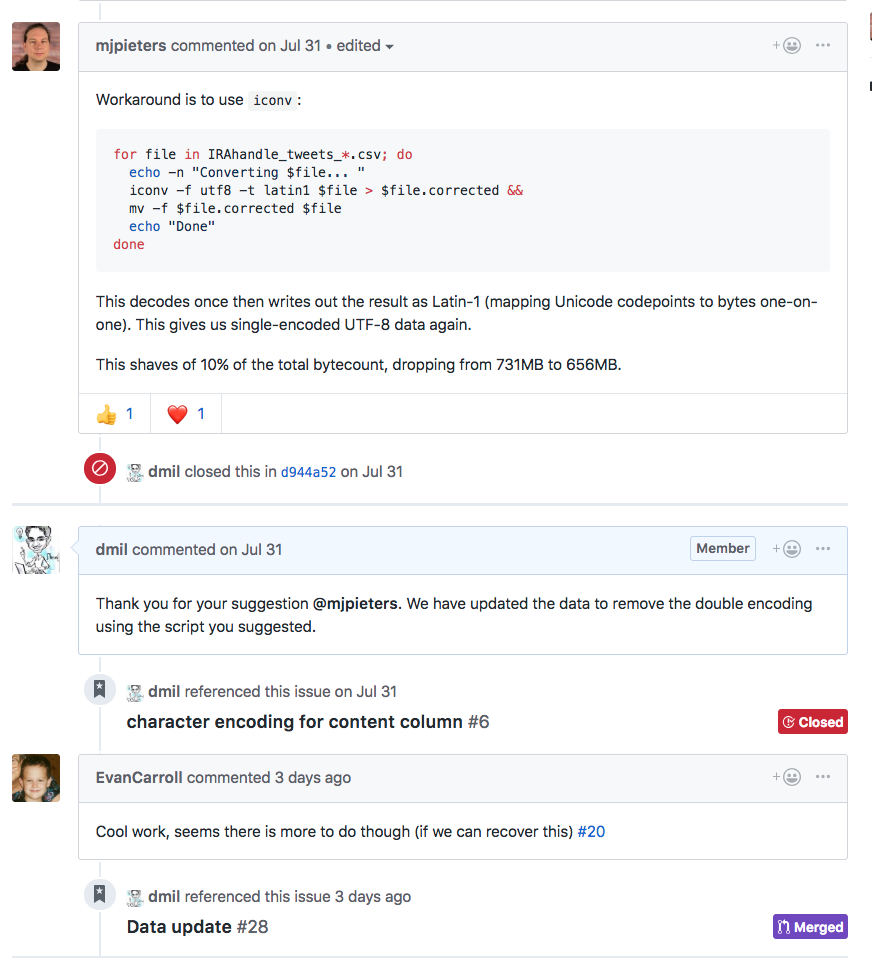
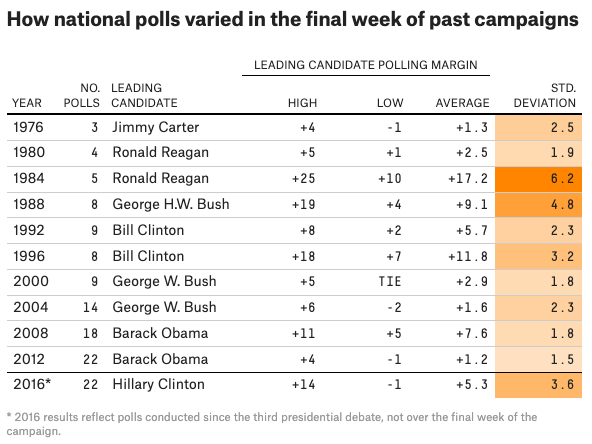
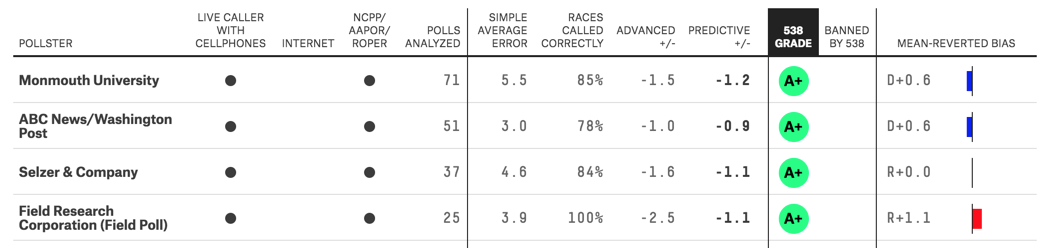
Internal Workflows
Lets readers see results that FiveThirtyEight deems unexpected
Expectations are calibrated before results ever start coming in.
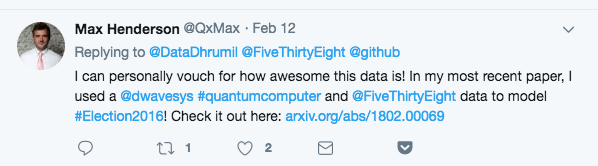
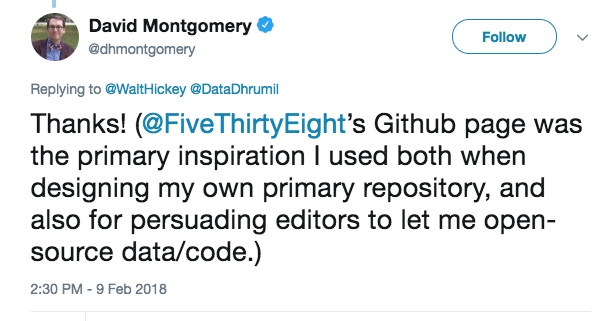
https://www.datajournalismawards.org/project-listing/?project_id=2082
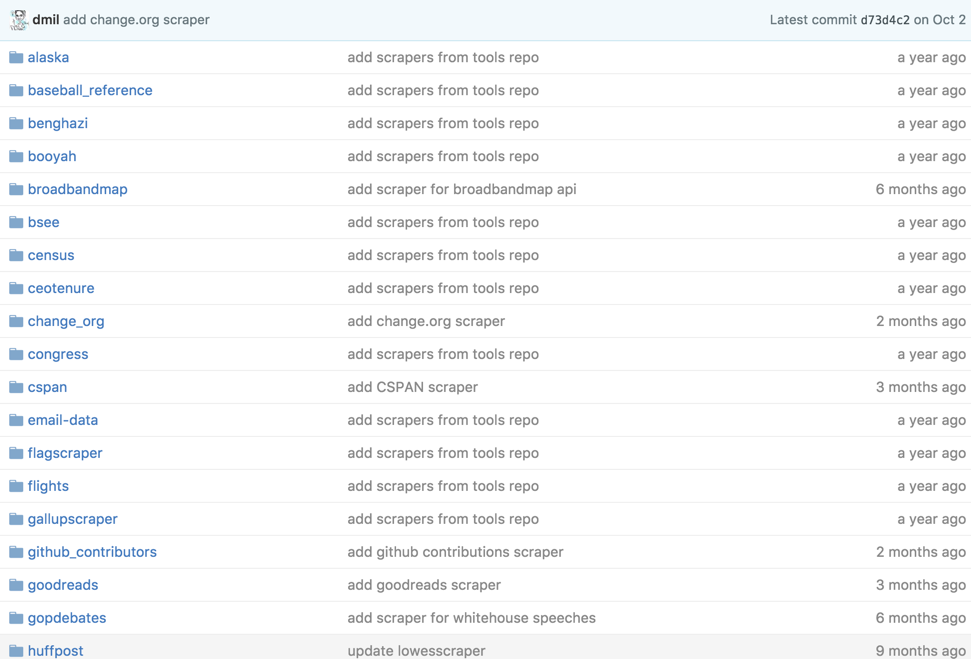
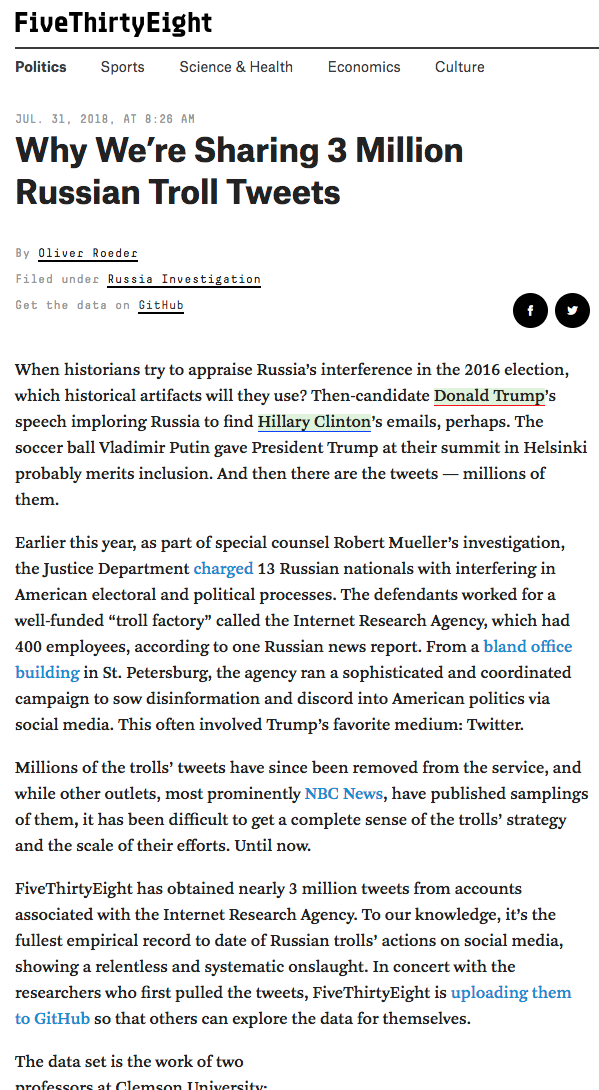
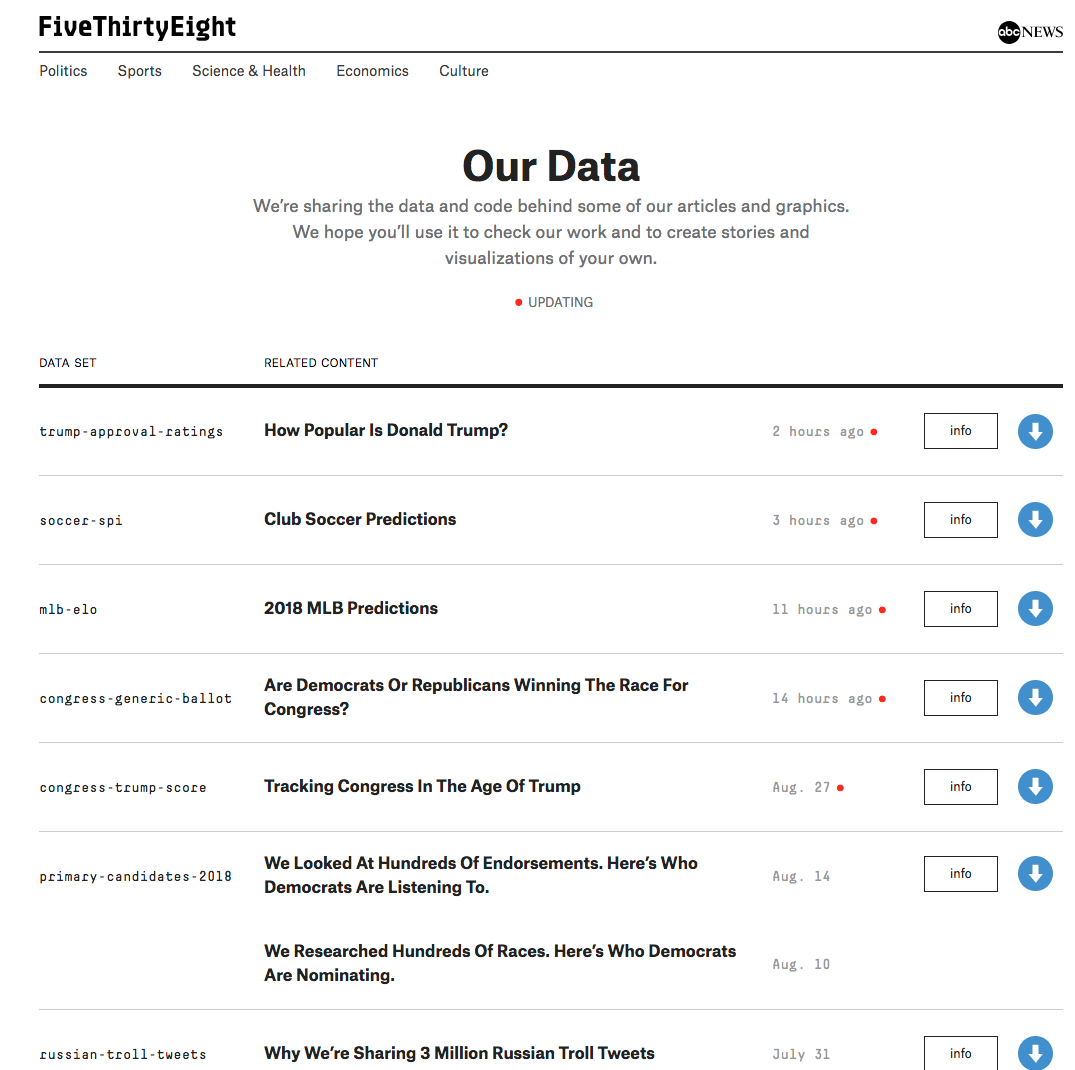
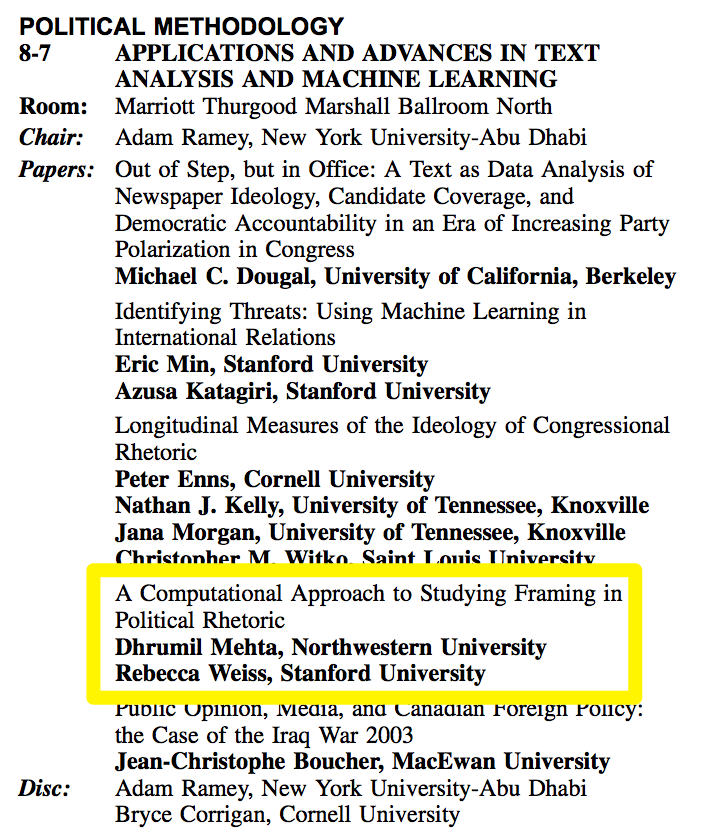
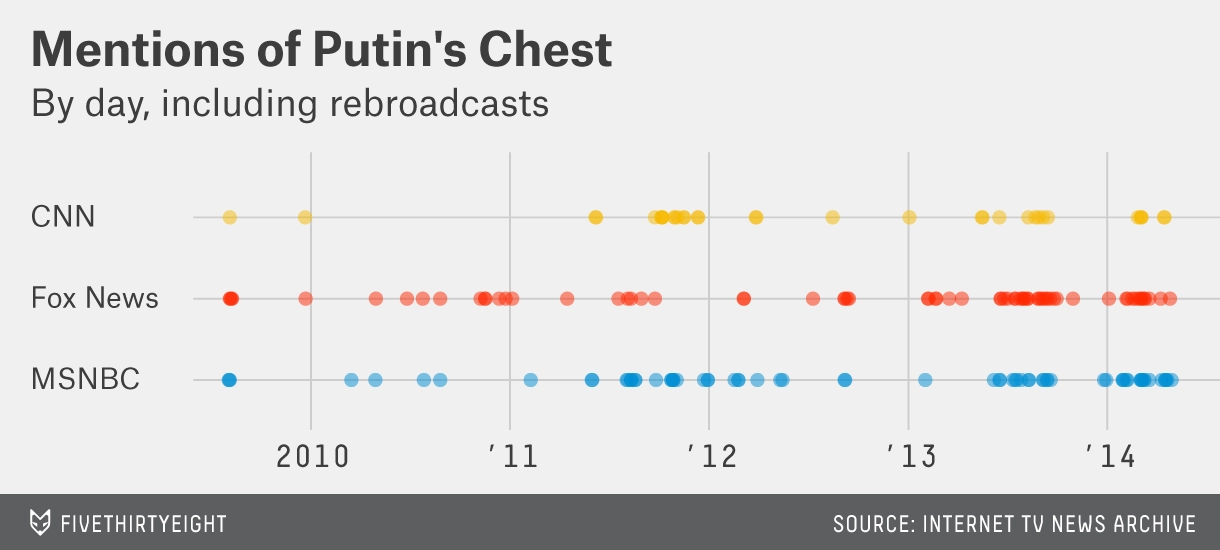
Computationally analyzing text to better understand media and political environments.
I have a research interest in text analysis
- what I'm good at
- what I'm working to improve
Live Coding
(unless I get nervous or we are short on time)
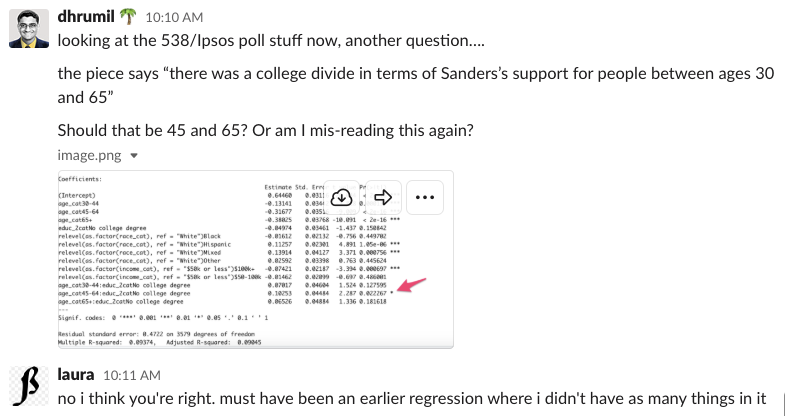
https://github.com/dmil/reporting-ii/blob/main/pre-class-survey/survey-responses.ipynb
Pay special attention to:
- [ ] The questions I ask of the dataset
- [ ] What I do when I don't know some code or forget how to do something
- [ ] What statistical or visual treatments I chose to apply and why
Take a second to write down (digitally) a bit about who you are! (bullet points...they don't have to be legible to anyone but yourself)
But there's a catch!
You have 5 minutes to create a 5-questions to get to know one other person in the room who you will have to introduce to the class
You will be split into:
1) Survey Makers
2) Interview Takers
Survey Makers (5 question survey)
Multiple Choice
Which of the following reporting topics interests you most? (1) Healthcare (2) Education (3) Agriculture
Scale
On a scale of 1-5, with 5 being most sure. How sure are you about what your thesis project will be about?
Yes/No
Are you an interested in New York City issues?
1-phrase Answer
Where did you grow up?
Interivew Takers
5 open-ended interview questions
Step 1: Send your questions to your partner via Slack
Step 2: Answer the questions that were sent to you via Slack
https://courseworks2.columbia.edu/courses/161304/assignments/syllabus
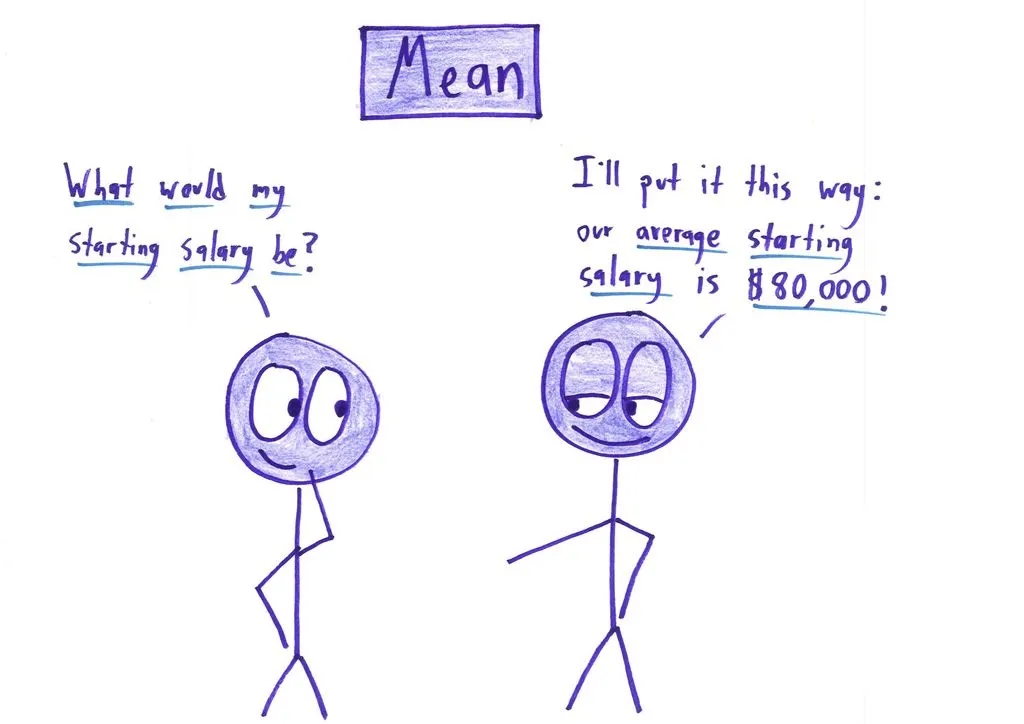
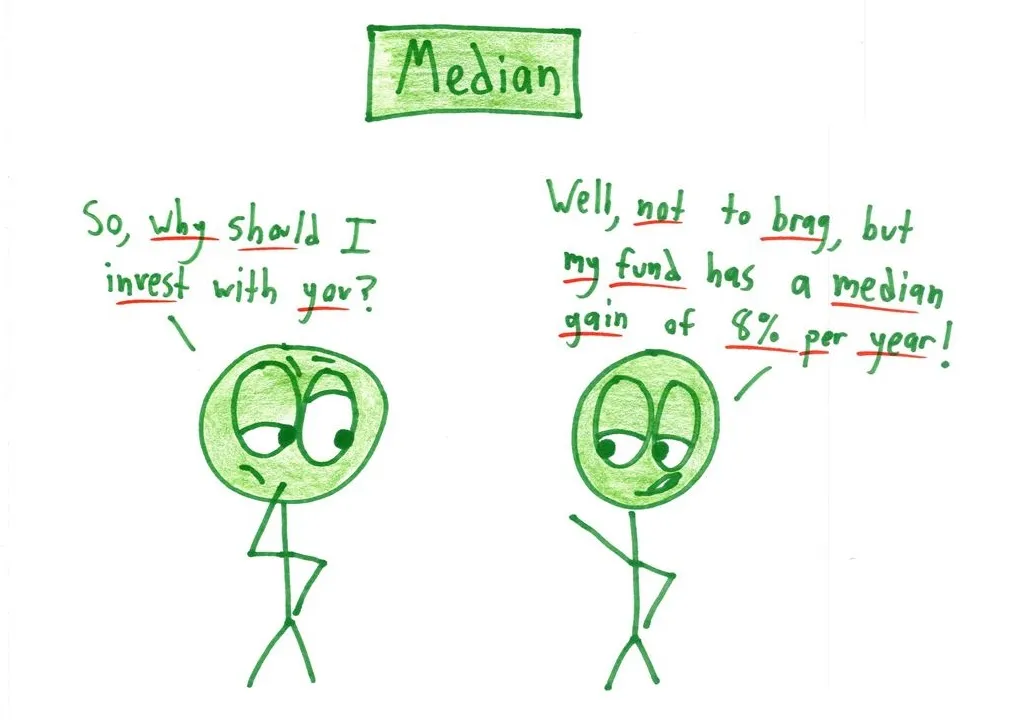
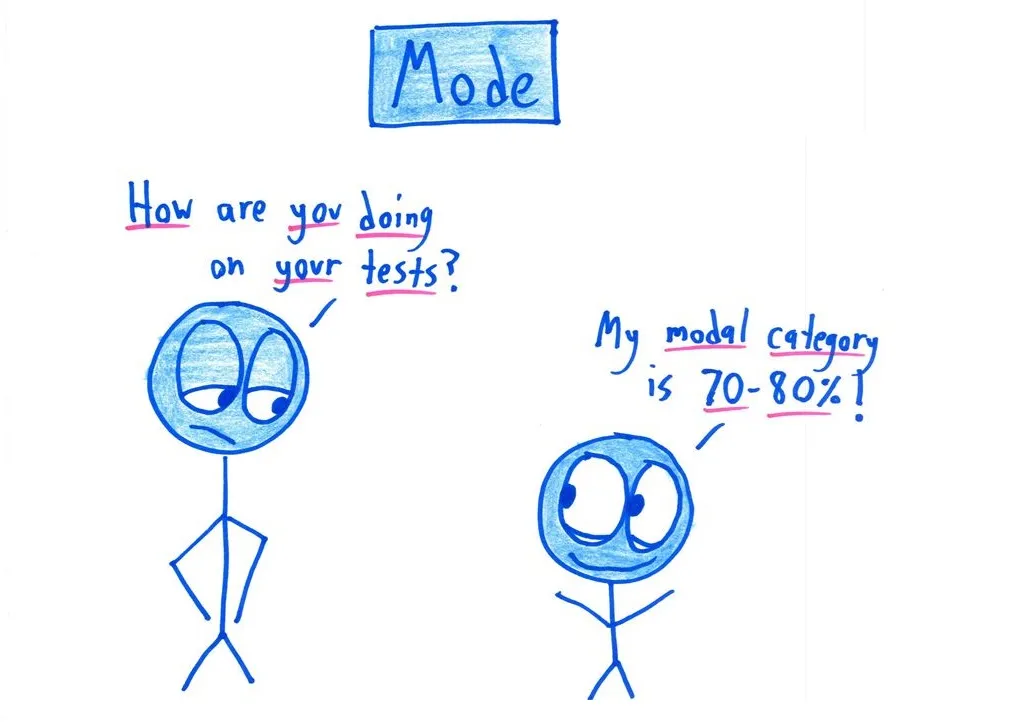
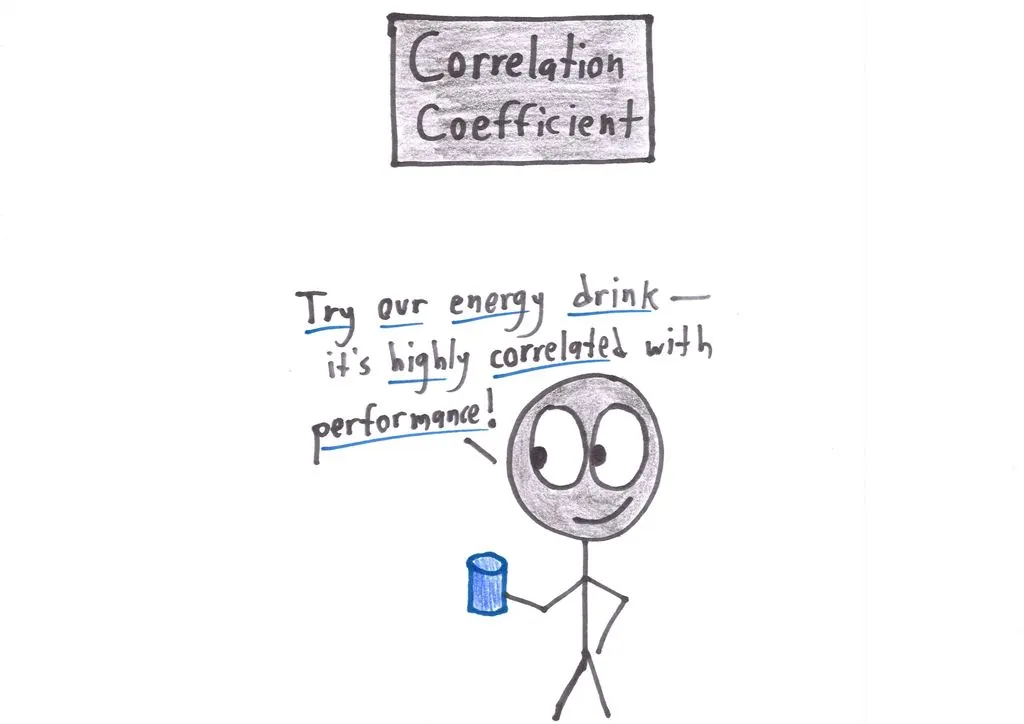
Ben Orlin — Math with bad drawings
Ben Orlin — Math with bad drawings
Text
Examples
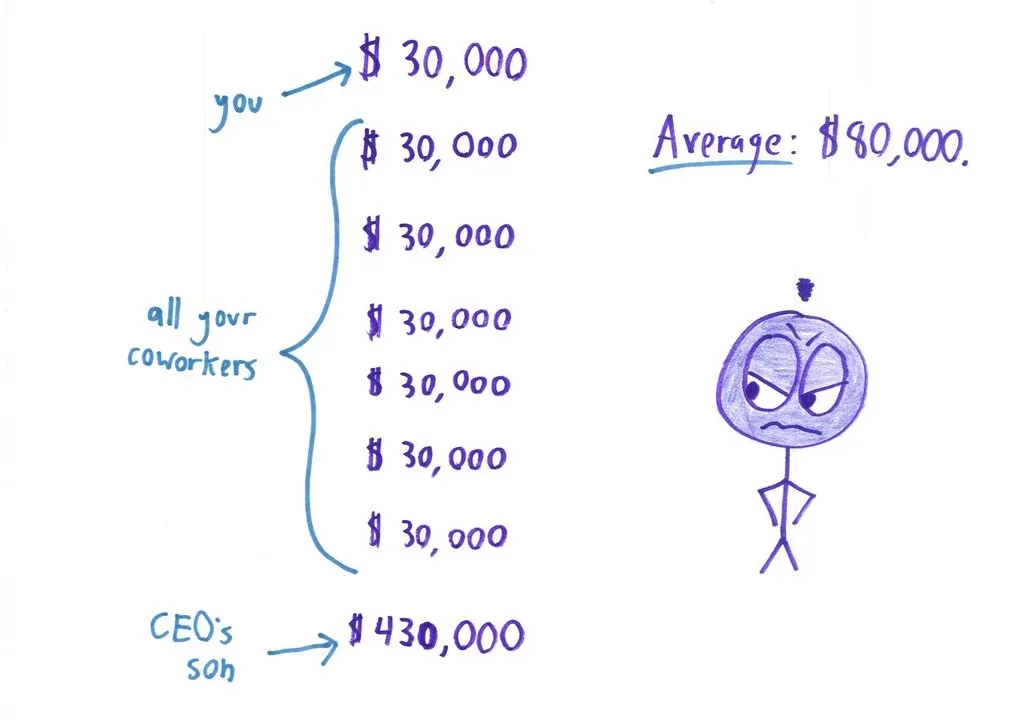
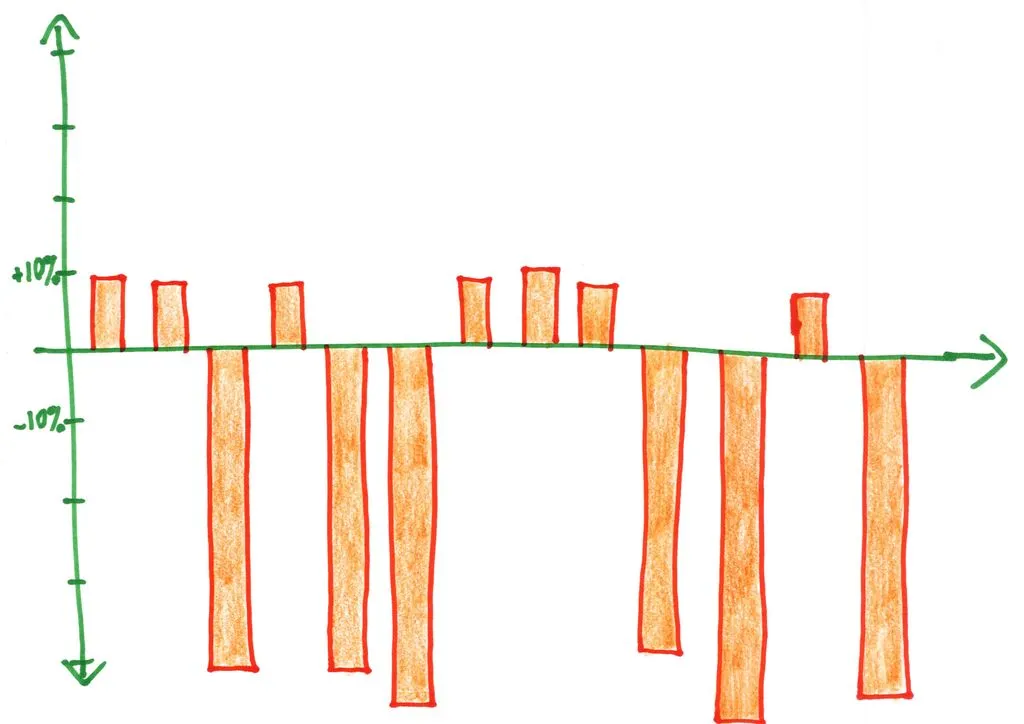
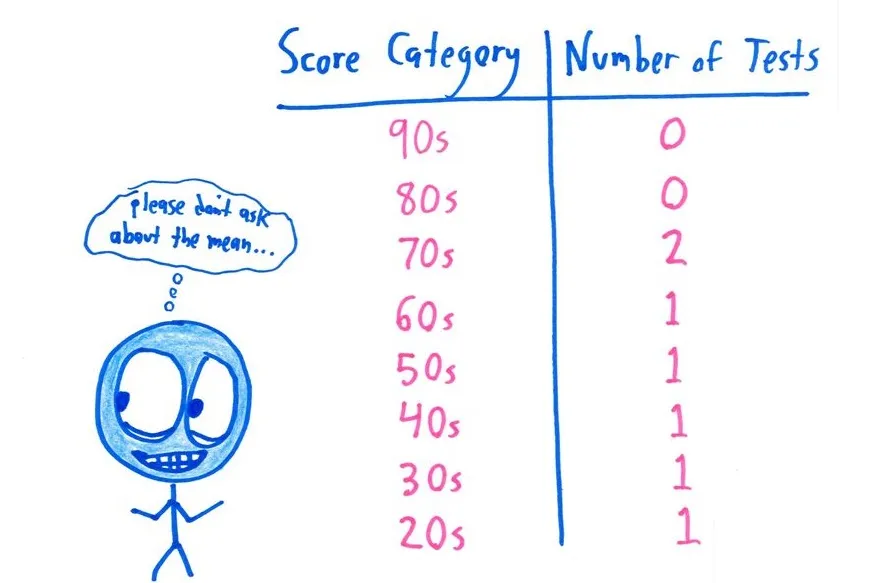
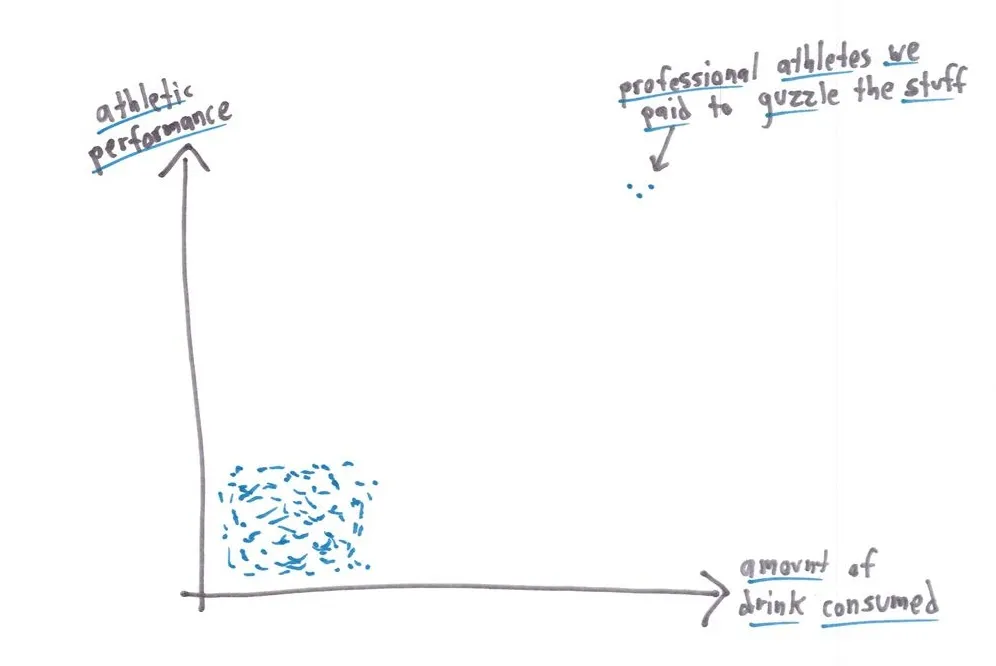
Ben Orlin — Math with bad drawings
Ben Orlin — Math with bad drawings
Examples
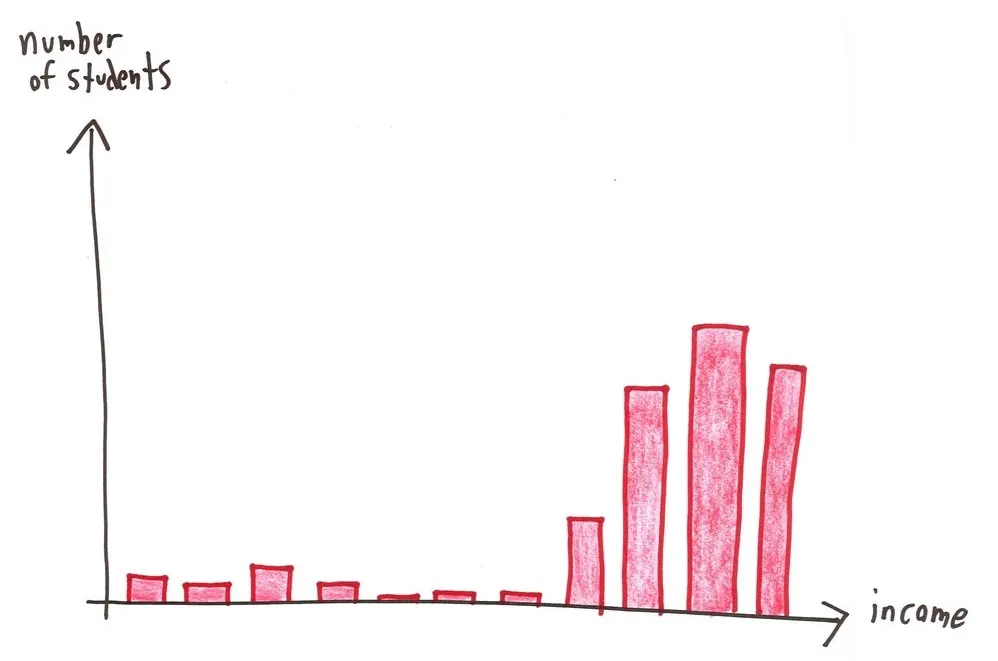
Ben Orlin — Math with bad drawings
Ben Orlin — Math with bad drawings
Ben Orlin — Math with bad drawings
Ben Orlin — Math with bad drawings
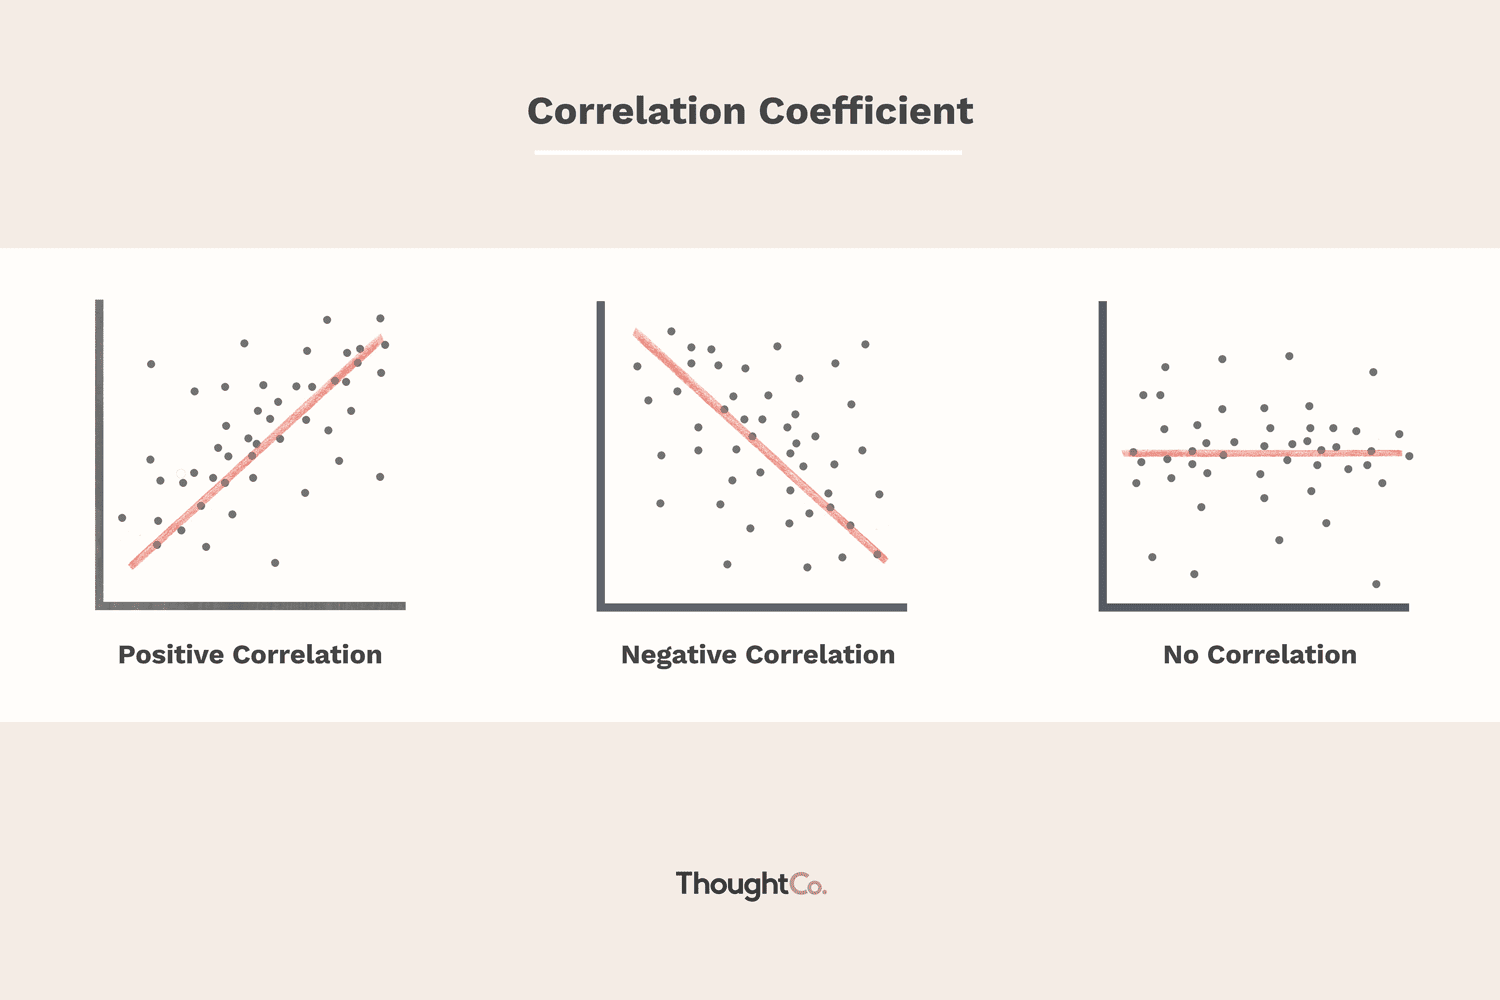
https://www.investopedia.com/terms/n/negative-correlation.asp
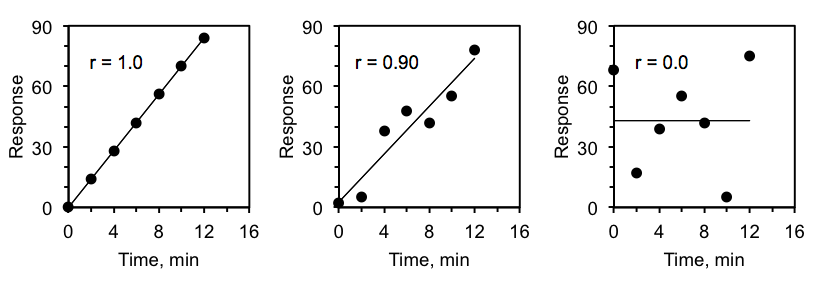
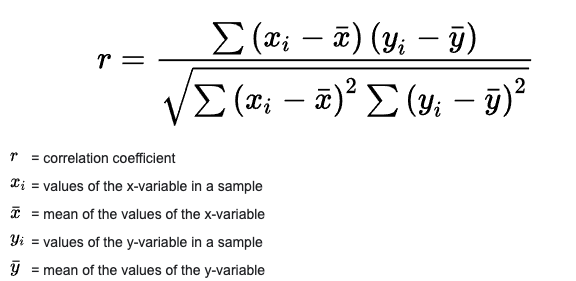
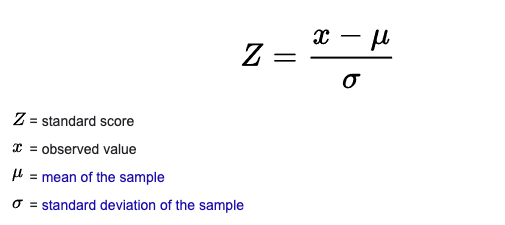
Pearson's Correlation Coefficient
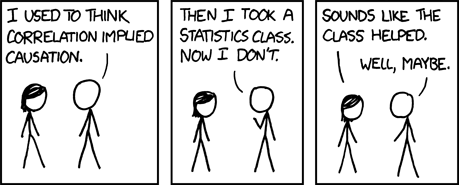
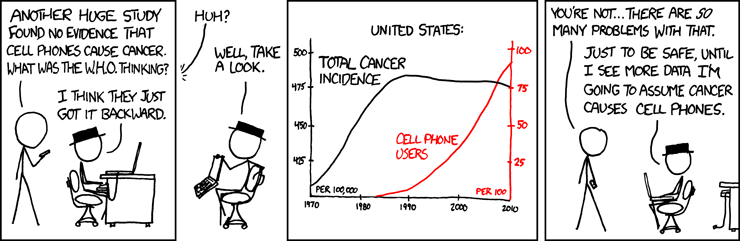
Correlation doesn't imply causation, but it does waggle its eyebrows suggestively and gesture furtively while mouthing 'look over there'.
Ben Orlin — Math with bad drawings
Ben Orlin — Math with bad drawings
Examples
Examples
Ben Orlin — Math with bad drawings
Ben Orlin — Math with bad drawings
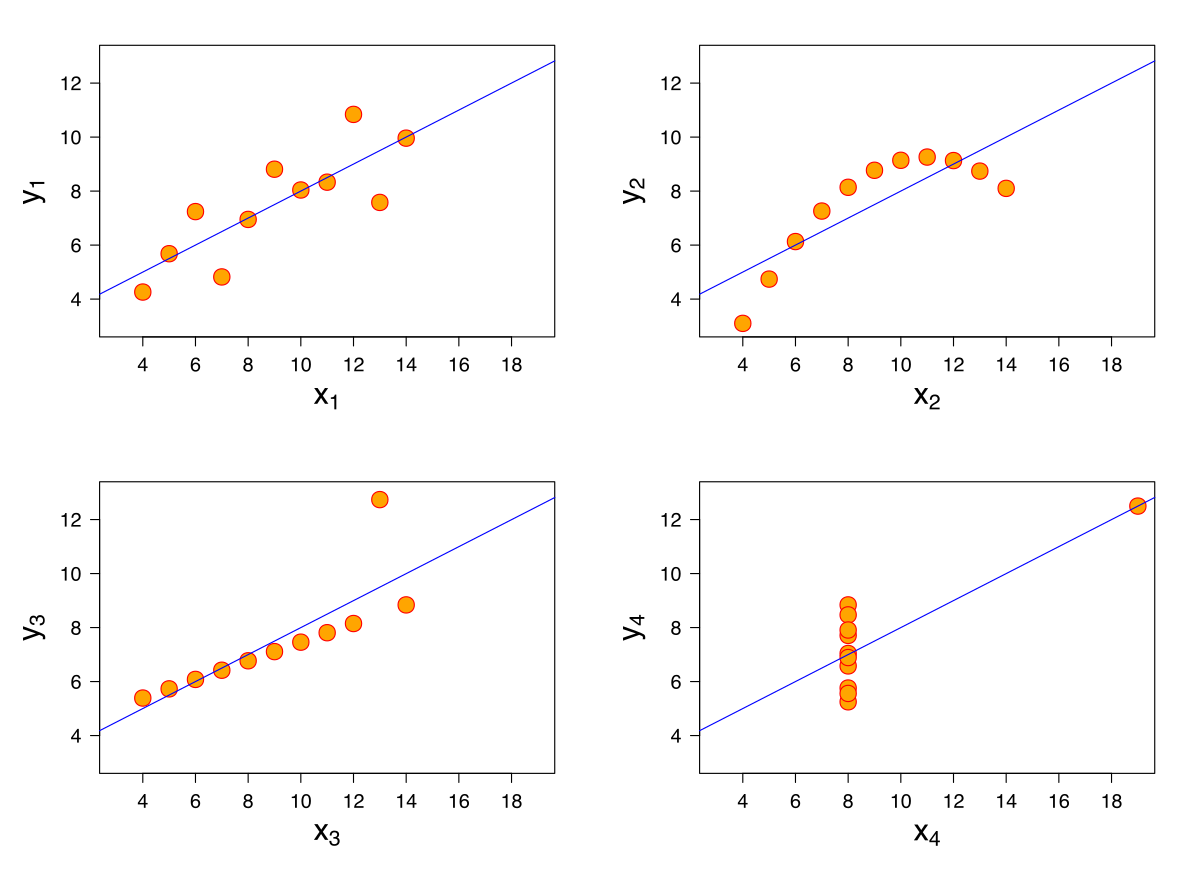
https://docs.google.com/spreadsheets/d/1ObVYCOeTgGK_n9rhVFG05I-VIjzriO-F6mCDIpdd_lo/edit#gid=0
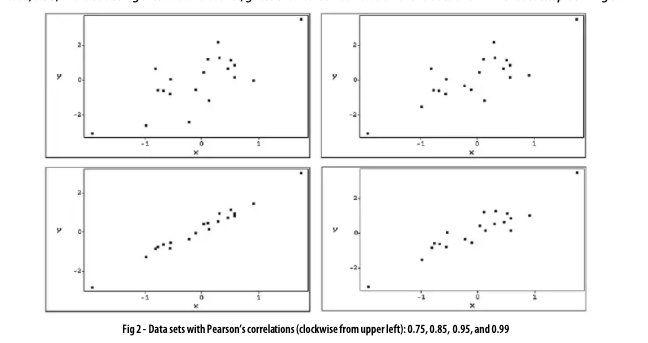
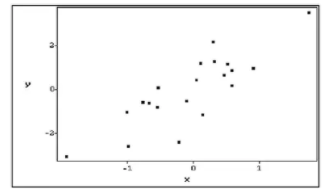
What can you tell about these 4 mystery datasets with summary statistics?
Calculate:
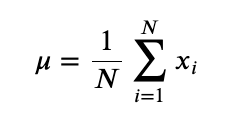
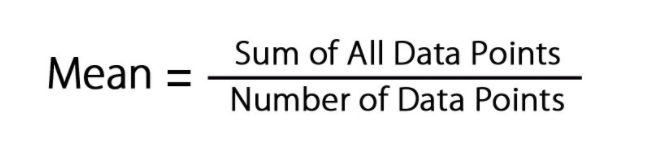
- Mean
- Median
- Mode
- Correlation
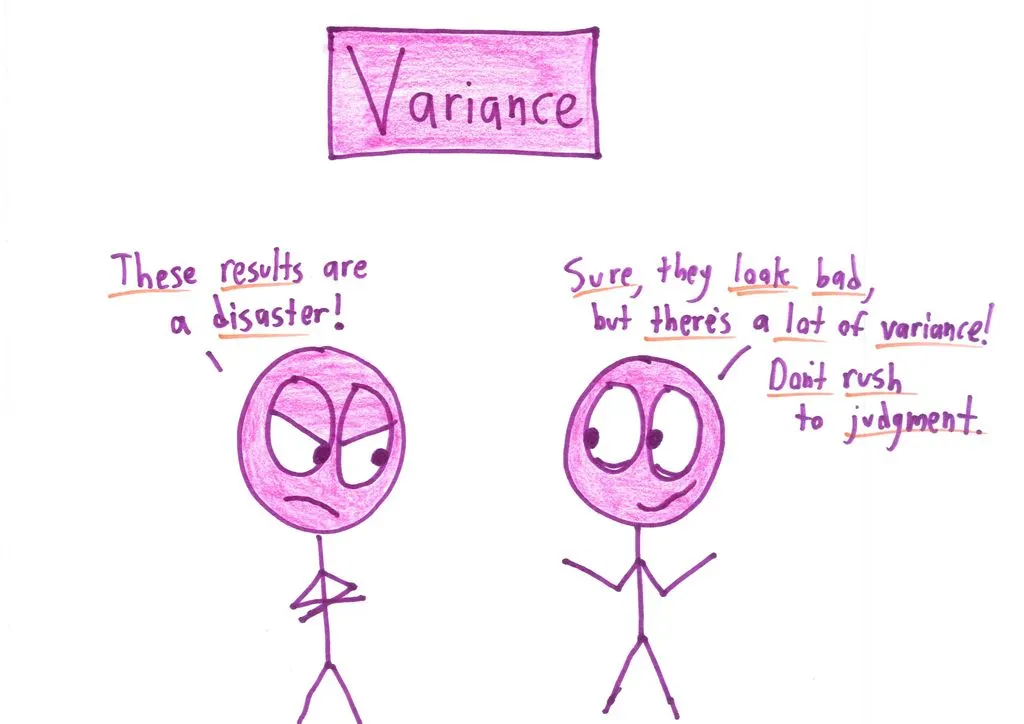
- Variance
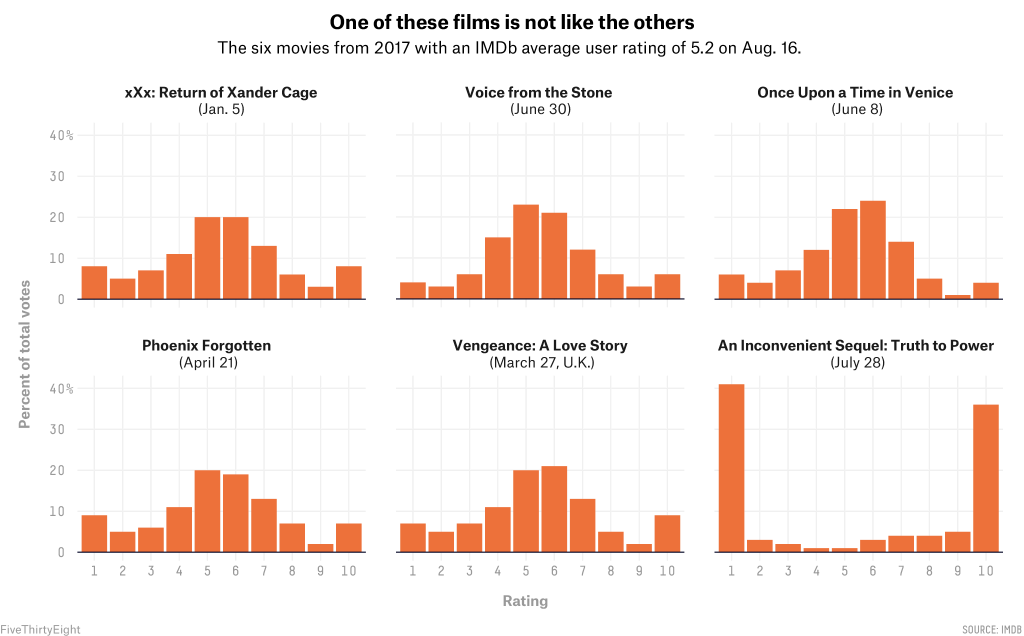
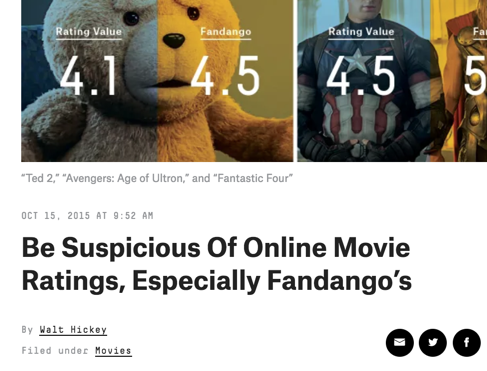
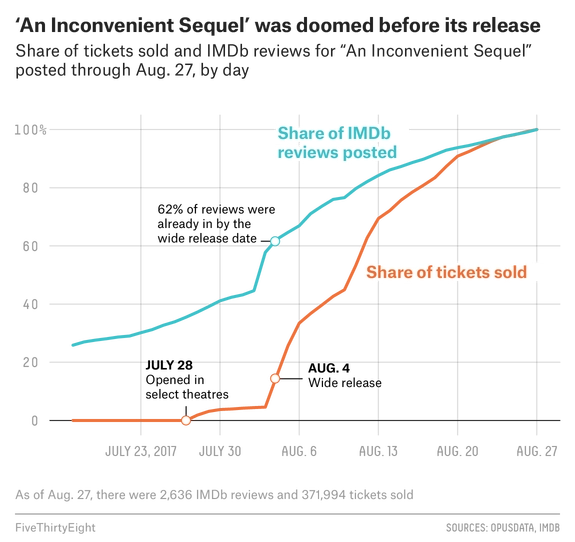
https://fivethirtyeight.com/features/al-gores-new-movie-exposes-the-big-flaw-in-online-movie-ratings/
Exploratory Data Visualization
Pearson correlation is ????
Pearson correlation is 0.9909
because there are 40 duplicate data pts in top right and bottom left corner
I have a dataset I'm interested in
I have a journalistic question that I'm interested in trying to answer
Does your pitch start with a:
What questions will I ask?
Where will I get the data?
I have a dataset I'm interested in
I have a journalistic question that I'm interested in trying to answer
Does your pitch start with a:
What questions will I ask?
Where will I get the data?
By Dhrumil Mehta
Saying hello to students


