


Dhrumil Mehta
Database Journalist, Politics @ FiveThirtyEight
Associate Prof @ Columbia U. Graduate School of Journalism
Visiting Prof @ Harvard Kennedy School of Government
dhrumil.mehta@columbia.edu
@datadhrumil
@dmil
Guest Lecture @ Cornell Tech
Currently
Associate Prof. @ Columbia Graduate School of Journalism
Visiting Prof. @ Harvard Kennedy School
Previously
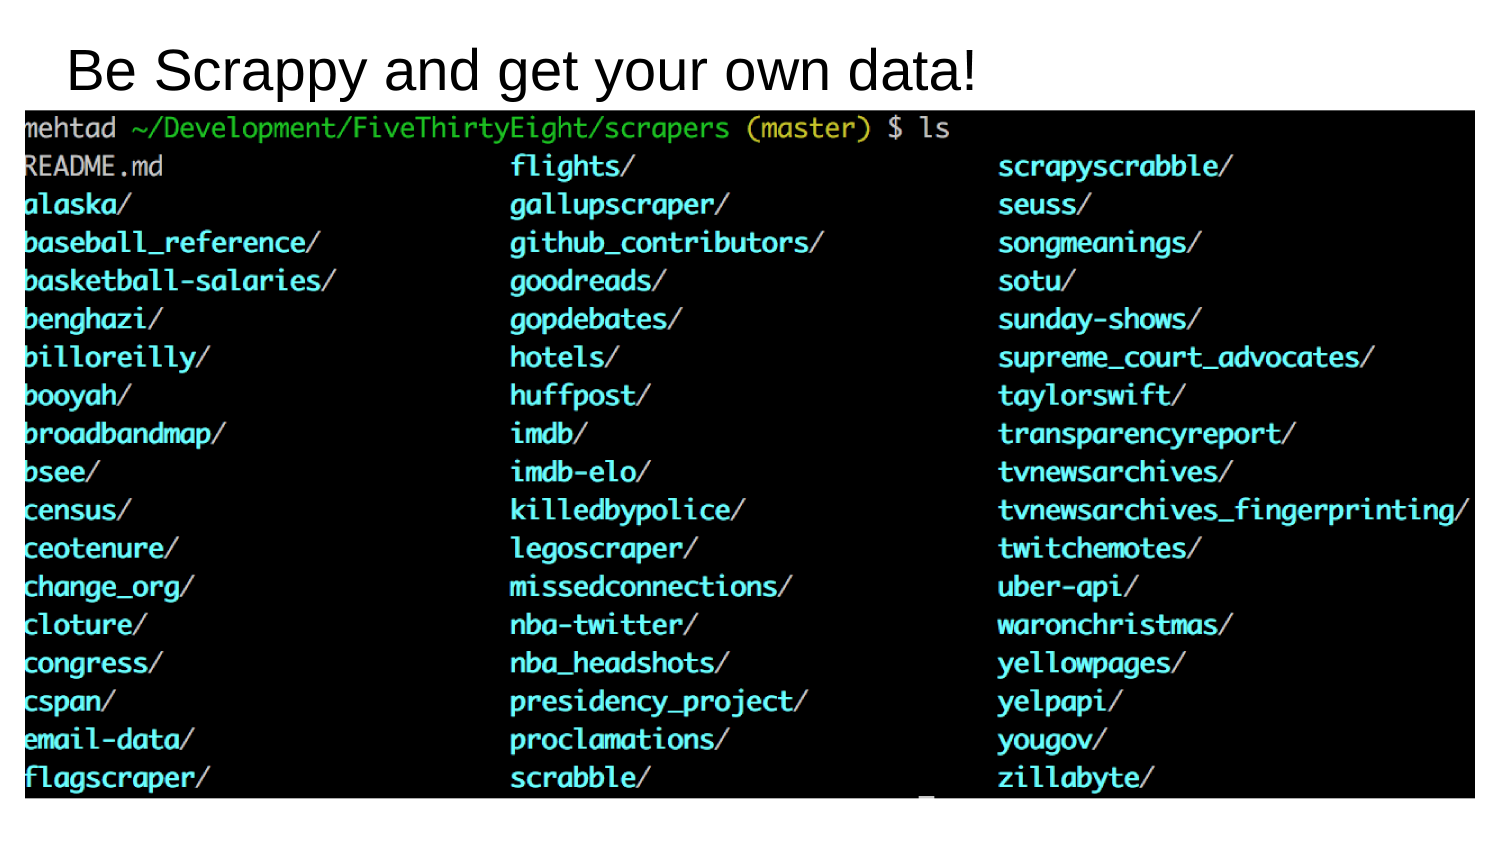
Database Journalist, Politics @ FiveThirtyEight
Database Journalist, Politics
Themes
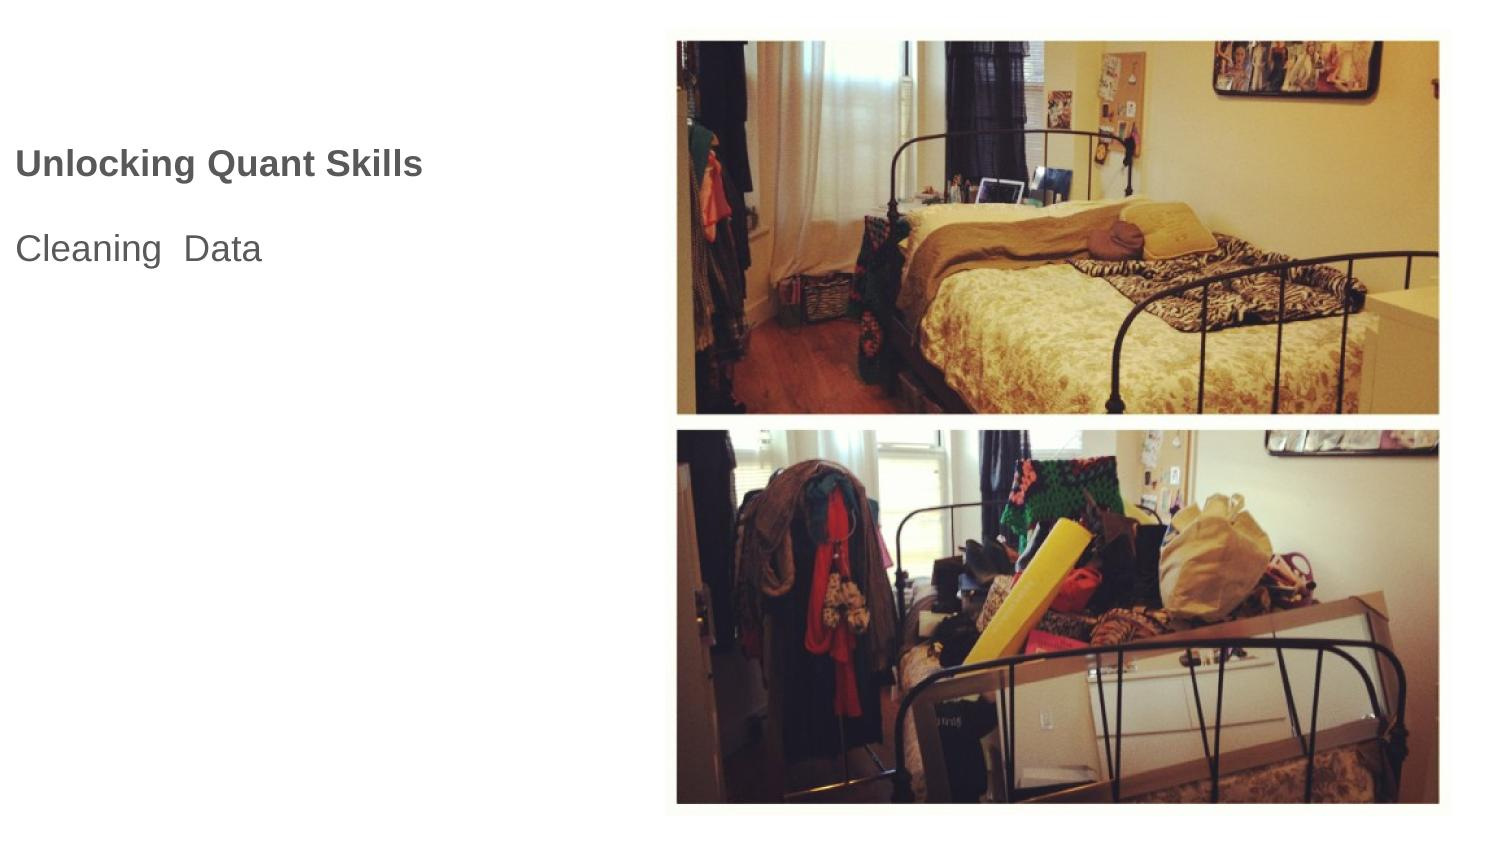
Datasets in the classroom
Datasets at work
Know your dataset
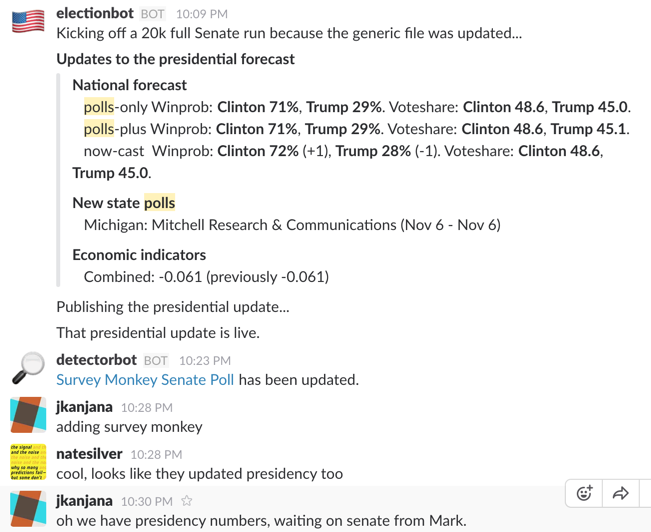
Internal Workflows
Editorial Descision making
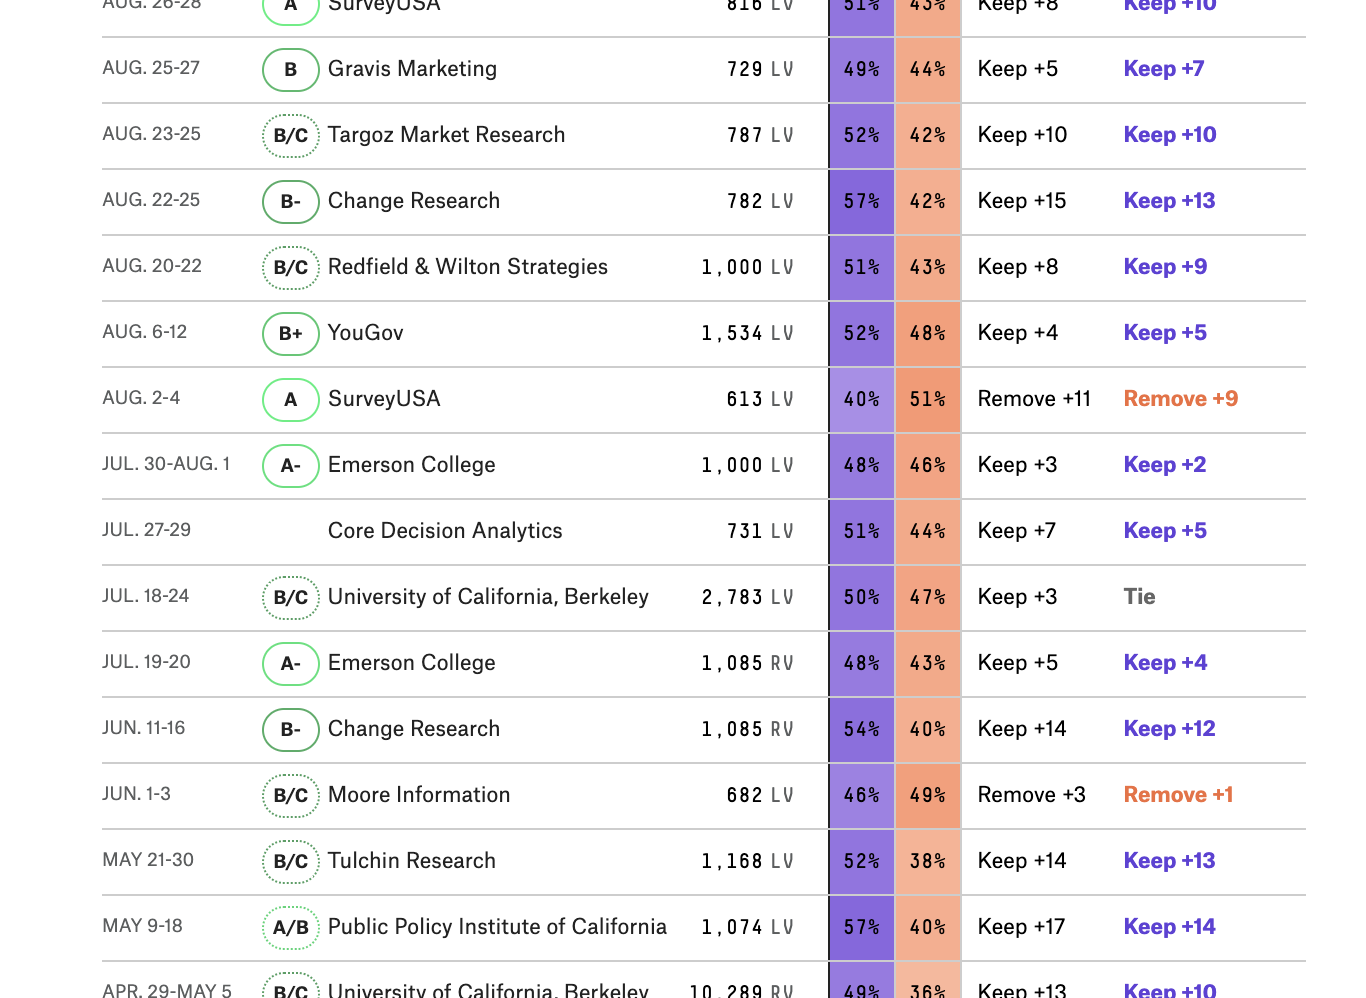
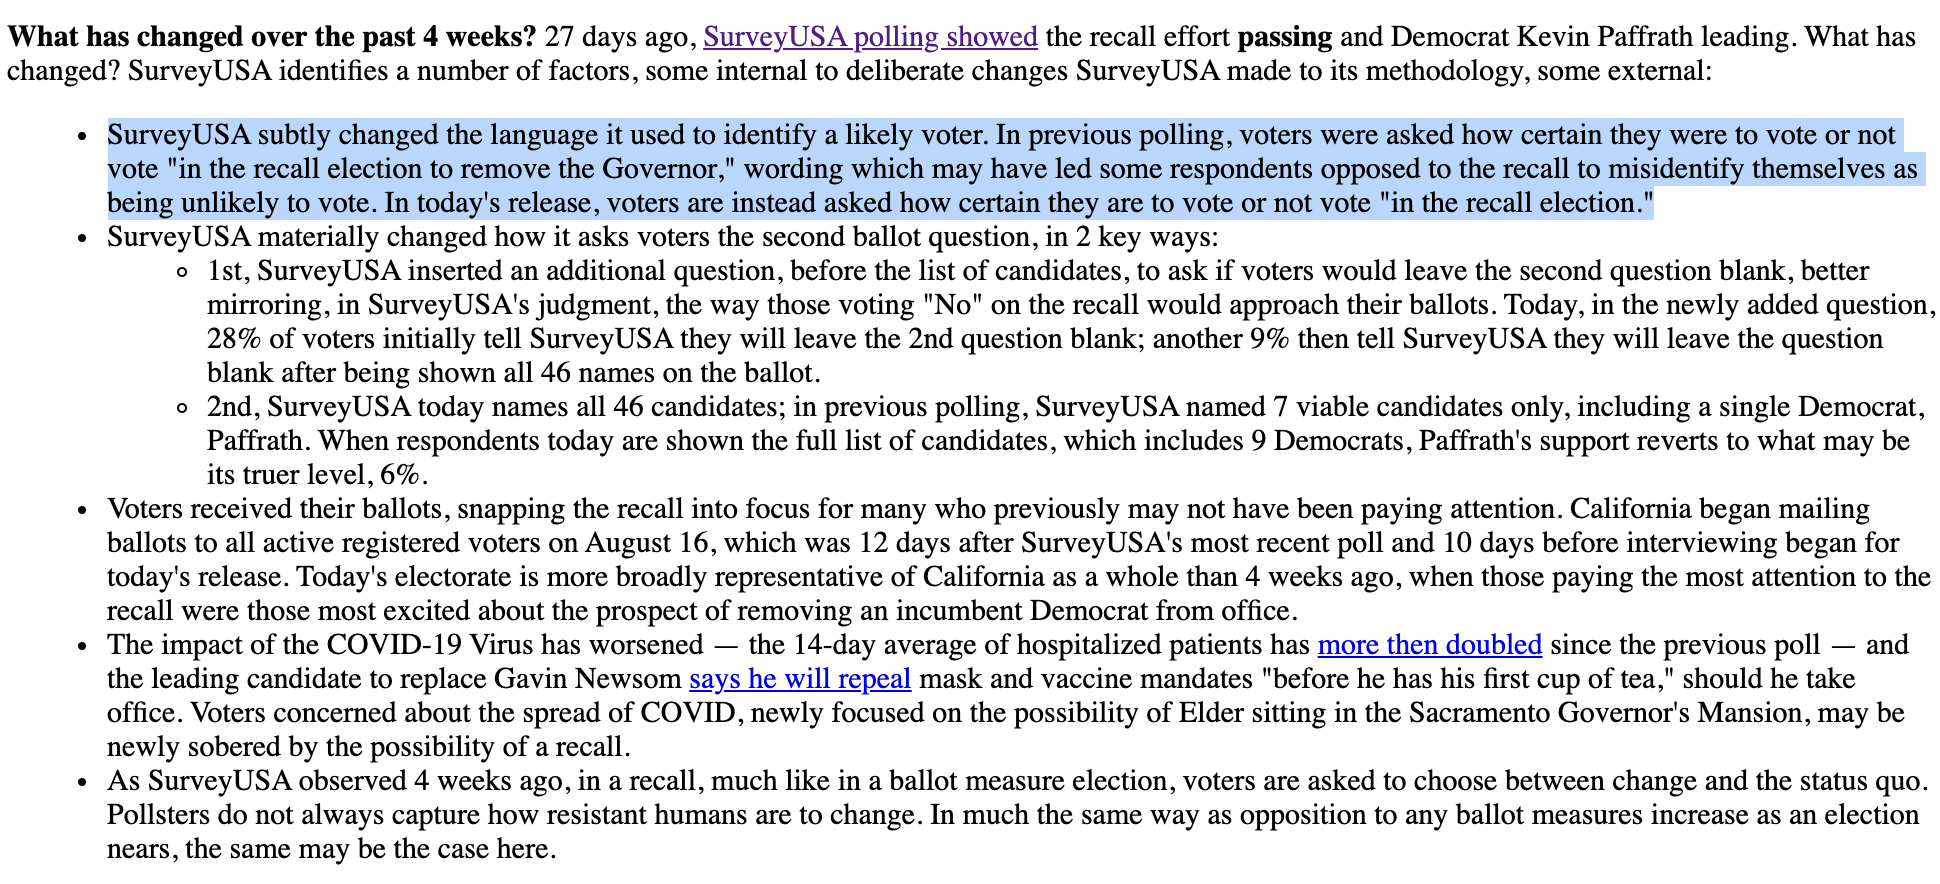
Do you keep the poll in the polling average or do your remove it?
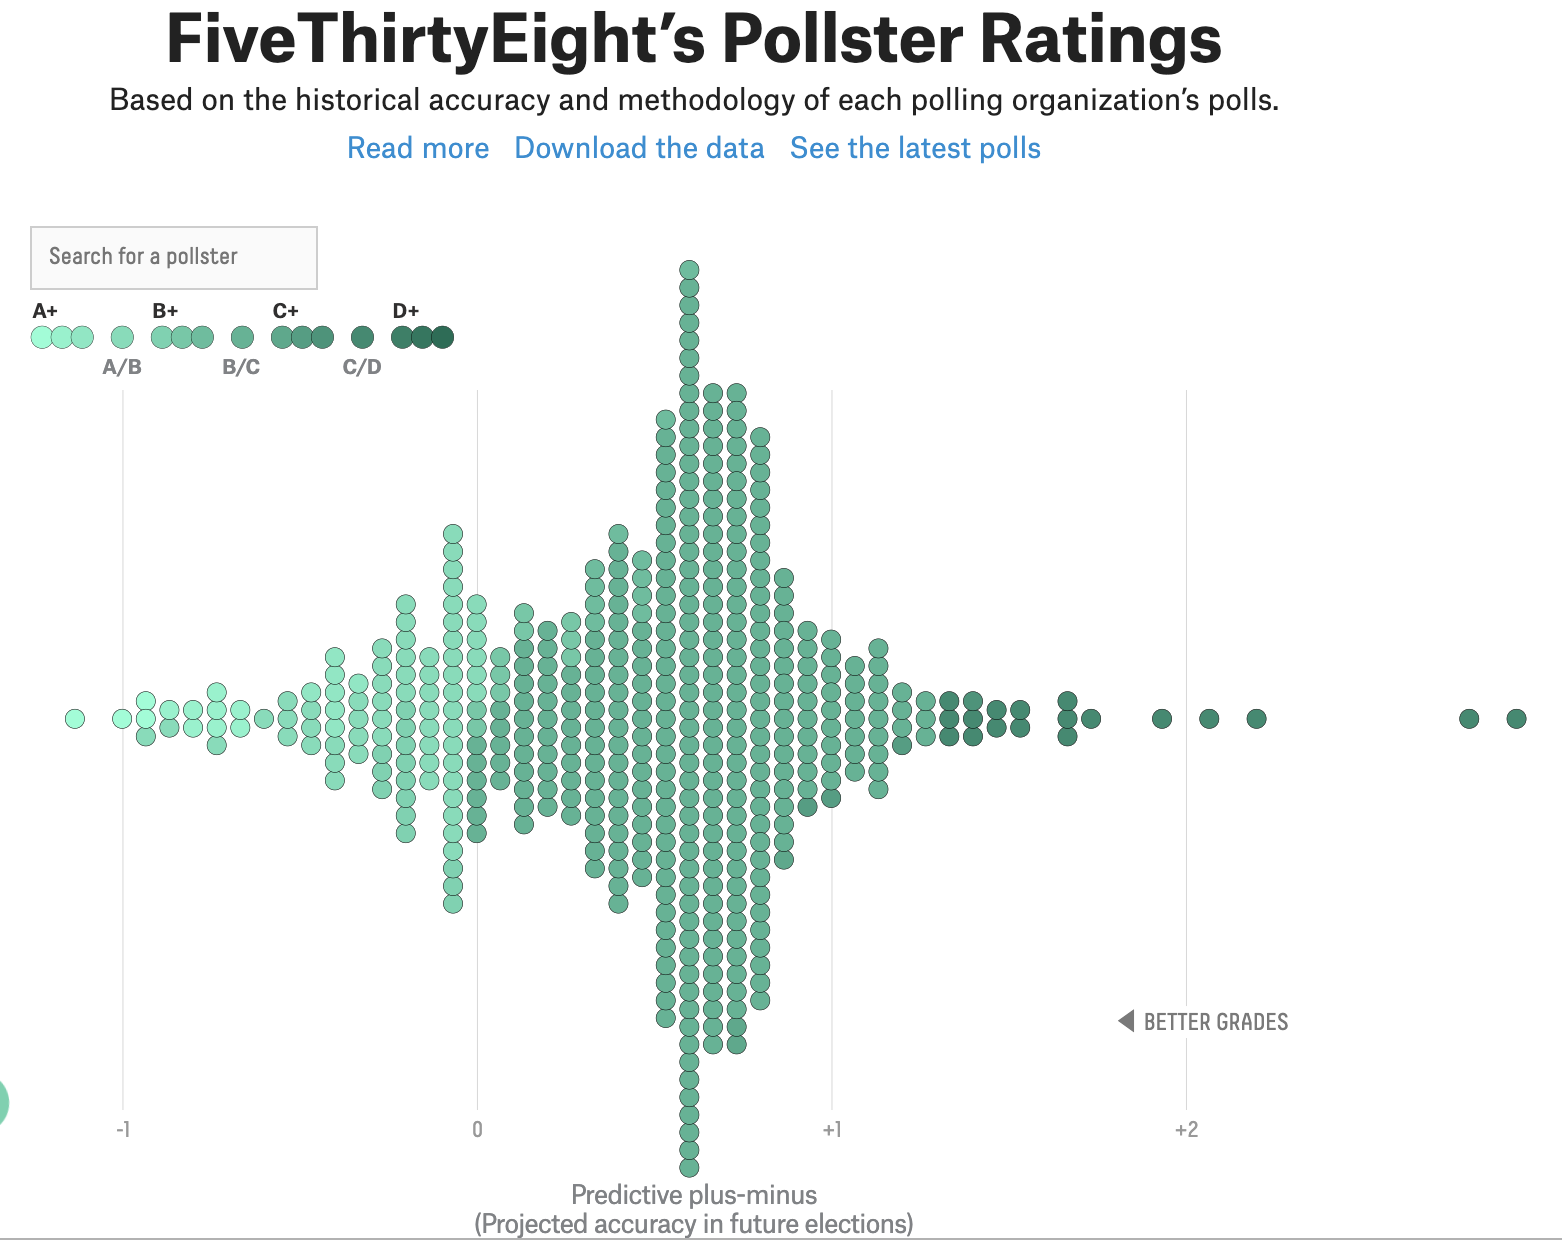
Weighting polls by the historical accuracy of their pollster
But...How do we define historical accuracy?
Senate, House, Governor, Presidential and Pres Primary
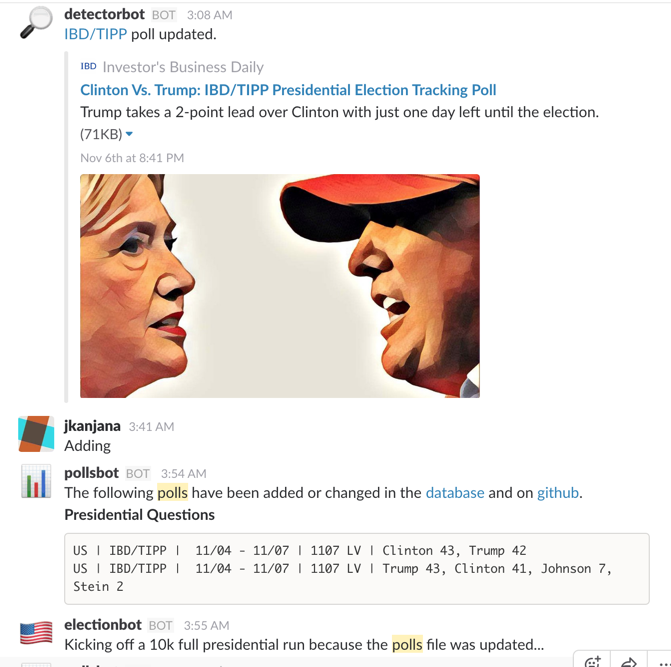
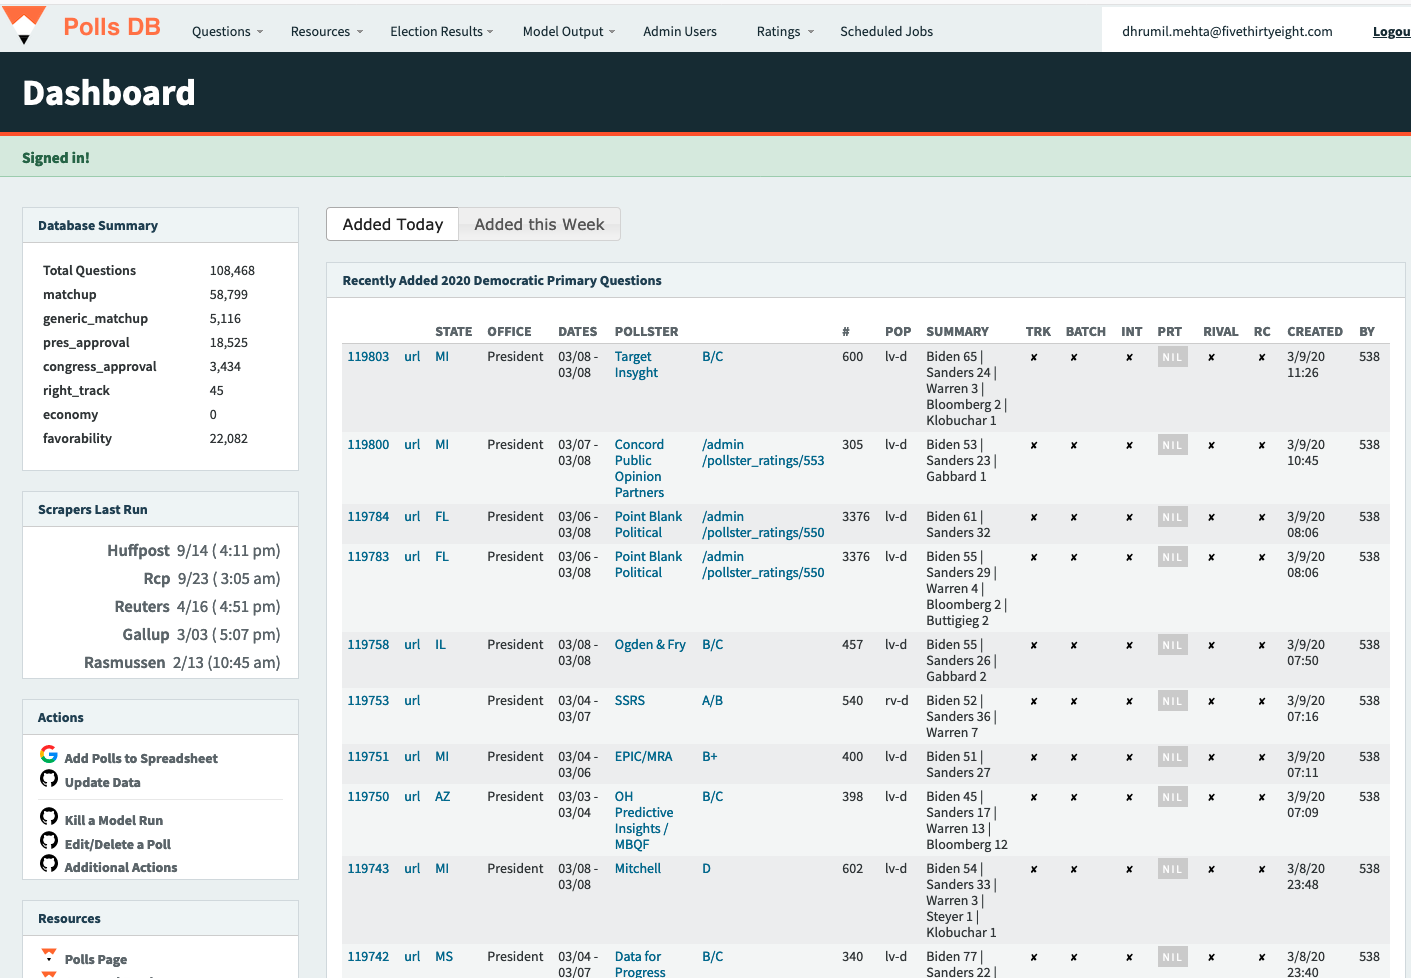
Step 1: Collect and classify polls
Step 2: Calculate simple average error
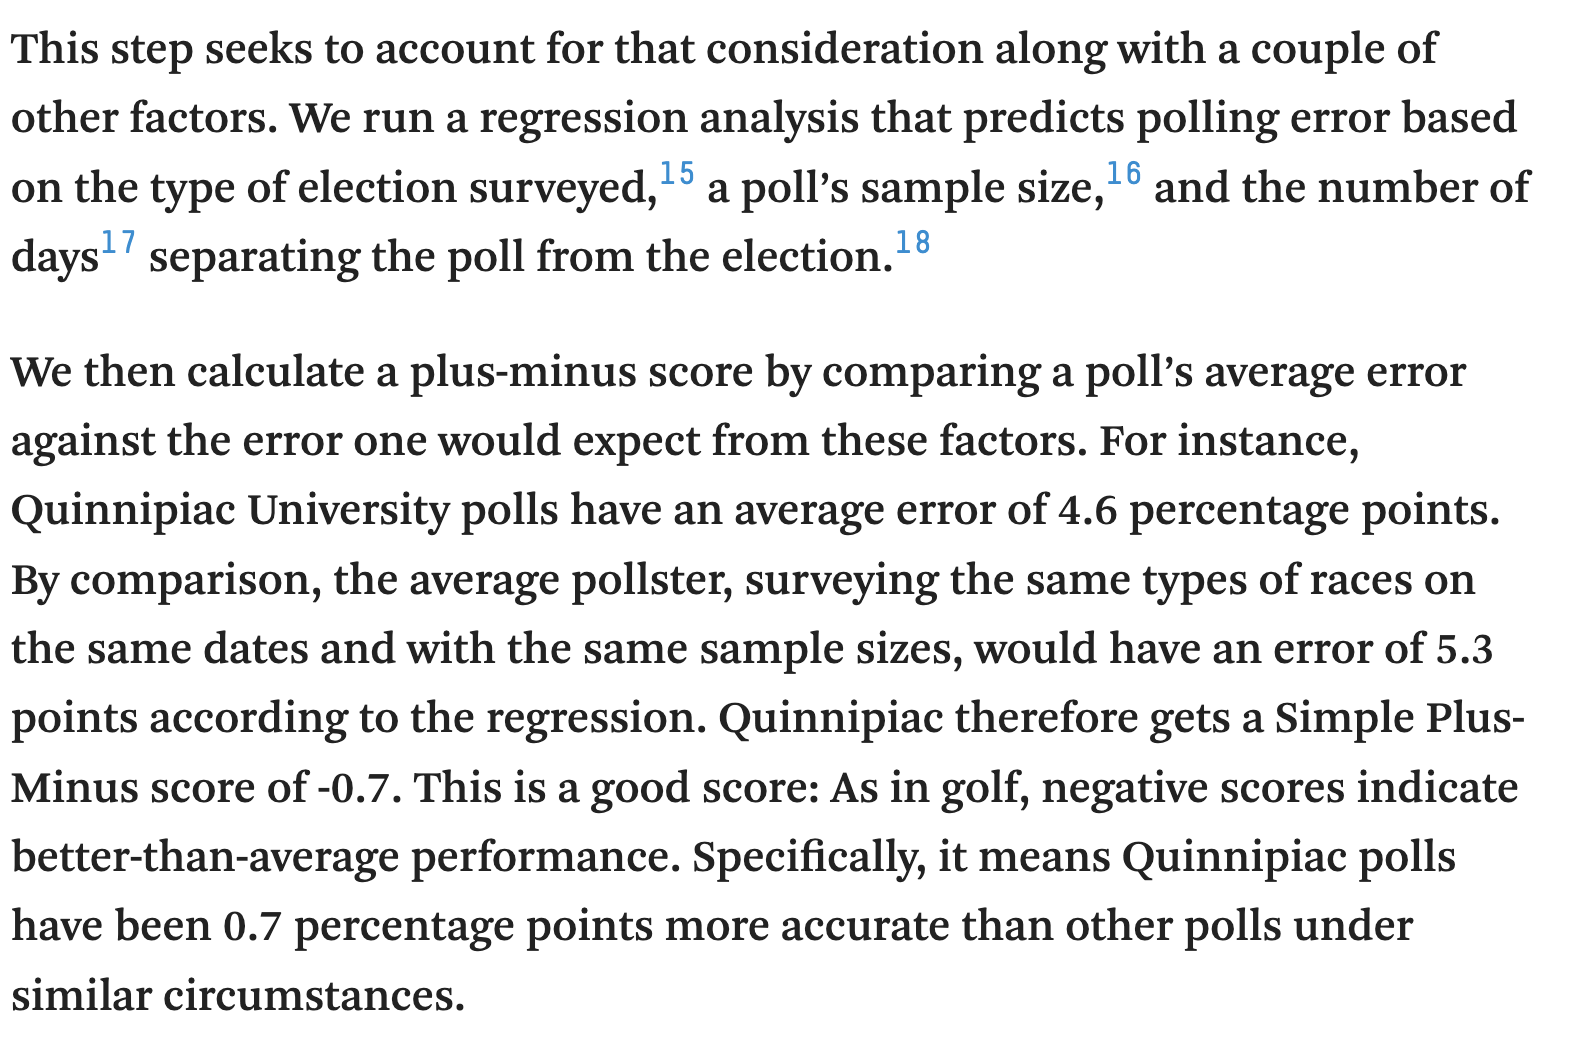
Step 3: Calculate Simple Plus-Minus
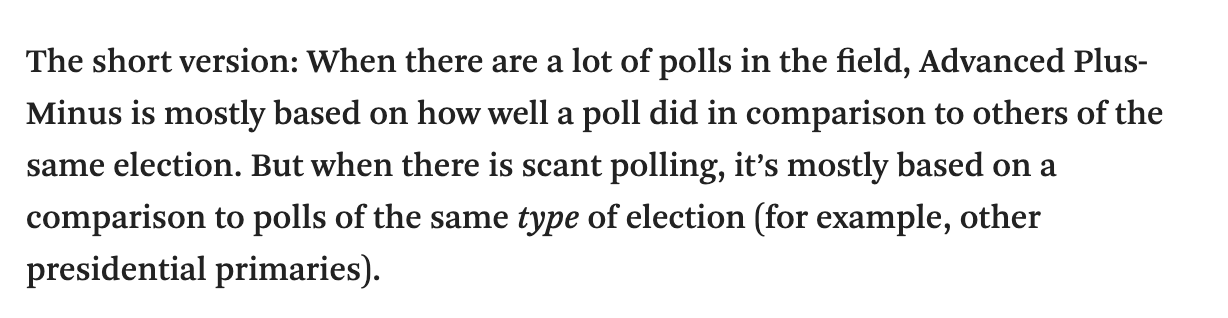
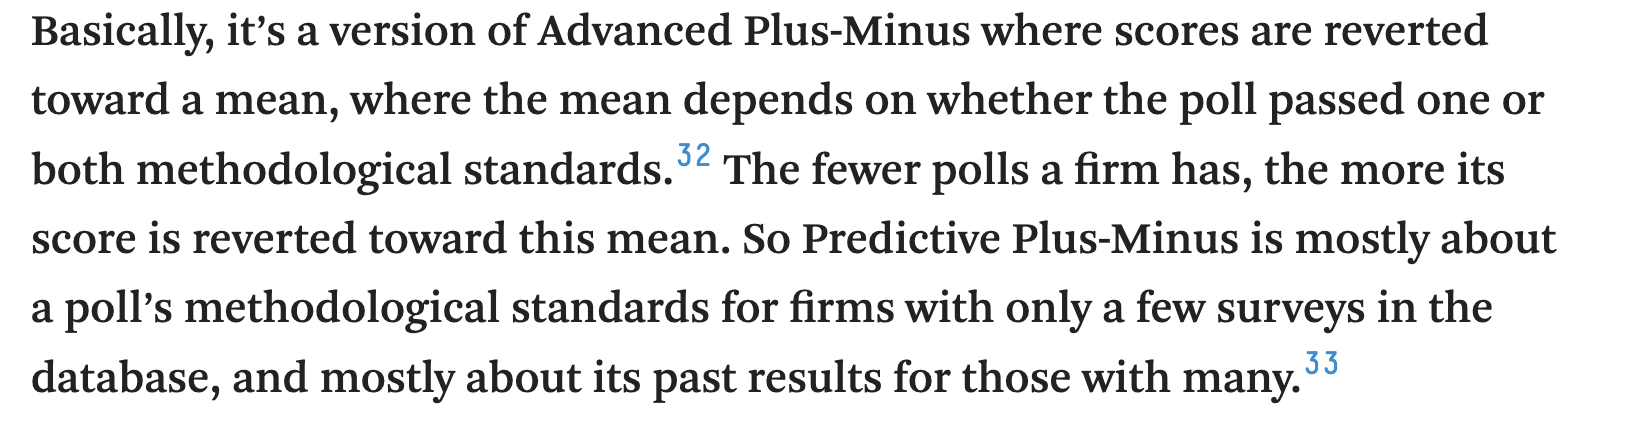
Step 4: Calculate Advanced Plus-Minus
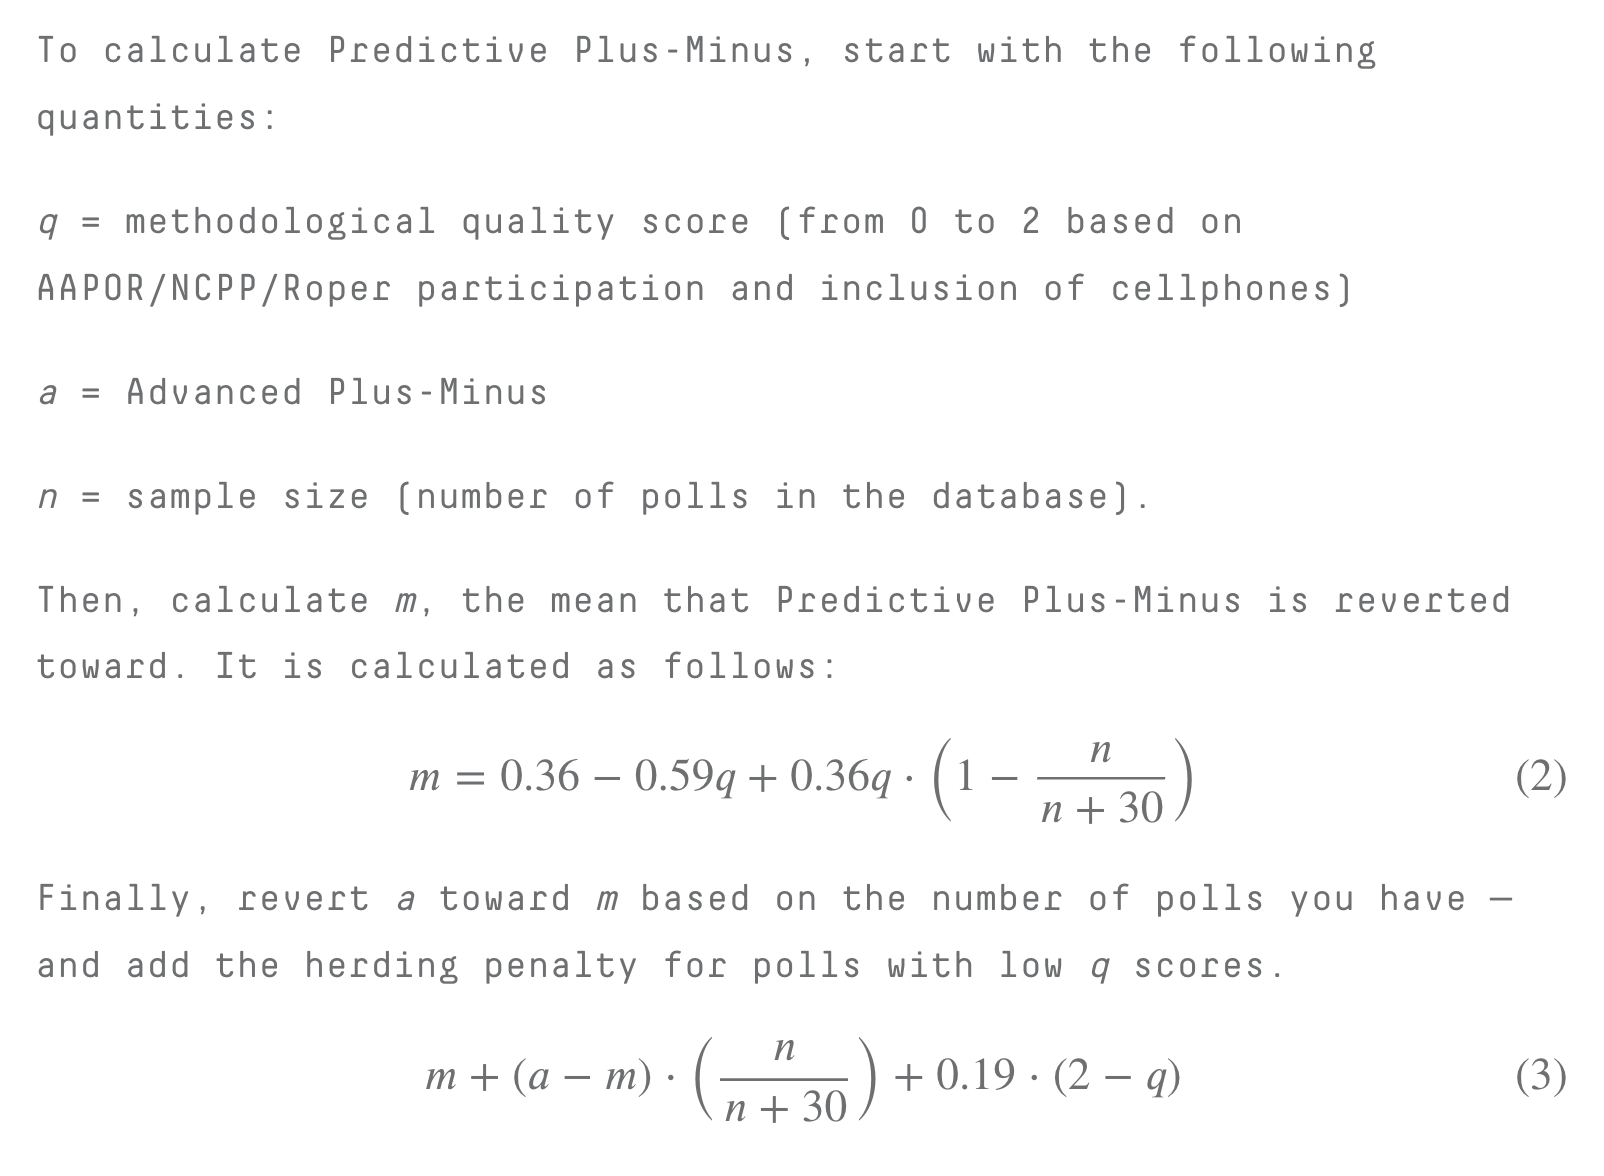
Step 5: Calculate Predictive Plus-Minus
Step 3: Calculate Simple Plus-Minus
Step 4: Calculate Advanced Plus-Minus
Step 5: Calculate Predictive Plus-Minus
Accounts for other markers of quality like methodological standards (NCPP/AAPOR/Roper membership) and whether or not they call cell phones
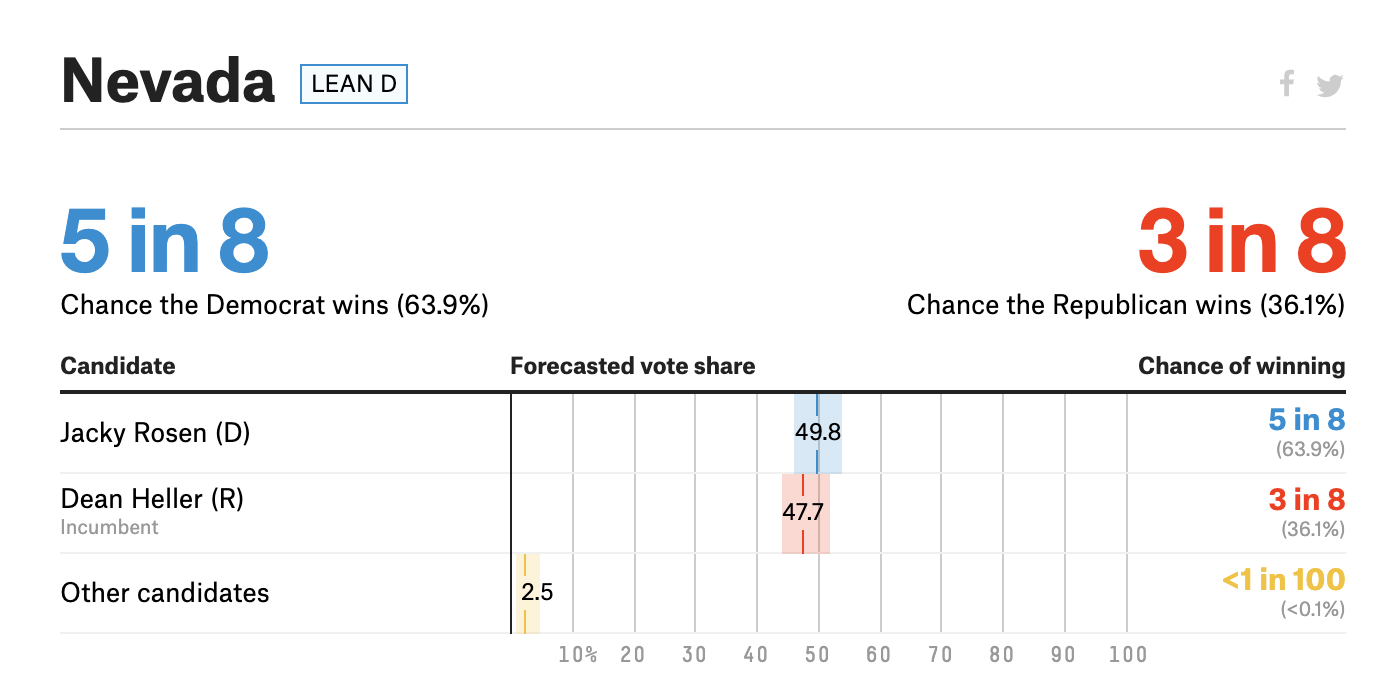
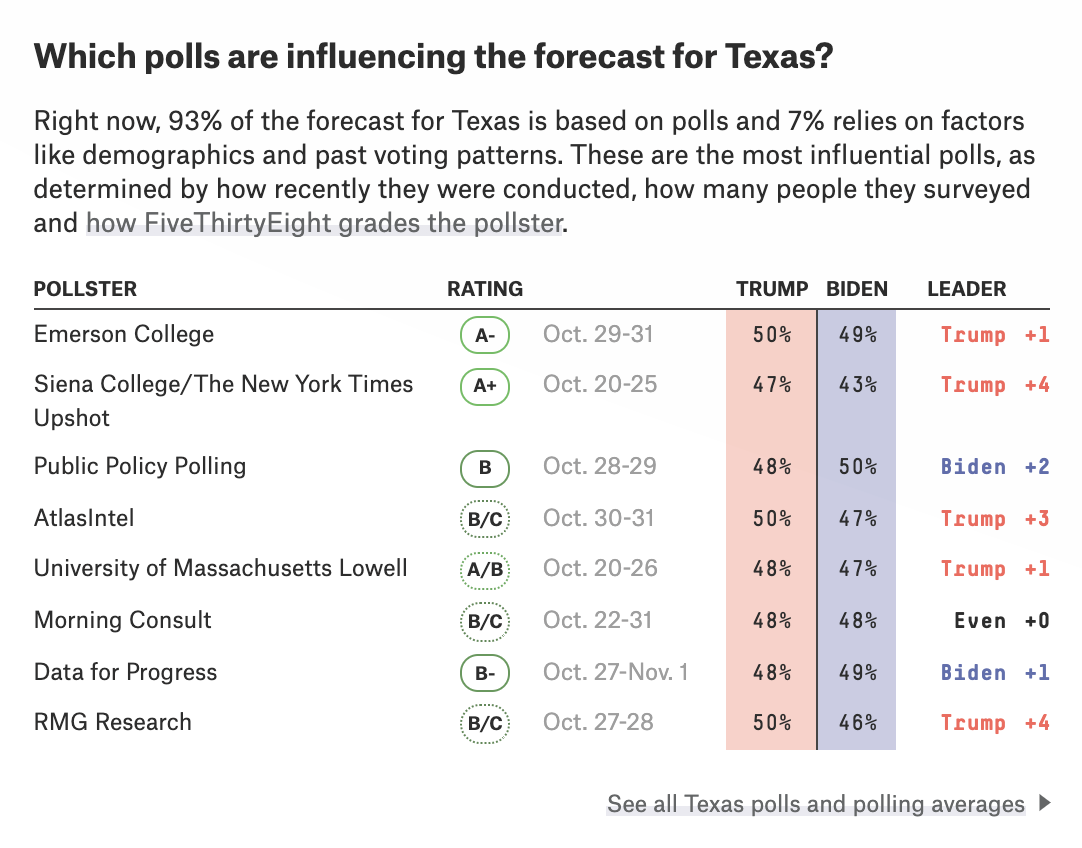
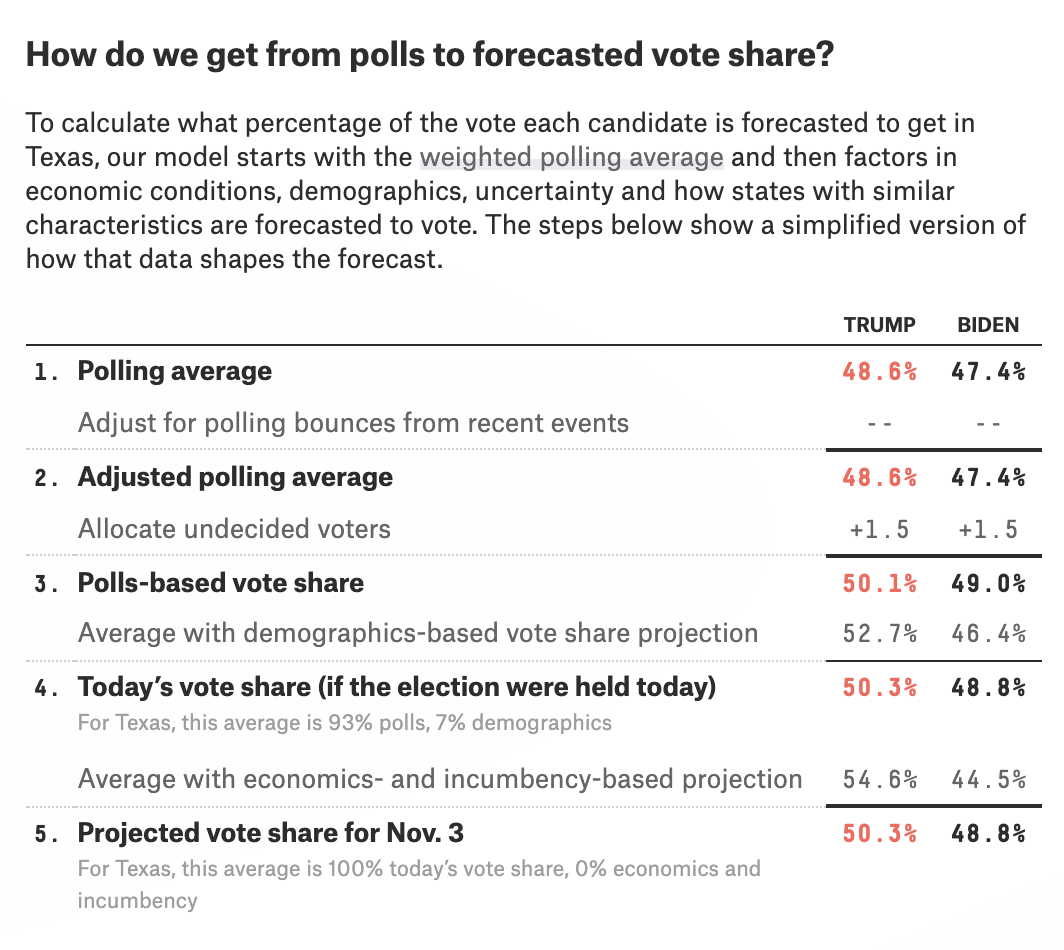
But if the end goal is to know as much as we can about the state of an election, polls don't tell us everything...
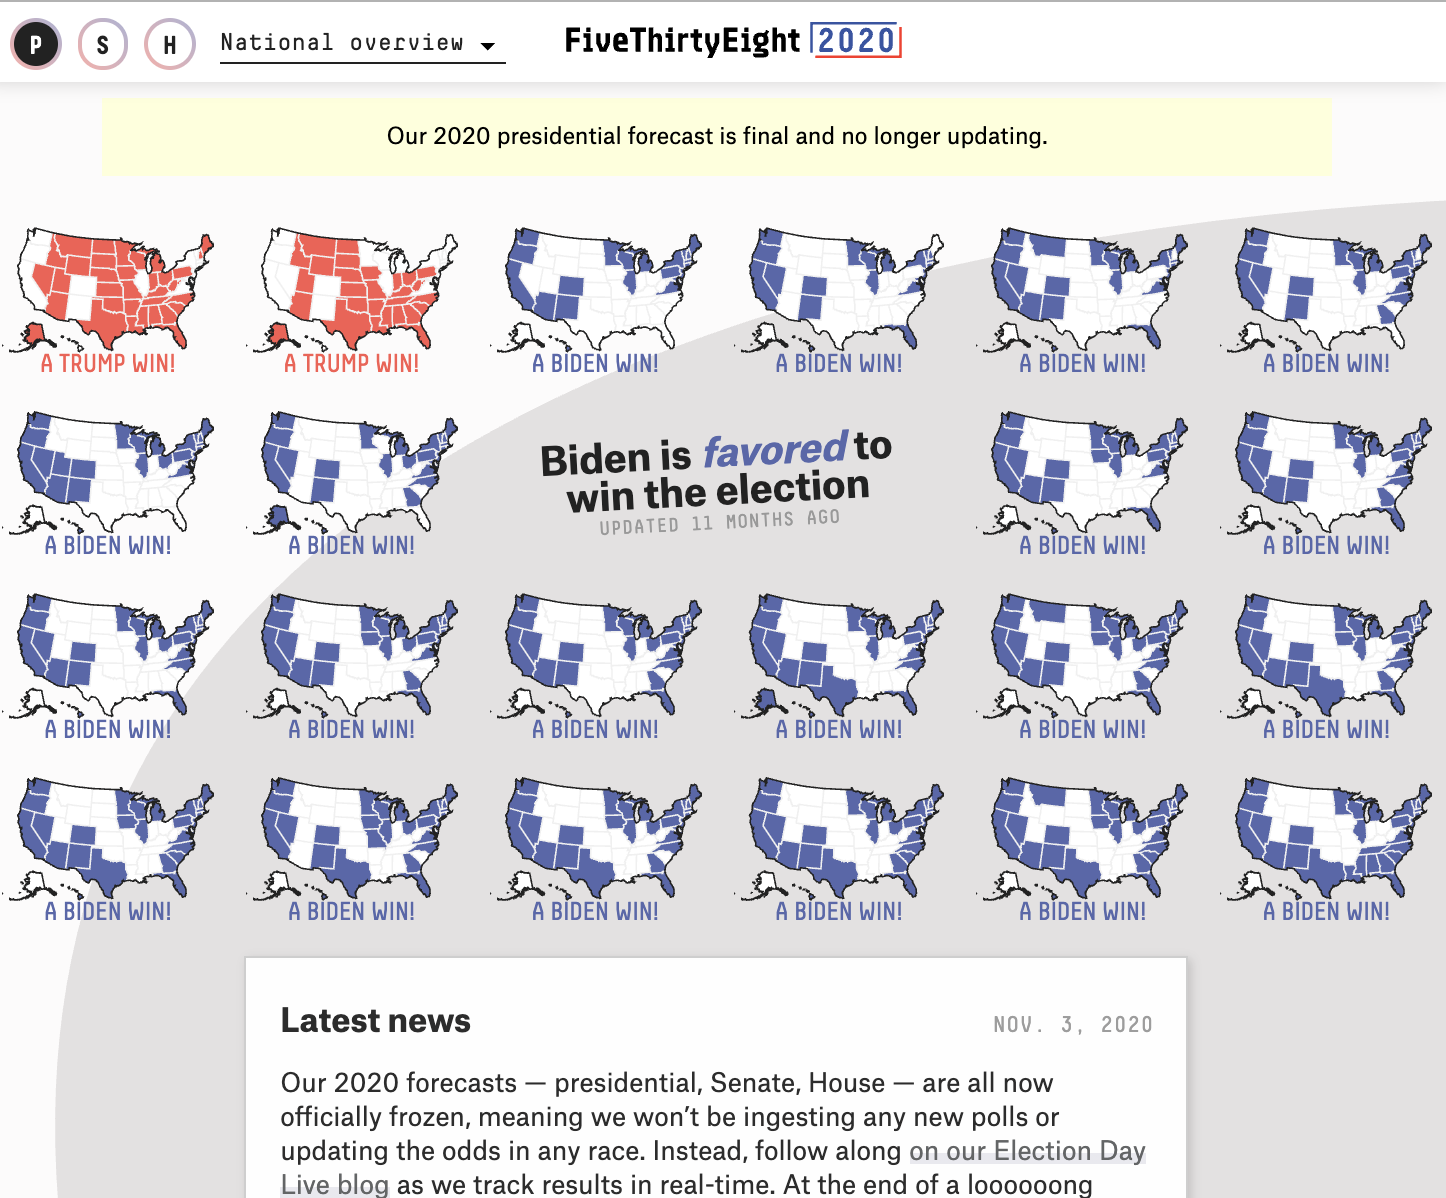
Whether we show the chances in percentages or odds, this is the portion of an election forecast that is most anticipated — and has the most potential to be misunderstood. In 2016, we aimed for simplicity, both visually and conceptually. In 2018, we leaned into the complexity of the forecast. For 2020, we wanted to land somewhere in between.
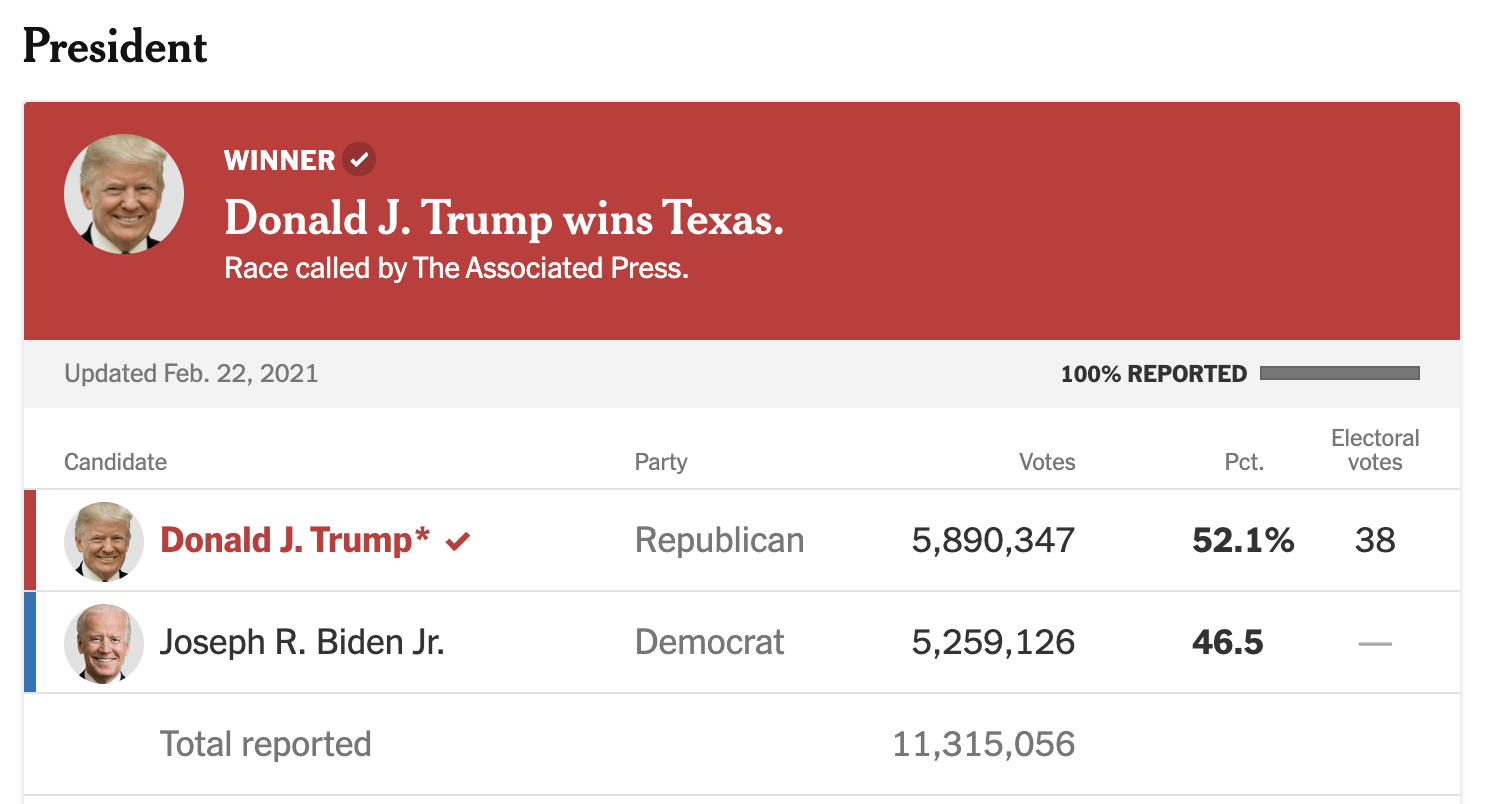
https://fivethirtyeight.com/features/how-fivethirtyeights-2020-forecasts-did-and-what-well-be-thinking-about-for-2022/
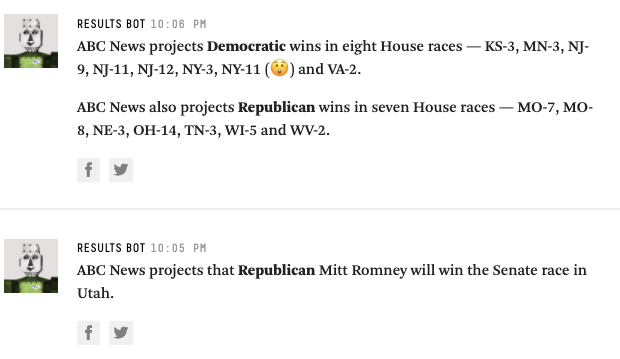
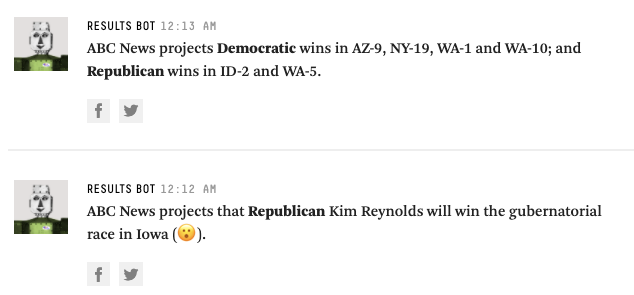
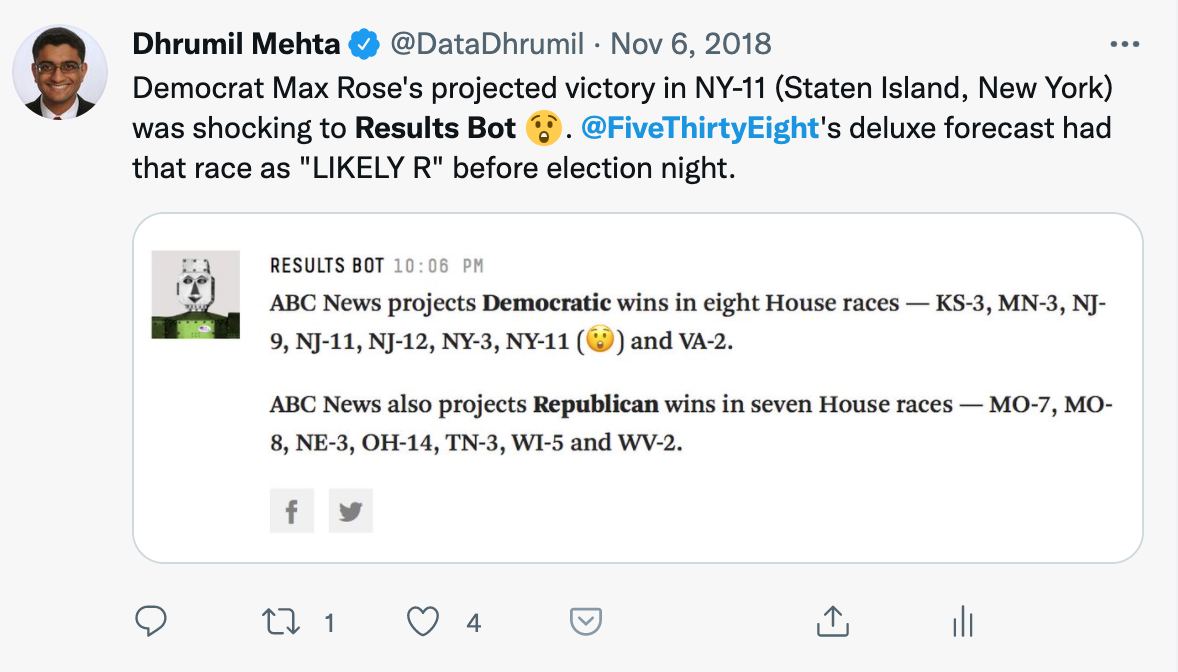
Lets readers see results that FiveThirtyEight deems unexpected
Expectations are calibrated before results ever start coming in.
By Dhrumil Mehta


