

Economic Data Sciences PRO
Understandable A.I.
Understandable Artificial Intelligence
©2018 Economic Data Sciences
EDS was given a sample portfolio. The pension advisor who created it was looking to improve it as they did not have a good strategy to market it
As we have often seen from clients, the list of funds included comprised of a broad range: global equities, U.S. large cap value, international equities etc.
EDS goal was to find a better allocation within the wider client universe to meet the implicit goals this portfolio was attempting to accomplish
©2018 Economic Data Sciences
©2018 Economic Data Sciences
One unique and powerful aspect of our A.I. is the ability to understand preferences. In this example we find that the allocation preferences could best be described as focused on balance
©2018 Economic Data Sciences
Due to our A.I.'s ability to simultaneously compute so many factors at once we are able to compute a Total Factor Sensitivity for a portfolio -- This is unique to our tool
©2018 Economic Data Sciences
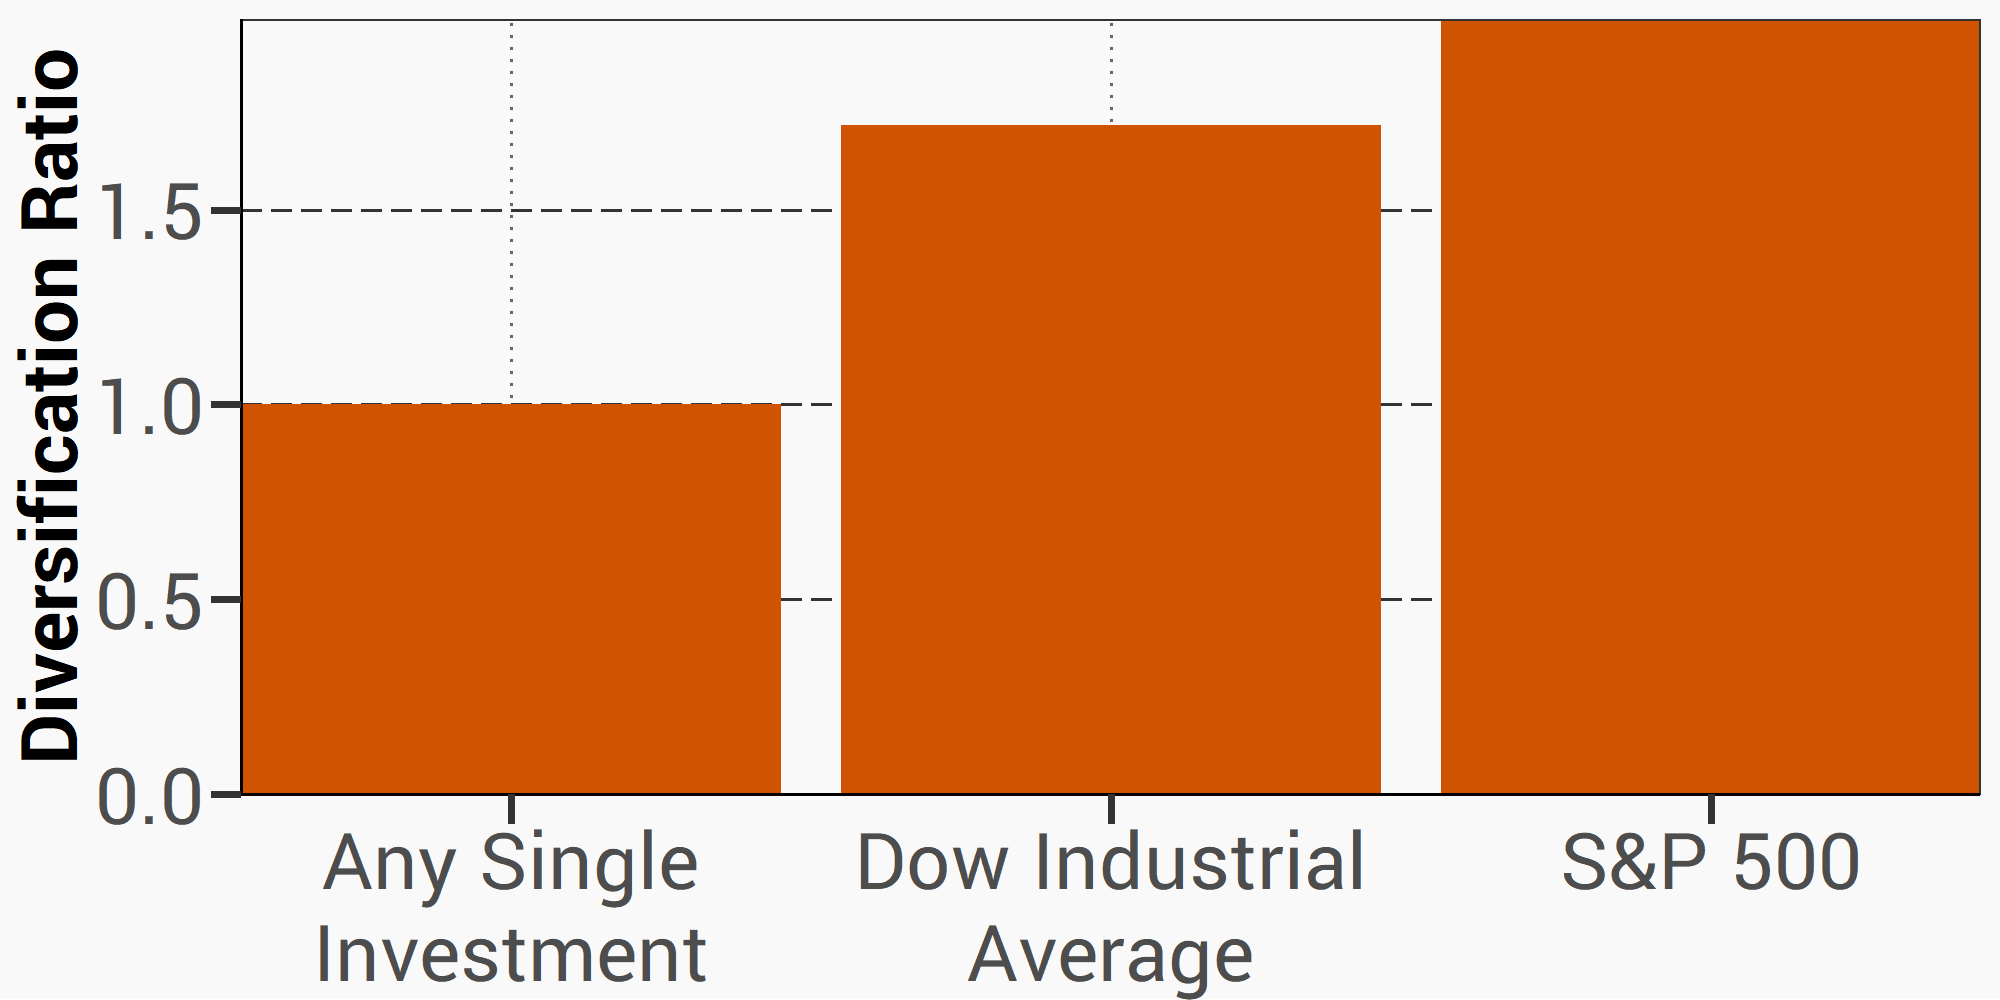
Another common metric for diversification is the Diversification Ratio. Because our A.I. can simultaneously compute so much, it can find the best trade-off in this metric and others.
*Data from EDS & Bloomberg, courtesy of London Business School
Re-allocated, Expanded, Re-defined
©2018 Economic Data Sciences
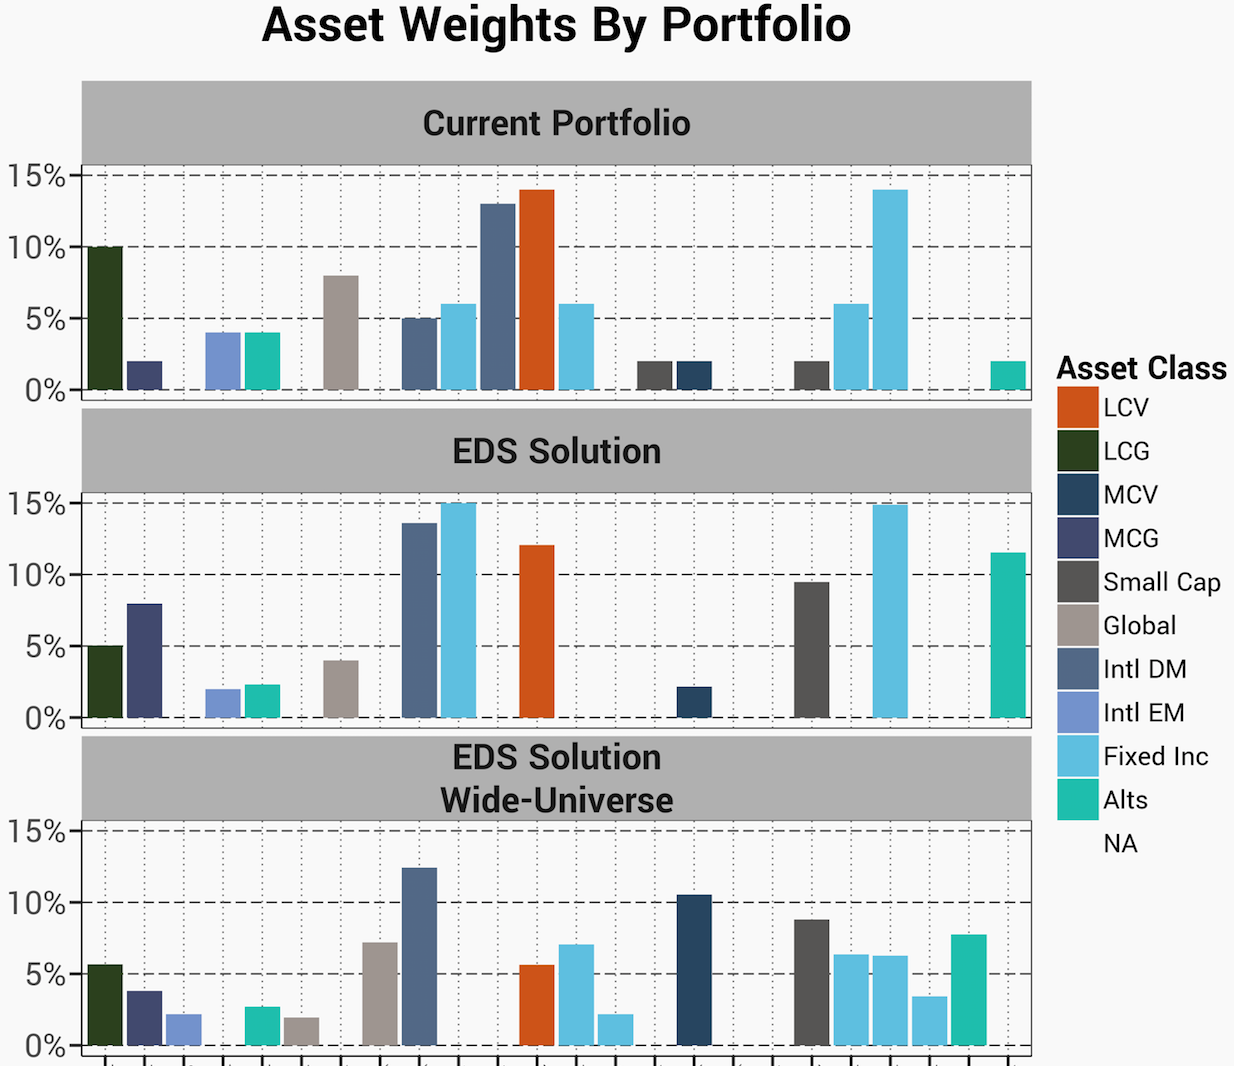
In this first step we use only the funds already included in the portfolio and allow the A.I. to re-allocate based only on its understanding of preferences, we hope this is a better expression
©2018 Economic Data Sciences
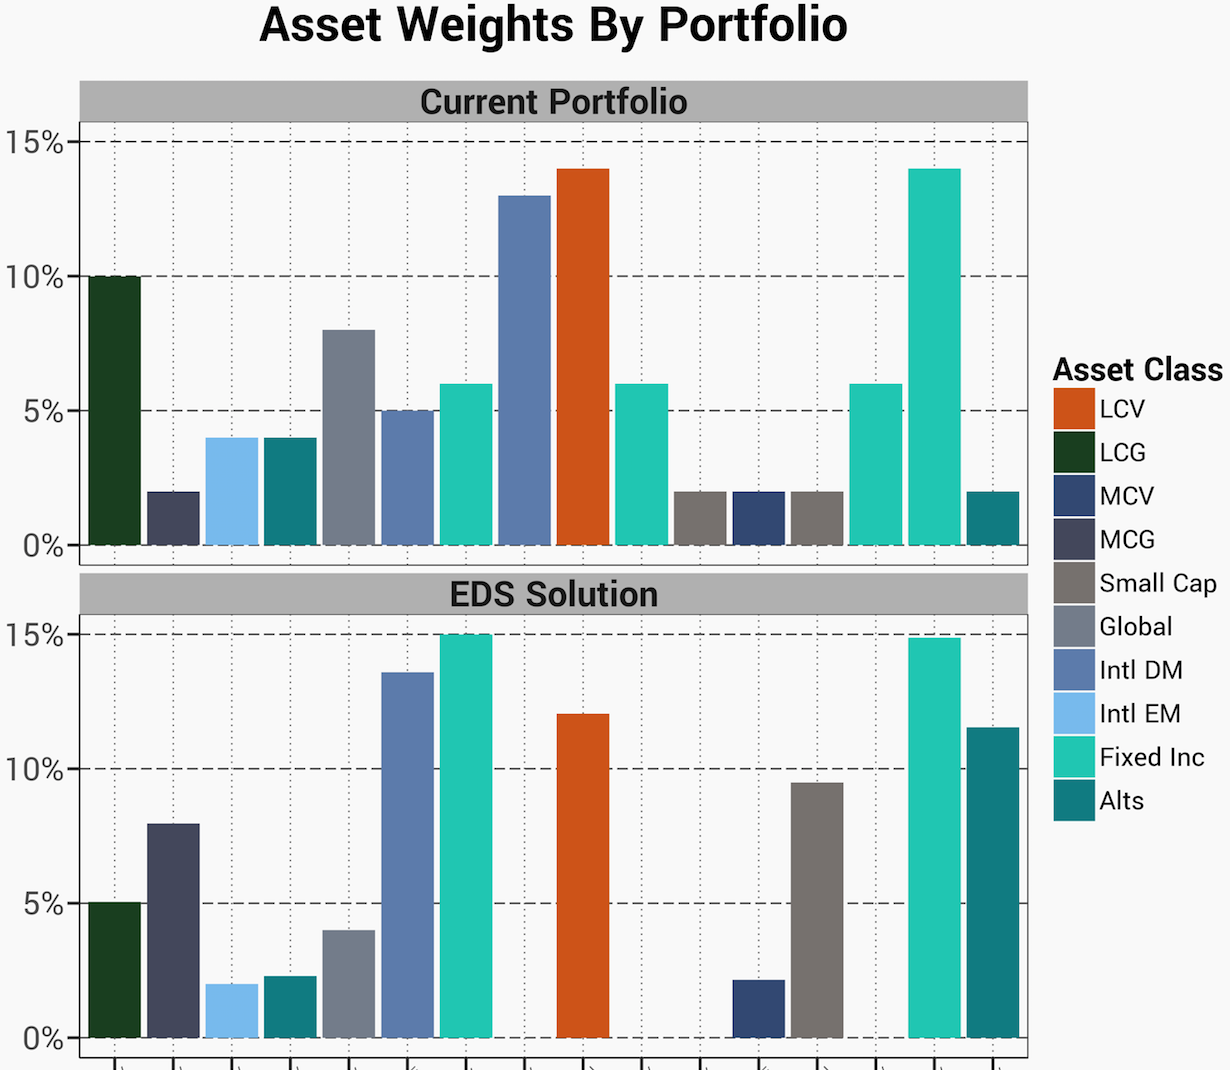
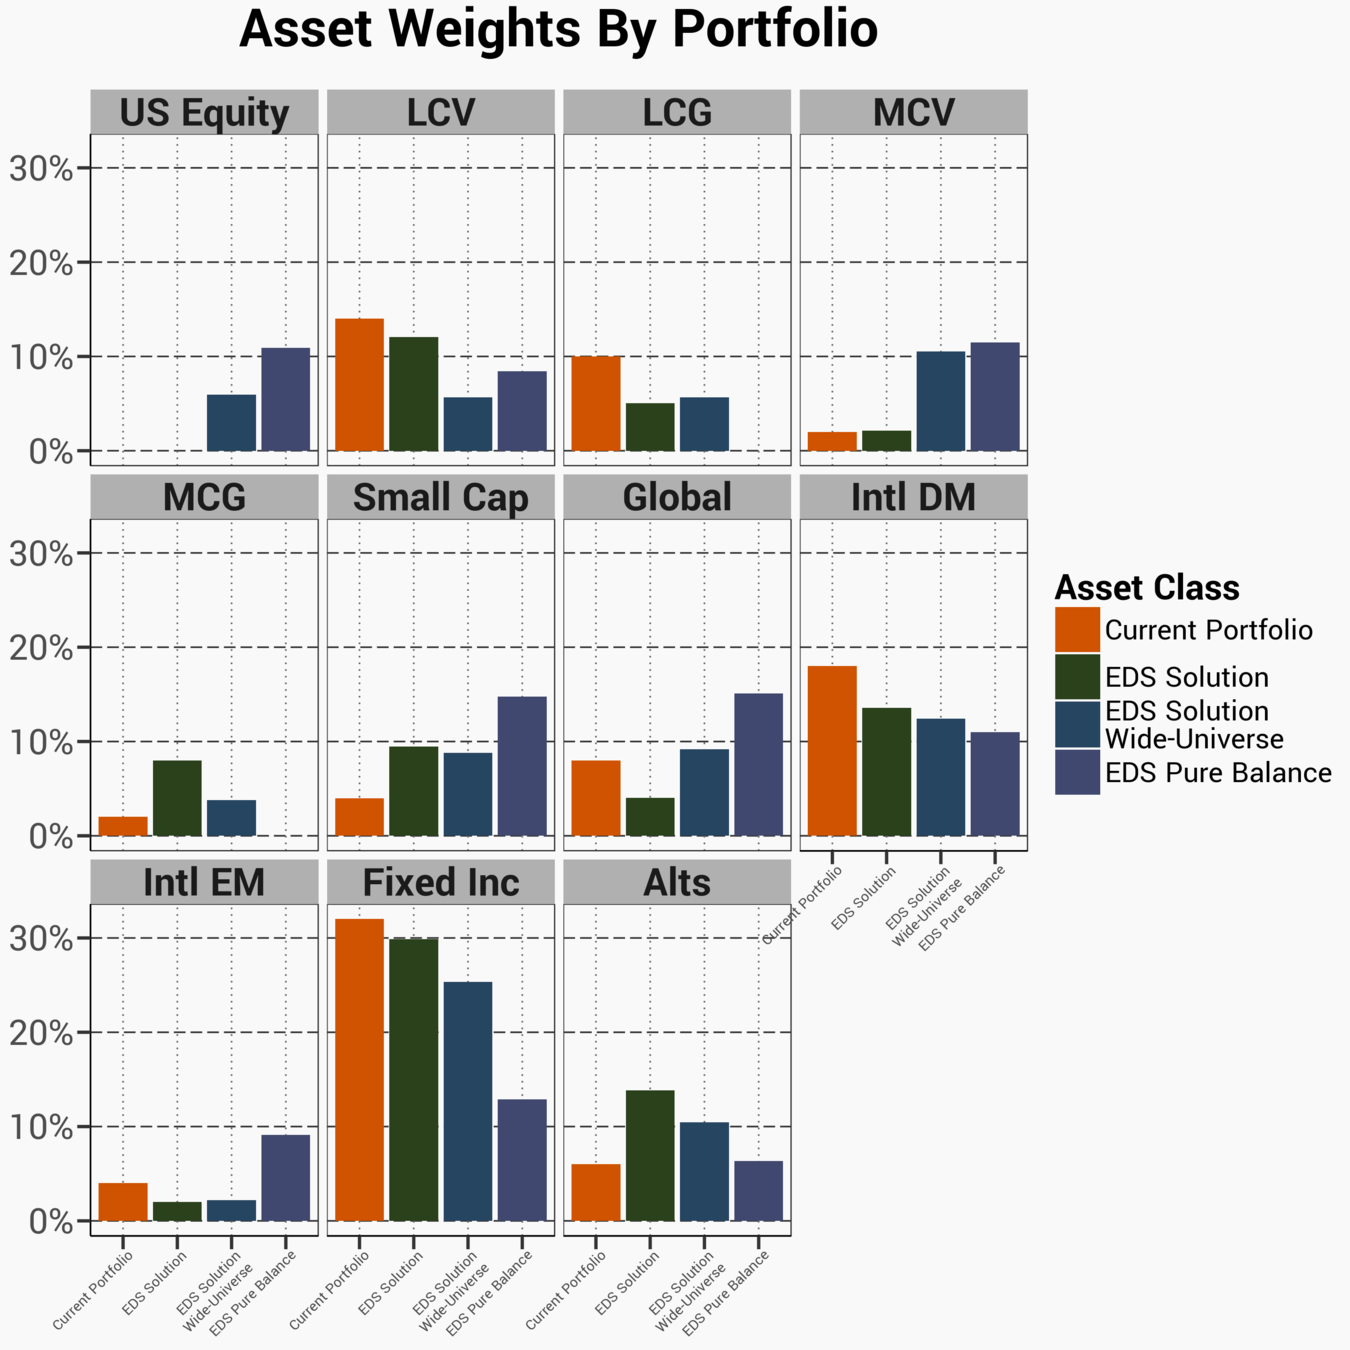
The construction of the original portfolio was likely a 'bucket-by-bucket' approach. We keep this in mind during our analysis
An explanation of the short-hand of each asset class can be found in the back
*Data from EDS, Oppenheimer, & Bloomberg, courtesy of London Business School
©2018 Economic Data Sciences
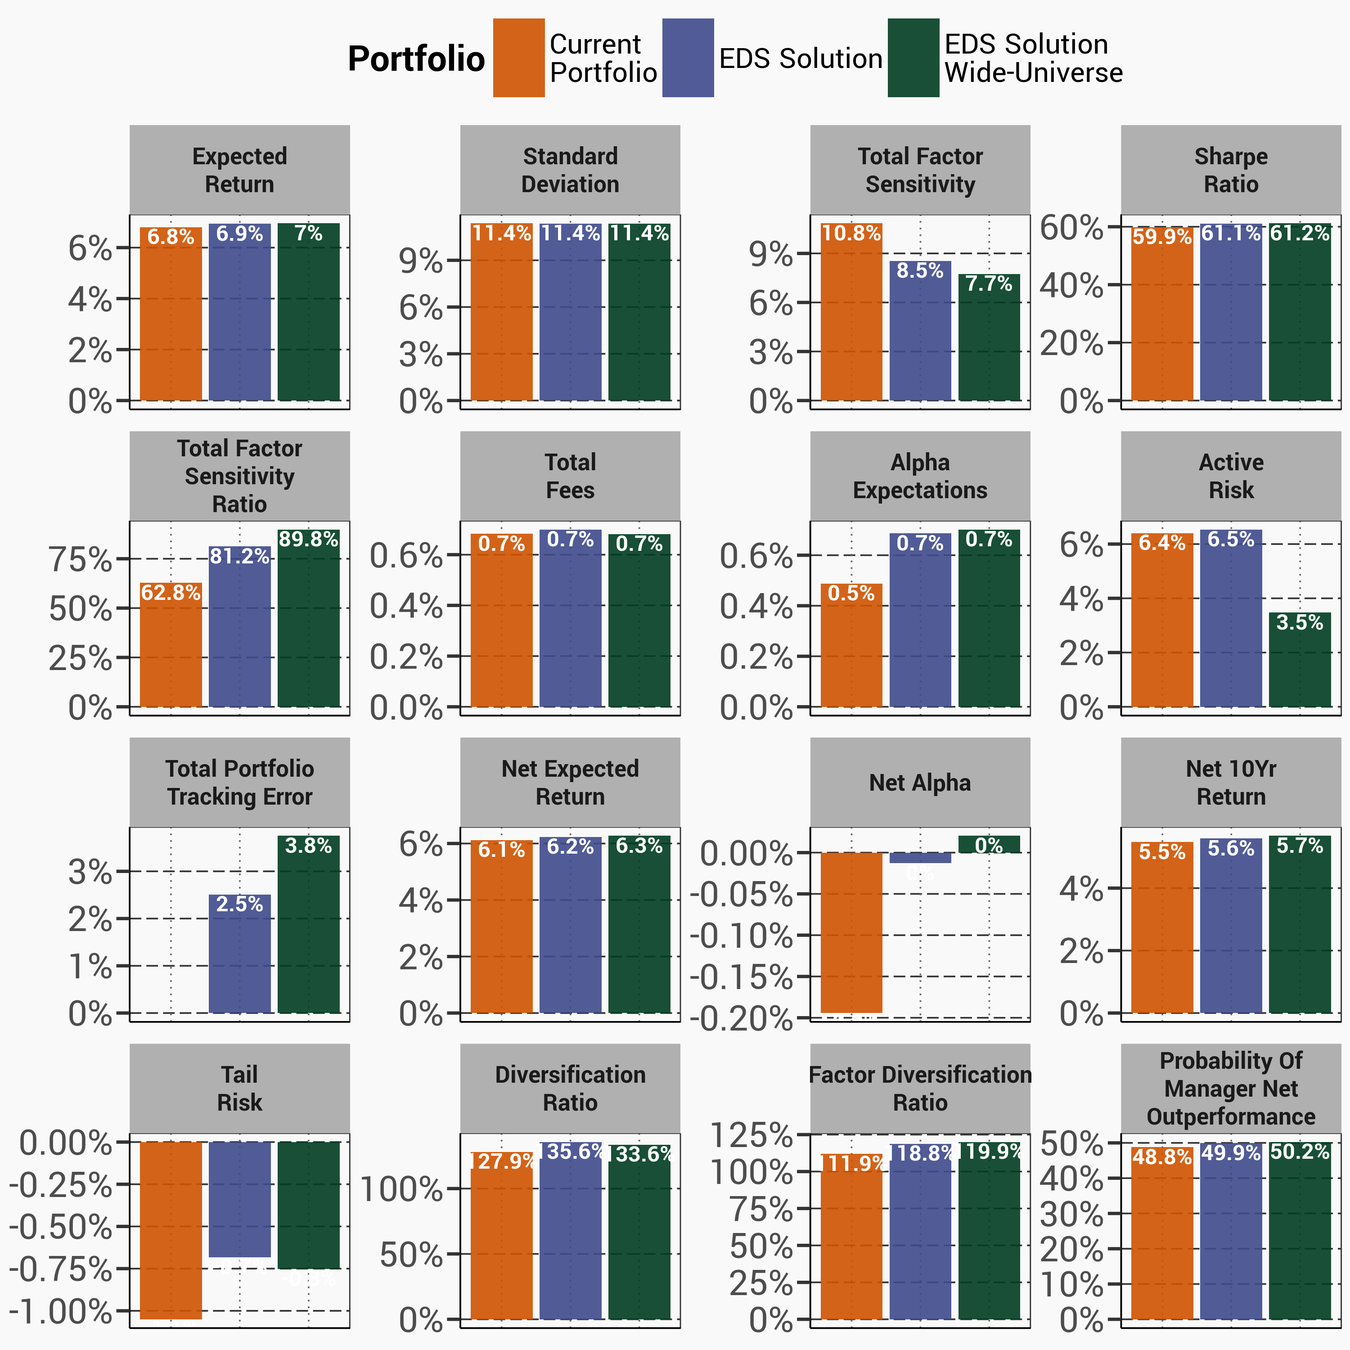
This part of the analysis is trying to answer a simple question: Can further improvements be made if the wider client universe is examined?
©2018 Economic Data Sciences
At this point we feel the A.I. has a good understanding of preferences and seeks to make further improvements by searching the broader client universe of funds
In this example several significant improvements can be found:
©2018 Economic Data Sciences
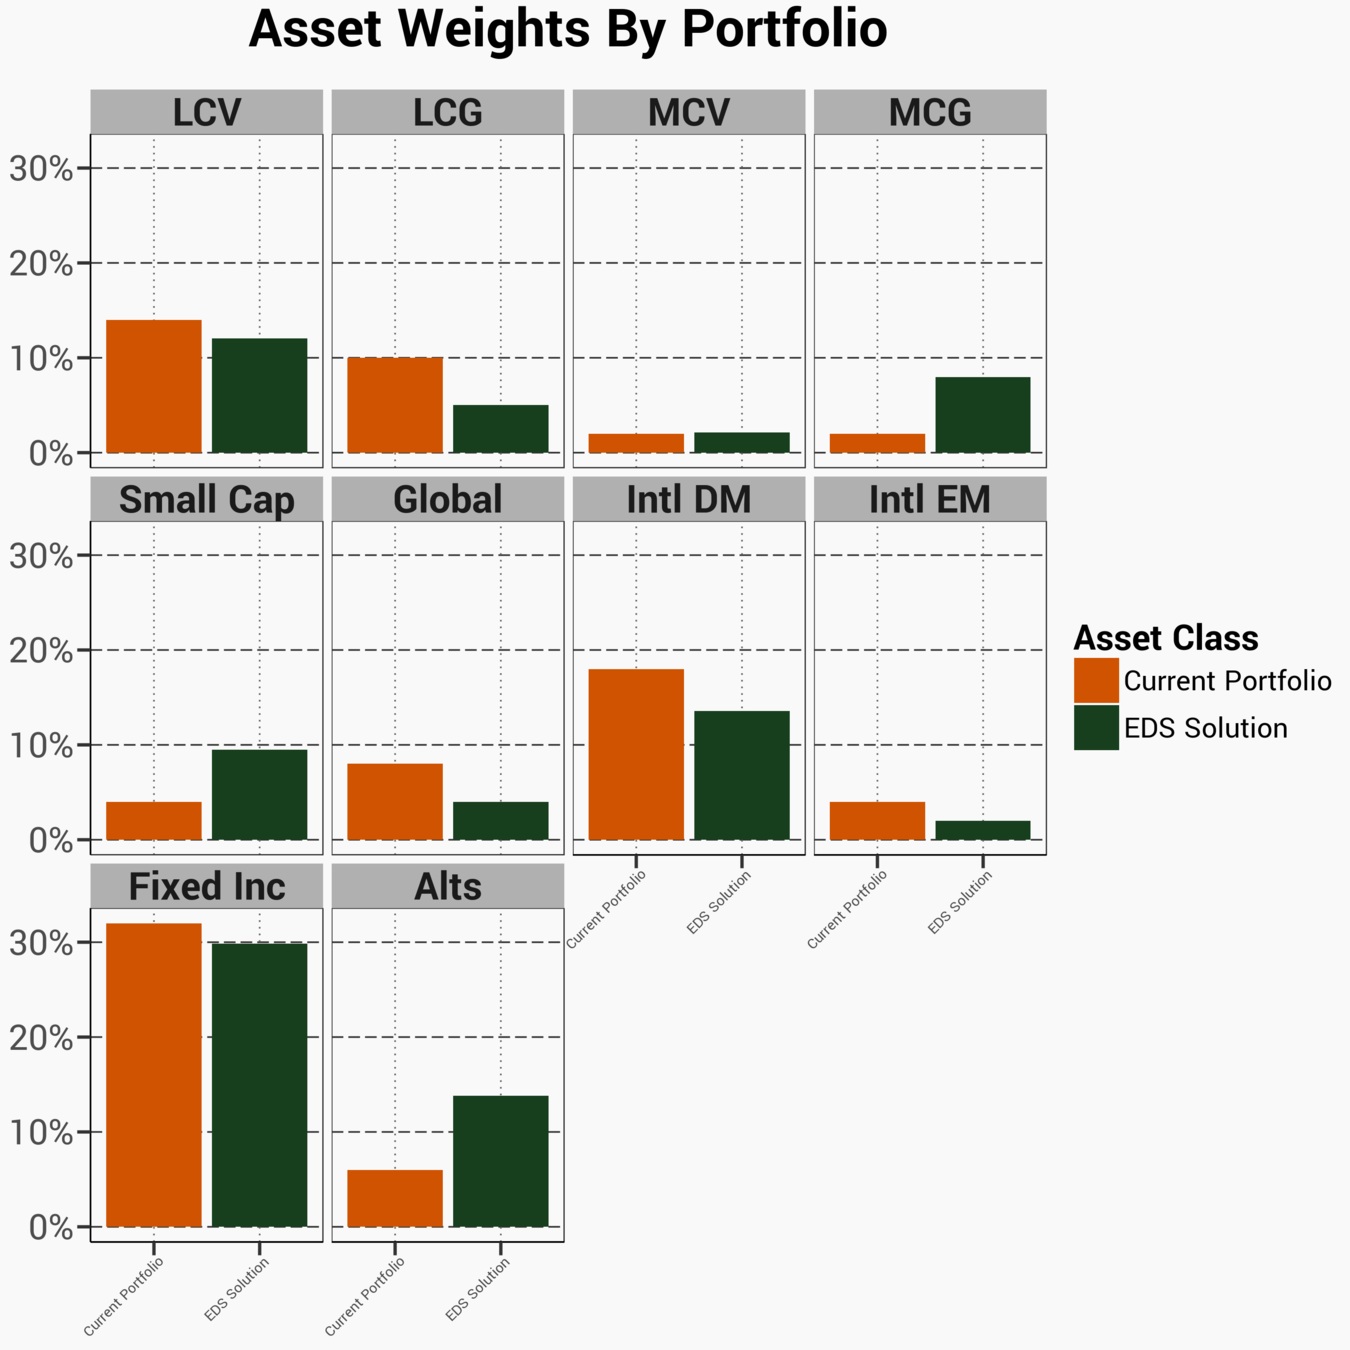
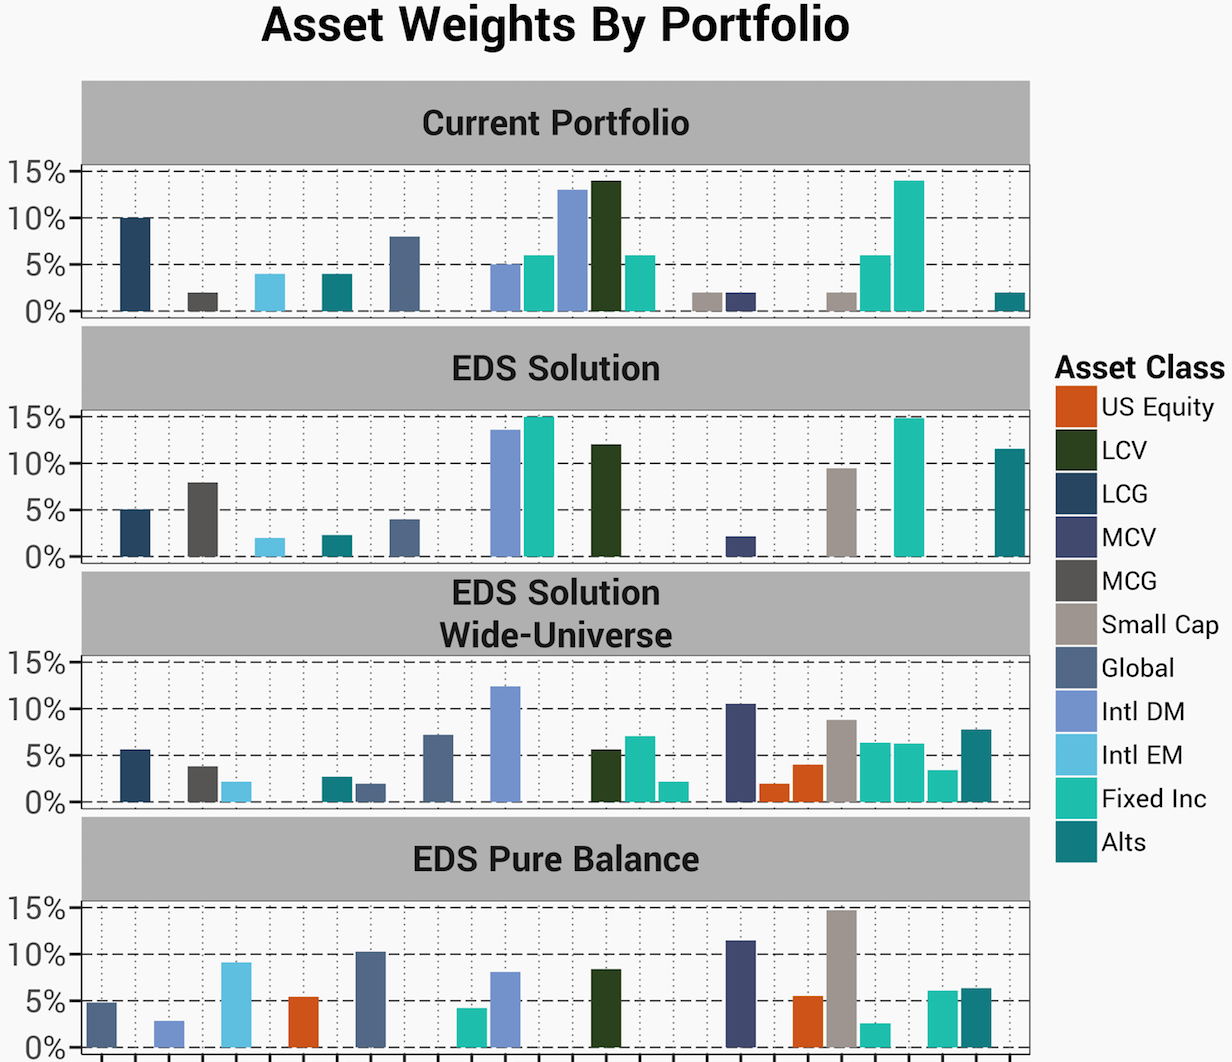
In this example we keep the overall bucket weights fairly similar but search through a wider set of client funds
*Data from EDS, Oppenhiemer, & Bloomberg, courtesy of London Business School
©2018 Economic Data Sciences
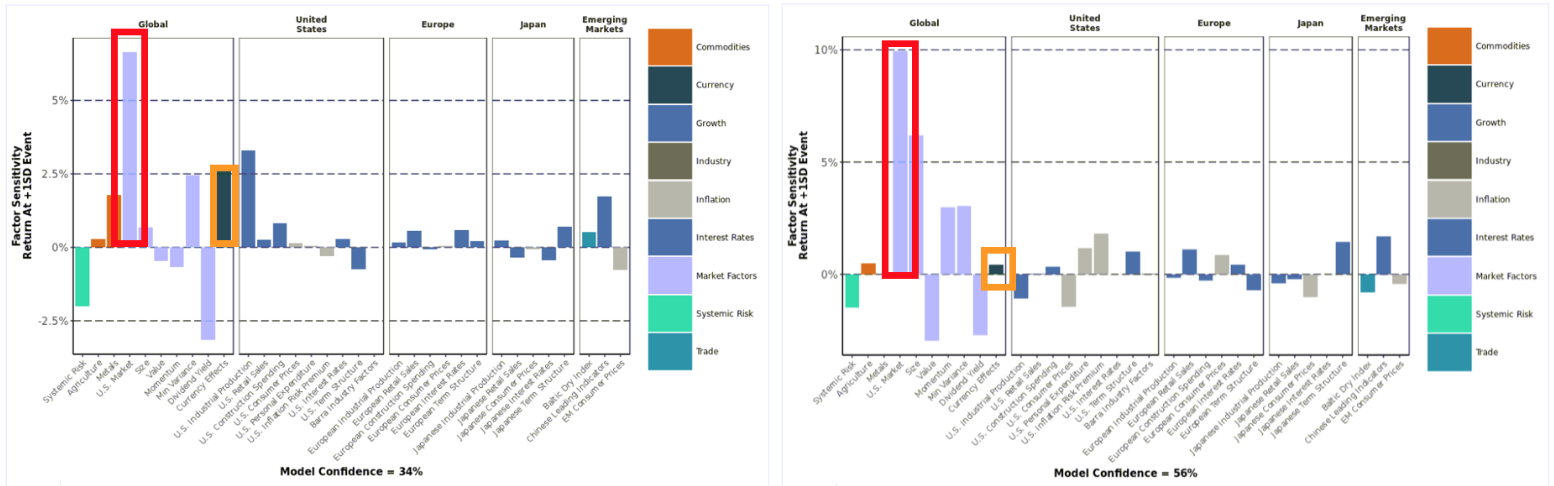
Simultaneous evaluation leads to a better/deeper perspective of the factors that drive returns. When allocating the A.I. suggests funds that deliver factor exposure efficient and won't erode other factor exposures across the portfolio
*Data from EDS & Bloomberg, courtesy of London Business School
©2018 Economic Data Sciences
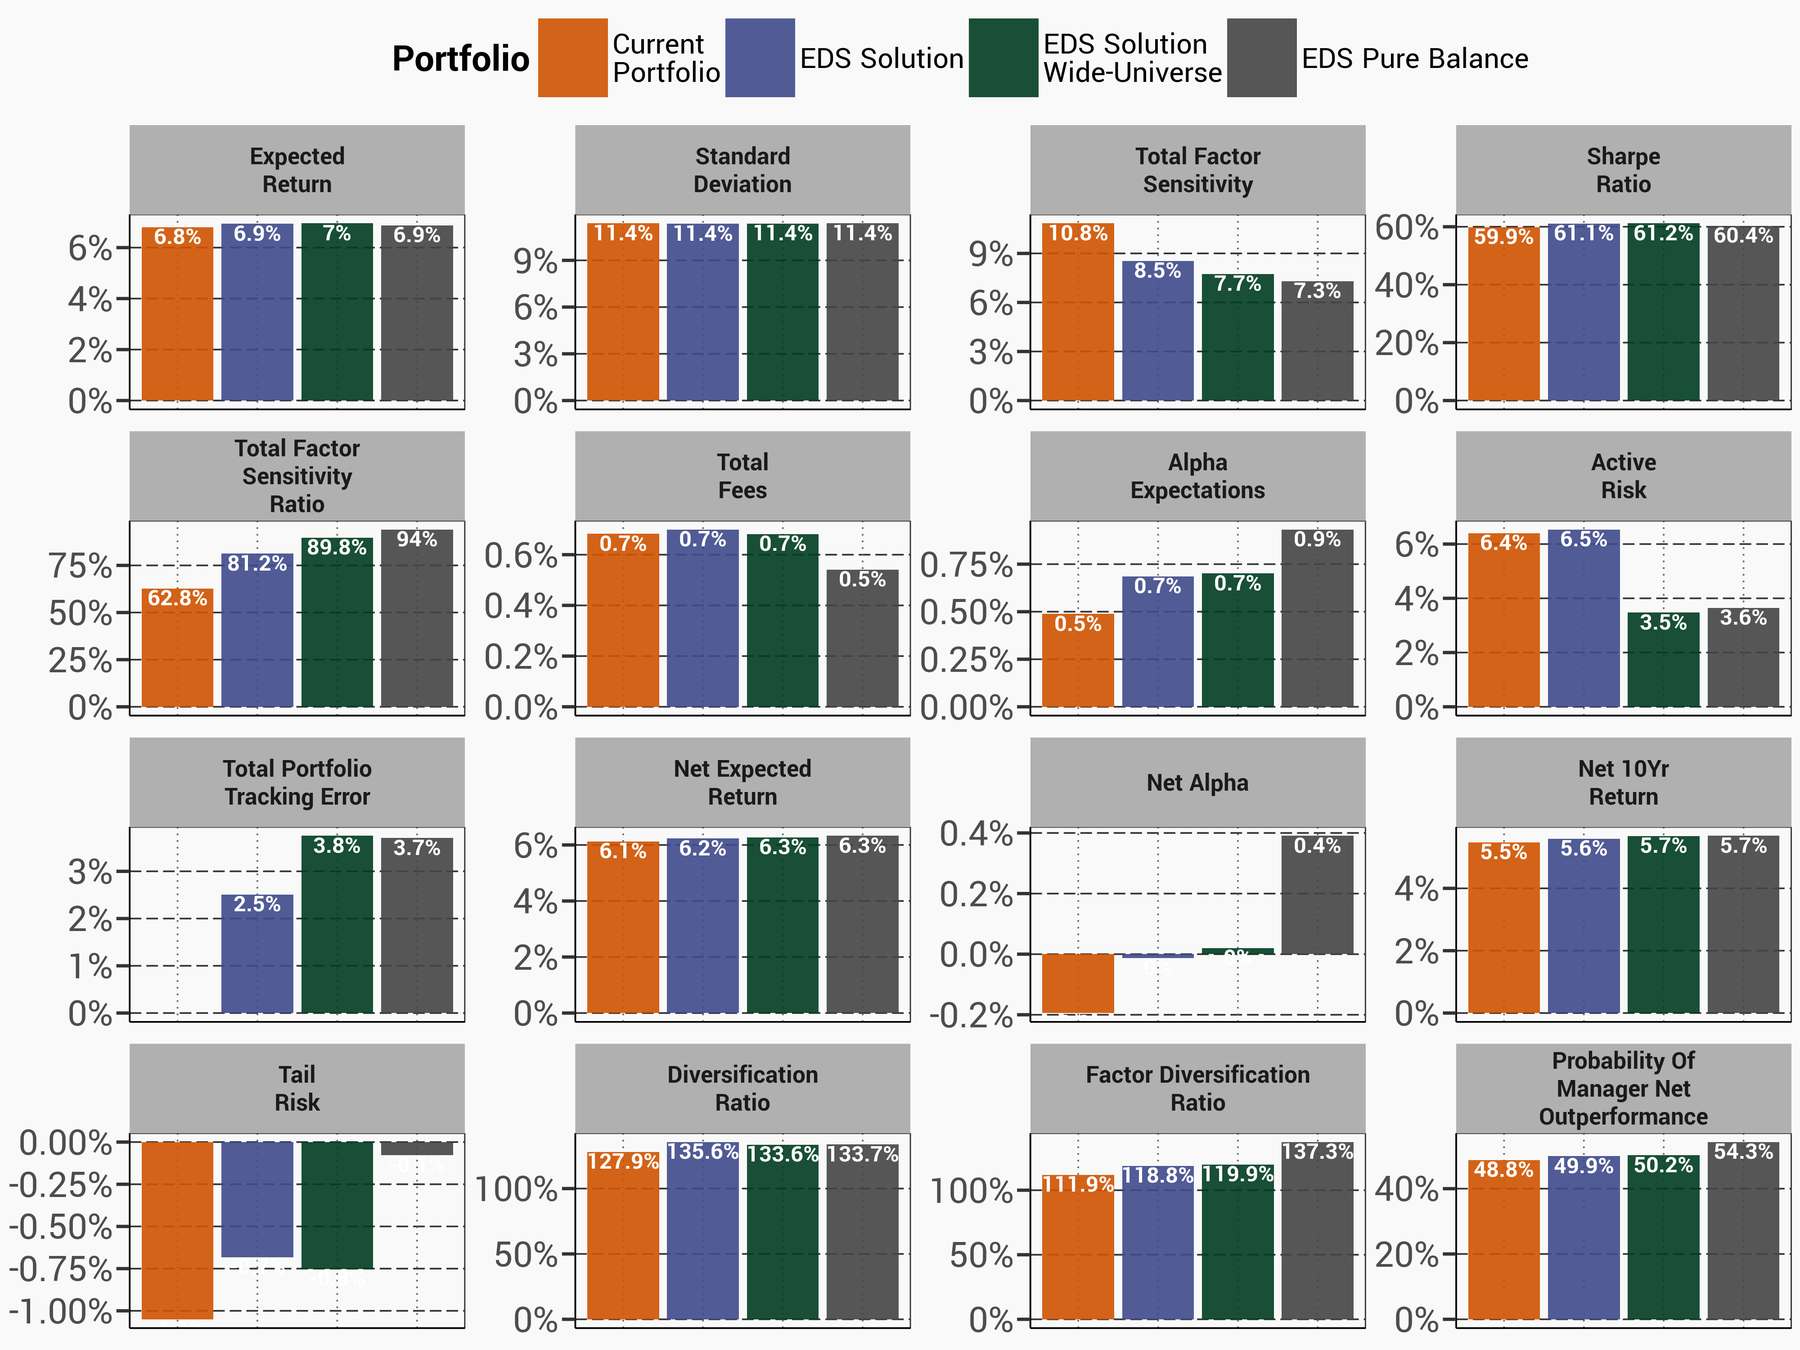
In this example we allow the A.I. to purely express our preferences without regard to the traditional buckets which contain overlap of factor exposure leading to sub-optimal outcomes
©2018 Economic Data Sciences
Removing the constraints improves the desired goal, using conservative forward- looking estimates
©2018 Economic Data Sciences
'Pure Balance' is an attempt to purely implement invesment preferences
©2018 Economic Data Sciences
This holistic approach removes overlap that erodes efficiency and makes decisions without bias
*Data from EDS, Oppenheimer, & Bloomberg, courtesy of London Business School
©2018 Economic Data Sciences
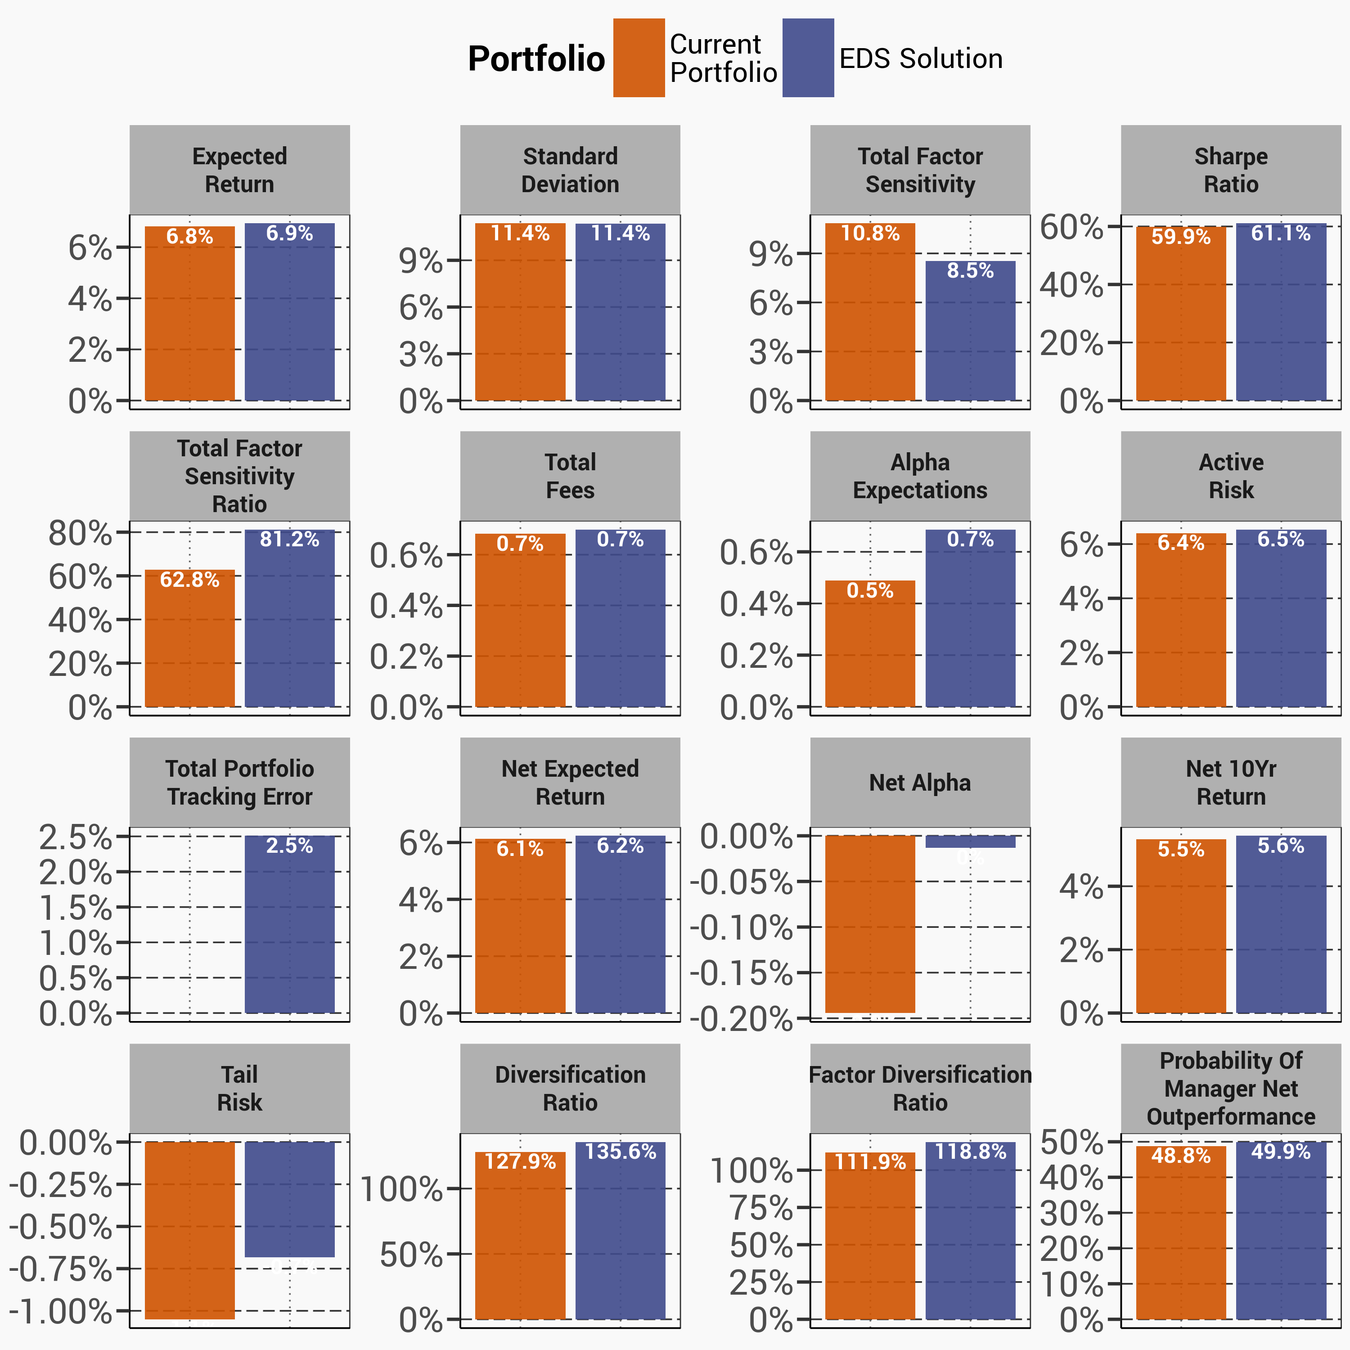
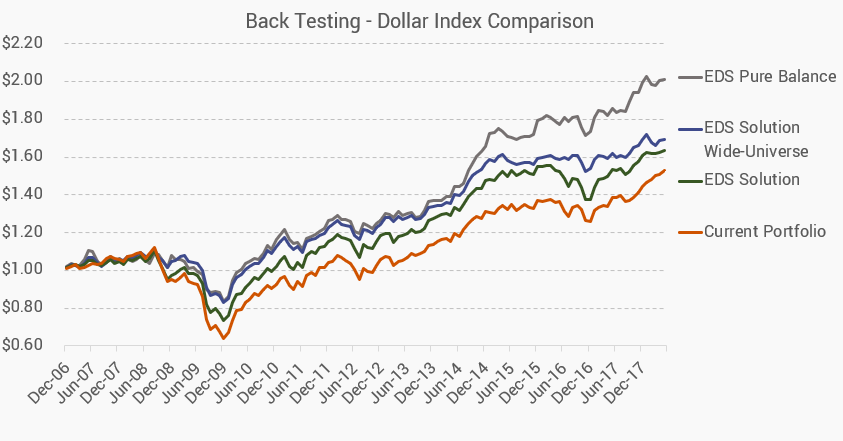
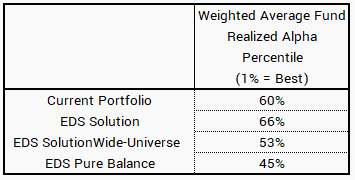
All of our estimates thus far were forward -looking, however it is often informative to test the solution in history
*Data from EDS & Bloomberg, courtesy of London Business School
©2018 Economic Data Sciences
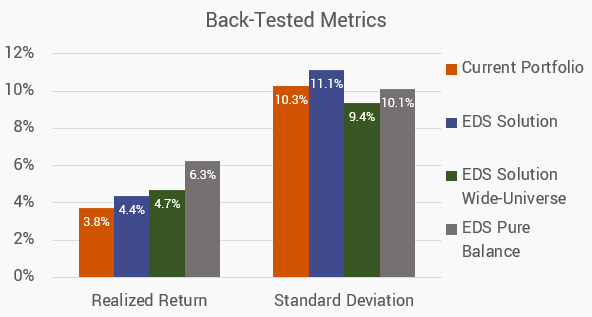
The metrics from this test show a significant realized historical improvement. Beyond just performance we also see that the managers/funds selected beat their benchmarks more often
©2018 Economic Data Sciences
Using our A.I. tool to enhance your existing methods can lead to significant improvements not just in performance but other important metrics like diversification and alpha. Furthermore, we believe the marketing advantages of an A.I. approach are also a positive in today's environment
©2018 Economic Data Sciences
©2018 Economic Data Sciences
Please remember that past performance may not be indicative of future results. Different types of investments involve varying degrees of risk, and there can be no assurance that the future performance of any specific investment, investment strategy, or product made reference to directly or indirectly in this presentation, will be profitable, equal any corresponding indicated historical performance level(s), or be suitable for an individual's portfolio.
Our projections are based on current market conditions which can vary over the coming months and weeks. Additionally, our projections are based on historical market behavior which may vary unexpectedly. Using Machine Learning, our tool should adjust to new market fluctuations but we might not be able to avoid short term volatility.
©2018 Economic Data Sciences
info@EconomicDataSciences.com
info@EconomicDataSciences.com
By Economic Data Sciences


