AOE 5984: Introduction to Parallel Computing Applications


OpenFOAM for CFD Applications

Lecture 3:  Data Analysis and Visualization


Professor Eric Paterson
Aerospace and Ocean Engineering, Virginia Tech
19 November 2013

Topics briefly discussed in Lecture 2

  • Introduction to OpenFOAM data analysis tools
  • Showed dictionary entries used by the sample utility for extracting sets and surfaces data from 4D fields
  • Showed example of plotting X-Y data (sets) with python+matplotlib
  • Showed example of visualizing surfaces rather than loading entire datasets
  • Emphasized  that data reconstruction should be avoided

Lecture 3:  Data Analysis & Visualization

  • Objectives
    • Highlight the difference between data analysis and visualization of OpenFOAM data
    • Discuss utilities and post-processing software for data analysis and visualization
  • Outcomes
    • Students will:
      • appreciate the importance of working with decomposed and remote data
      • understand that there are numerous OpenFOAM utilities for operating on data and computing derived data
      • learn about the power of using python and pyFoam
      • understand that client-server visualization is important for reducing data transfer and duplication 

    Data Analysis vs. Visualization

    • Data Analysis
      • Quantitative
      • Primary and derived variables
      • Integral variables, e.g., lift, drag, mass-flow rate
      • X-Y plots
      • Extraction of comparison metrics for verification and validation
    • Visualization
      • Qualitative
      • Primary and derived variables
      • Contour maps, streamlines, iso-surfaces, etc.
      • Animations

    OpenFOAM utilities

    • OpenFOAM has numerous pre-compiled post-processing utilities, which can be found in $FOAM_UTILITIES/postProcessing
    • Description of each can be found online at:  http://www.openfoam.org/docs/user/standard-utilities.php
    • Many of the utilities perform vector and tensor operations to compute derived variables, e.g., vorticity, Q, lambda2, shearStress, etc.

    velocityField postProcessing tools

    Post-processing velocity fields


    Co

    Calculates and writes the Courant number obtained from field phi as avolScalarField.

    enstrophy

    Calculates and writes the enstrophy of the velocity field U

    flowType

    Calculates and writes the flowType of velocity field U

    Lambda2

    Calculates and writes the second largest eigenvalue of the sum of the square of the symmetrical and anti-symmetrical parts of the velocity gradient tensor

    Mach

    Calculates and optionally writes the local Mach number from the velocity field U at each time

    Pe

    Calculates and writes the Pe number as a surfaceScalarField obtained from field phi

    Q

    Calculates and writes the second invariant of the velocity gradient tensor

    streamFunction

    Calculates and writes the stream function of velocity field U at each time

    uprime

    Calculates and writes the scalar field of uprime (∘ -----
  2k ∕3  \relax \special {t4ht=)

    vorticity

    Calculates and writes the vorticity of velocity field U

    Example:  Calculation of vorticity

    postProcessing/velocityField/vorticity/vorticity.C


        IOobject Uheader
        (
            "U",
            runTime.timeName(),
            mesh,
            IOobject::MUST_READ
        );
    
        if (Uheader.headerOk())
        {
            Info<< "    Reading U" << endl;
            volVectorField U(Uheader, mesh);
    
            Info<< "    Calculating vorticity" << endl;
            volVectorField vorticity
            (
                IOobject
                (
                    "vorticity",
                    runTime.timeName(),
                    mesh,
                    IOobject::NO_READ
                ),
                fvc::curl(U)
            );
    
            volScalarField magVorticity
            (
                IOobject
                (
                    "magVorticity",
                    runTime.timeName(),
                    mesh,
                    IOobject::NO_READ
                ),
                mag(vorticity)
            );
    
            Info<< "vorticity max/min : "
                << max(magVorticity).value() << " "
                << min(magVorticity).value() << endl;
    
            if (writeResults)
            {
                vorticity.write();
                magVorticity.write();
            }
        }
        else
        {
            Info<< "    No U" << endl;
        } 
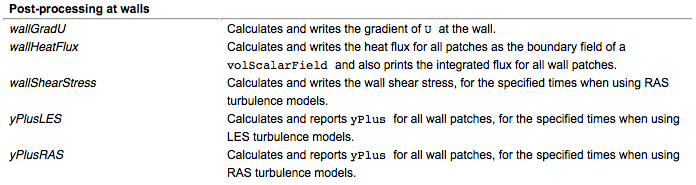
    wall postProcessing tools

    Example:  calculation of 

    wallShearStress

    void calcIncompressible
    (
        const fvMesh& mesh,
        const Time& runTime,
        const volVectorField& U,
        volVectorField& wallShearStress
    )
    {
        #include "createPhi.H"
    
        singlePhaseTransportModel laminarTransport(U, phi);
    
        autoPtr<:rasmodel> model
        (
            incompressible::RASModel::New(U, phi, laminarTransport)
        );
    
        const volSymmTensorField Reff(model->devReff());
    
        forAll(wallShearStress.boundaryField(), patchI)
        {
            wallShearStress.boundaryField()[patchI] =
            (
               -mesh.Sf().boundaryField()[patchI]
               /mesh.magSf().boundaryField()[patchI]
            ) & Reff.boundaryField()[patchI];
        }
    } 

    where is the function devReff?

    Example:  kEpsilon.C


    tmp kEpsilon::devReff() const
    {
        return tmp
        (
            new volSymmTensorField
            (
                IOobject
                (
                    "devRhoReff",
                    runTime_.timeName(),
                    mesh_,
                    IOobject::NO_READ,
                    IOobject::NO_WRITE
                ),
               -nuEff()*dev(twoSymm(fvc::grad(U_)))
            )
        );
    } 

    python

    pyFoam

    pyFoam

    • This Python-library can be used to
      • analyze the logs produced by OpenFoam-solvers
      • execute OpenFoam-solvers and utilities and analyze their output simultaneously
      • manipulate the parameter files and the initial-conditions of a run in a non-destructive manner
      • plots the residuals of OpenFOAM solvers
    • Written by Bernhard Gschaider 

    pyFoam example

    Visualization

    • There are many very good visualization software packages
      • Paraview - free
      • Tecplot - Virginia Tech site license
      • Fieldview
      • Ensight
    • All of these packages natively read OpenFOAM data, plus numerous other formats
    • Making useful images requires experience and an eye for esthetics and art:   beware of chartjunk and colorful fluid dynamics

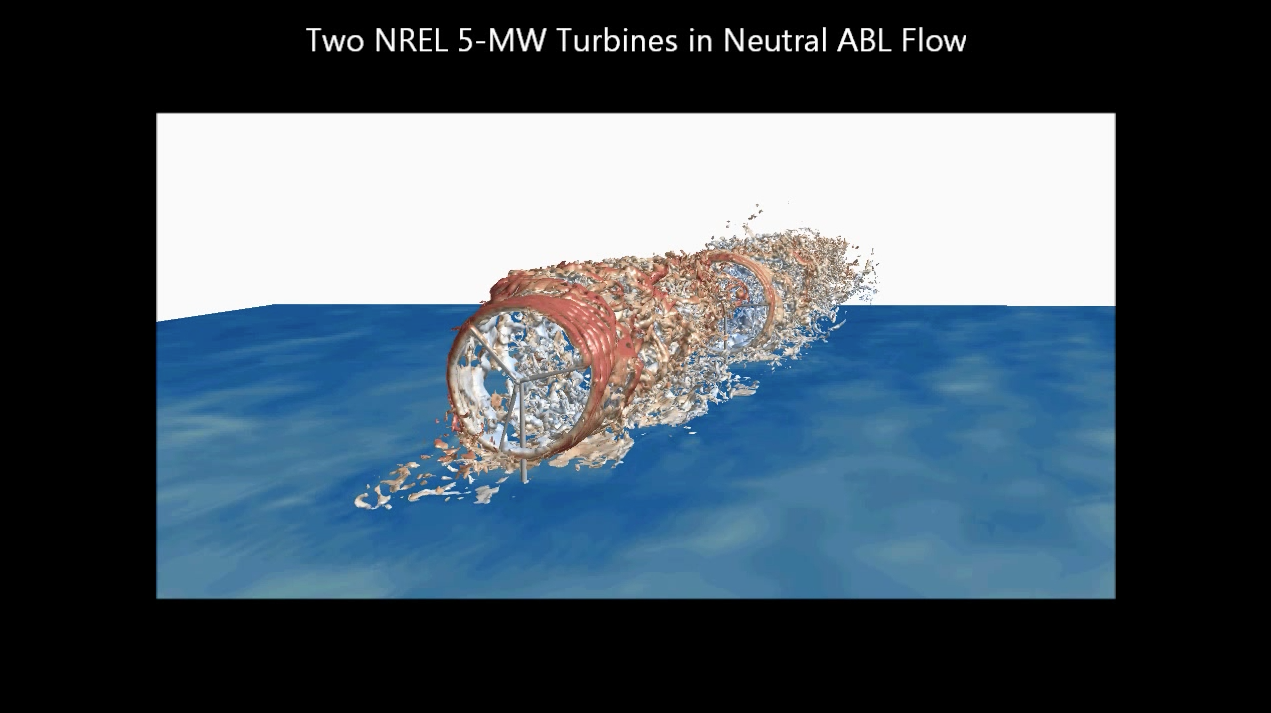
    Wind-turbine interaction:  Fieldview

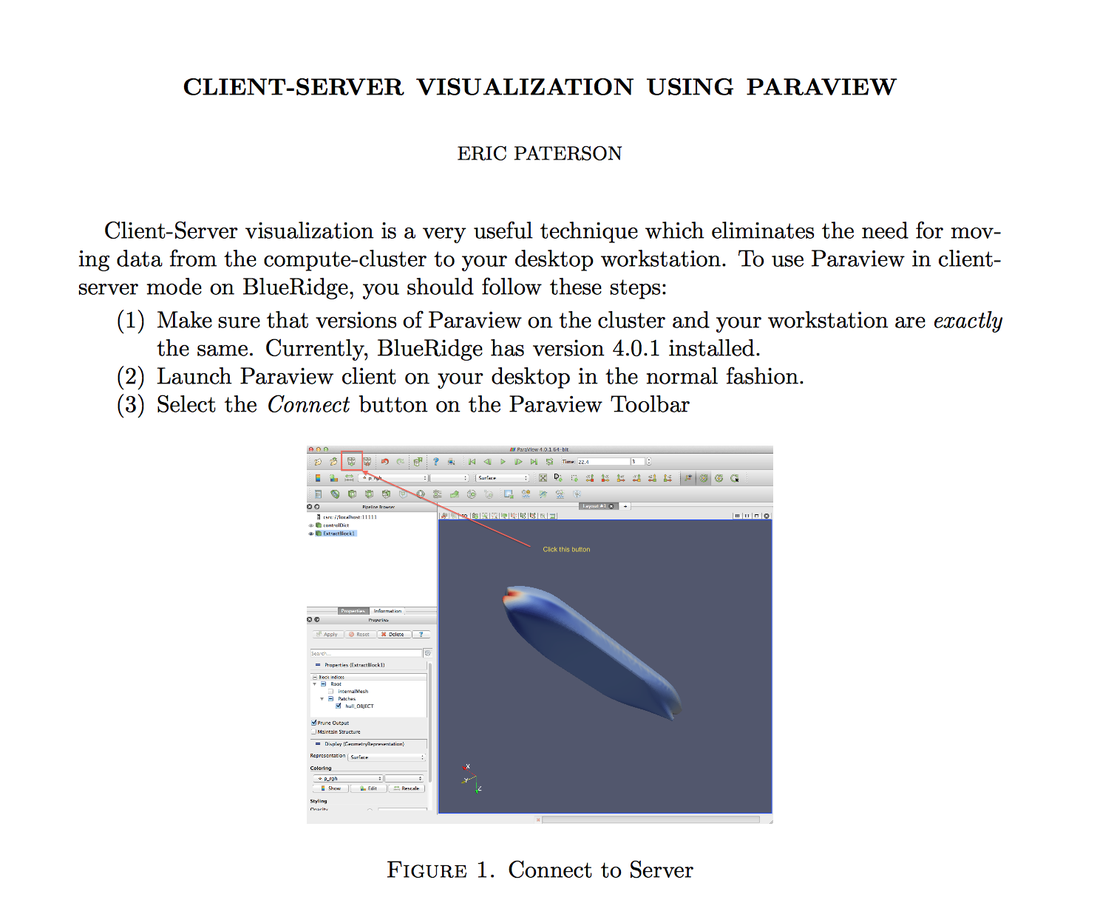
    client-server visualization walkthrough

    How-to notes posted on Scholar

    next lecture:   meshing

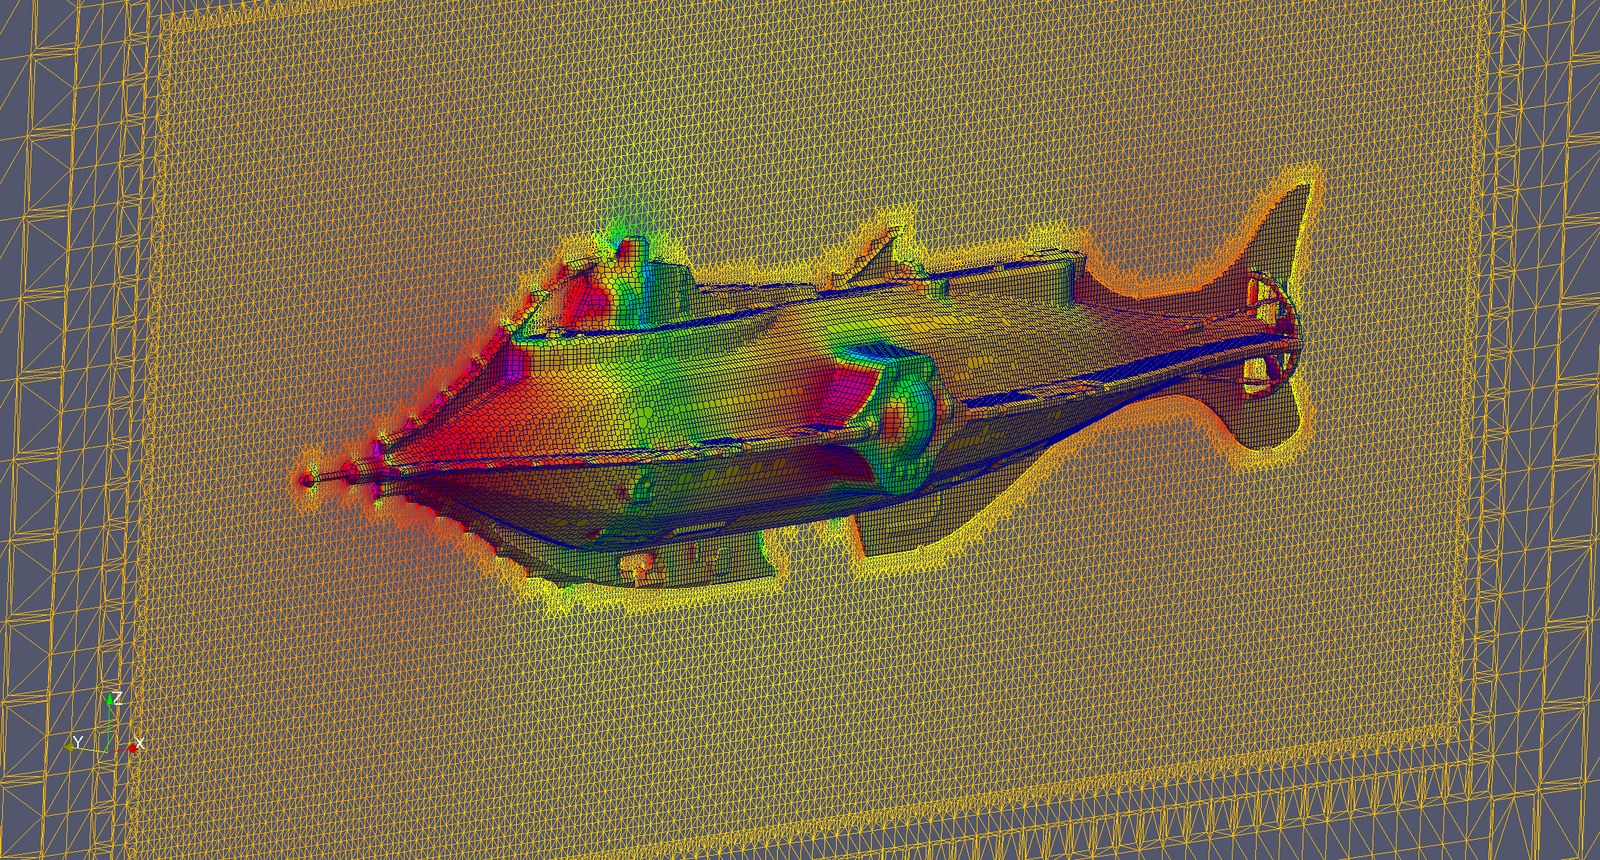
    Captain Nemo's submarine, The Nautilus

    AOE 5984: OPENFOAM Data Analysis and Visualization

    By egp@vt.edu

    AOE 5984: OPENFOAM Data Analysis and Visualization

    OpenFOAM for AOE 5984, Fall 2013. This lectures will cover data analysis and visualization for OpenFOAM CFD simulations.

    • 5,830