


Gökhan Gökalp
Software Architect, Blog writer. If you free your mind, you free your code.
Debugging
&
Profiling
.NET CORE
Applications
Performance bottlenecks?
Why did my application crash?
Debugging
&
Profiling
.NET CORE
Applications
wait
wait
wait
wait
wait
wait
Debugging
&
Profiling
.NET CORE
Applications
as a developer:
We need to know how we can identify bottlenecks.
If we want to develop or refactor applications that will work in a performance manner
Profiling tools!
Gökhan GÖKALP
Software Architect
http://www.gokhan-gokalp.com
E-mail: gok.gokalp@yahoo.com
LinkedIn: in/gokgokalp
Twitter: @gokgokalp
GitHub: gokgokalp
in our lifes almost 3 years.
Traditional way with .NET Framework on Windows for Debugging and Profiling:
but now, we are on linux world!
The big point is here, how can we debug & profile .NET Core Applications on Linux against performance problems.
method invocation counts, thread counts, call stacks
Some tools:
| Purpose | Tool |
|---|---|
| CPU Sampling | perf |
| Dynamic Tracing | perf |
| Static Tracing | LTTng |
| Dump Generation | gcore, core_pattern |
| Dump Analysis | LLDB |
We have two measurement mode while measure CPU.
Sampling:
Profiler queries call stacks of running threads to find the slowest part of the code periodically. (snapshot)
It's a good choice for long running methods or first look at performance bottlenecks quickly. (no overhead)
We have two measurement mode while measure CPU.
Tracing:
Unlike sampling, profiler watches each method invocations to capture the thread CPU time that spent in the method. (entry & exit)
It's a good choice for specific scenarios or some parts of application.
Perf
Perf is an event-oriented profiler tool that help us for performance investigations on linux-based systems.
Perf is based on the linux kernel's perf_events interface.
Capable both sampling and tracing topic for a lot of different events. (kernel events, hardware events etc...)
Perf - first step
Event sources that we can attach:
Perf - first step
Metrics can be collect: per-cpu, per-process, per-thread
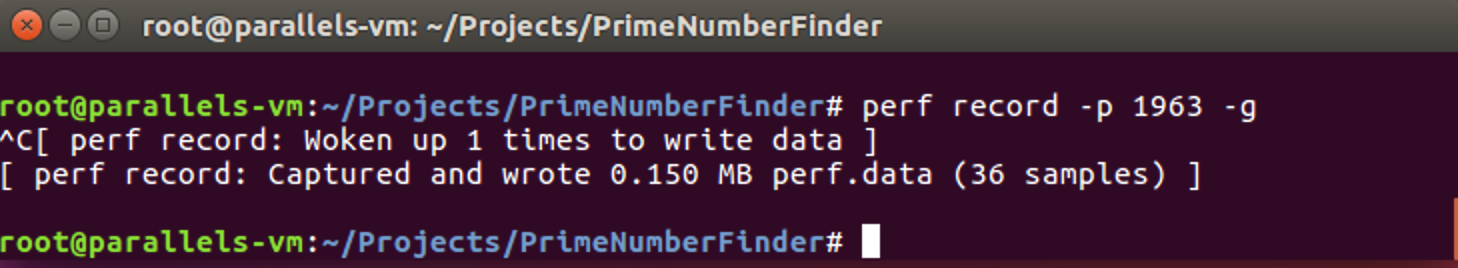
-p : process id
-g : collect call stacks
perf record
Could be big!
Memory Mapped Buffer?
Perf - second step
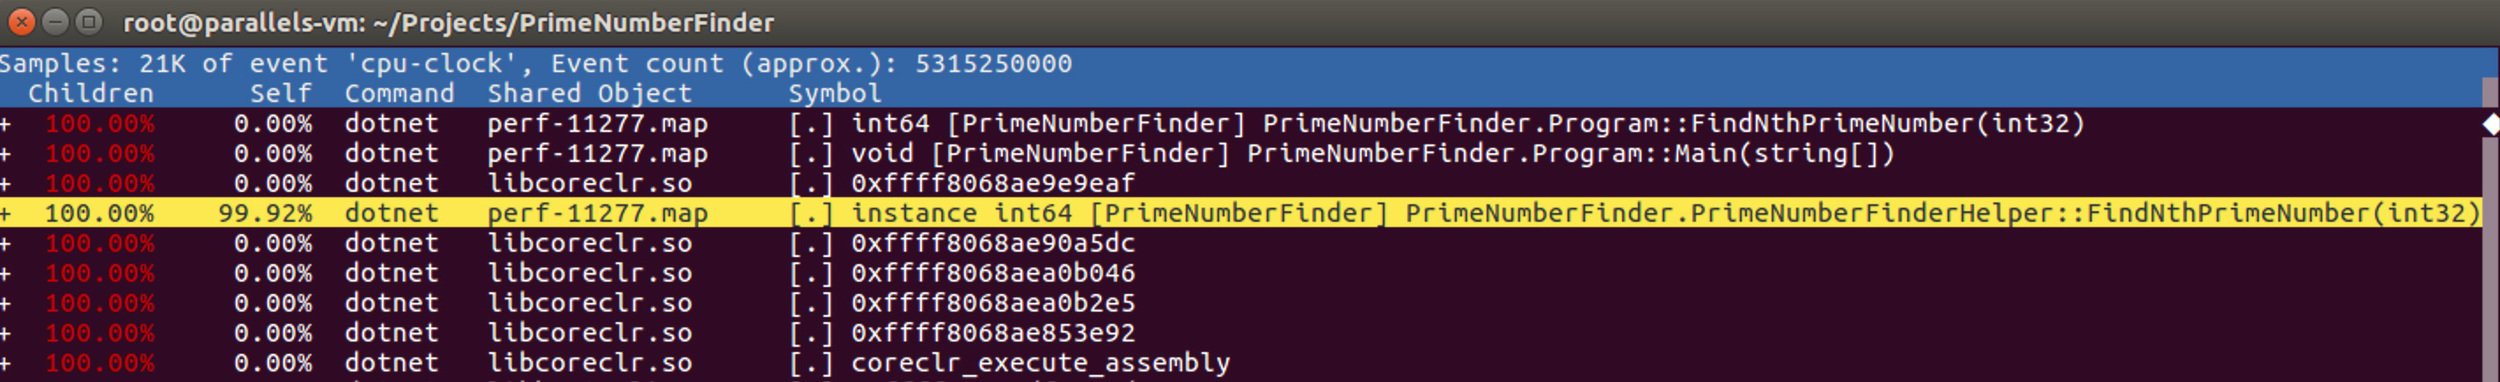
perf report
CPU activities
Perf - second step
Before start to profiling, perf must have symbol files like other debug tools. (like pdb files)
After that, hexadecimal addresses could be converted method & variable names.
Symbols
Perf - second step
Symbols
COMPlus_PerfMapEnabled=1for getting symbol information, we need to tell CoreCLR:
Tadaa!
subsequent calls overhead
method
overhead
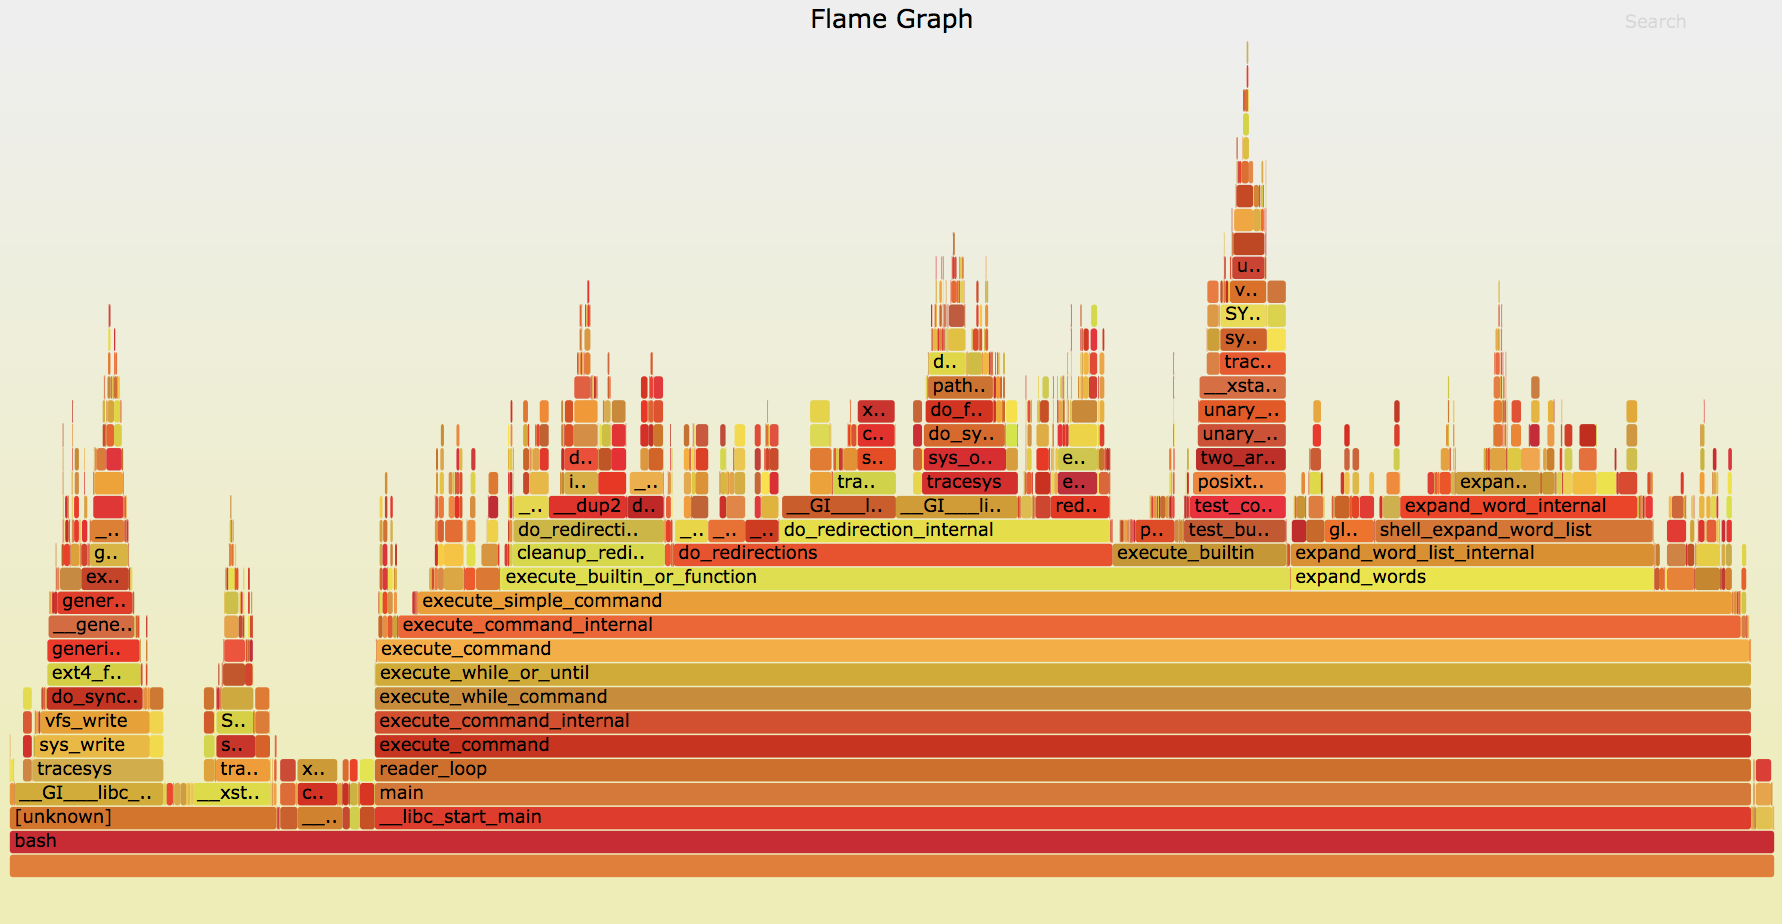
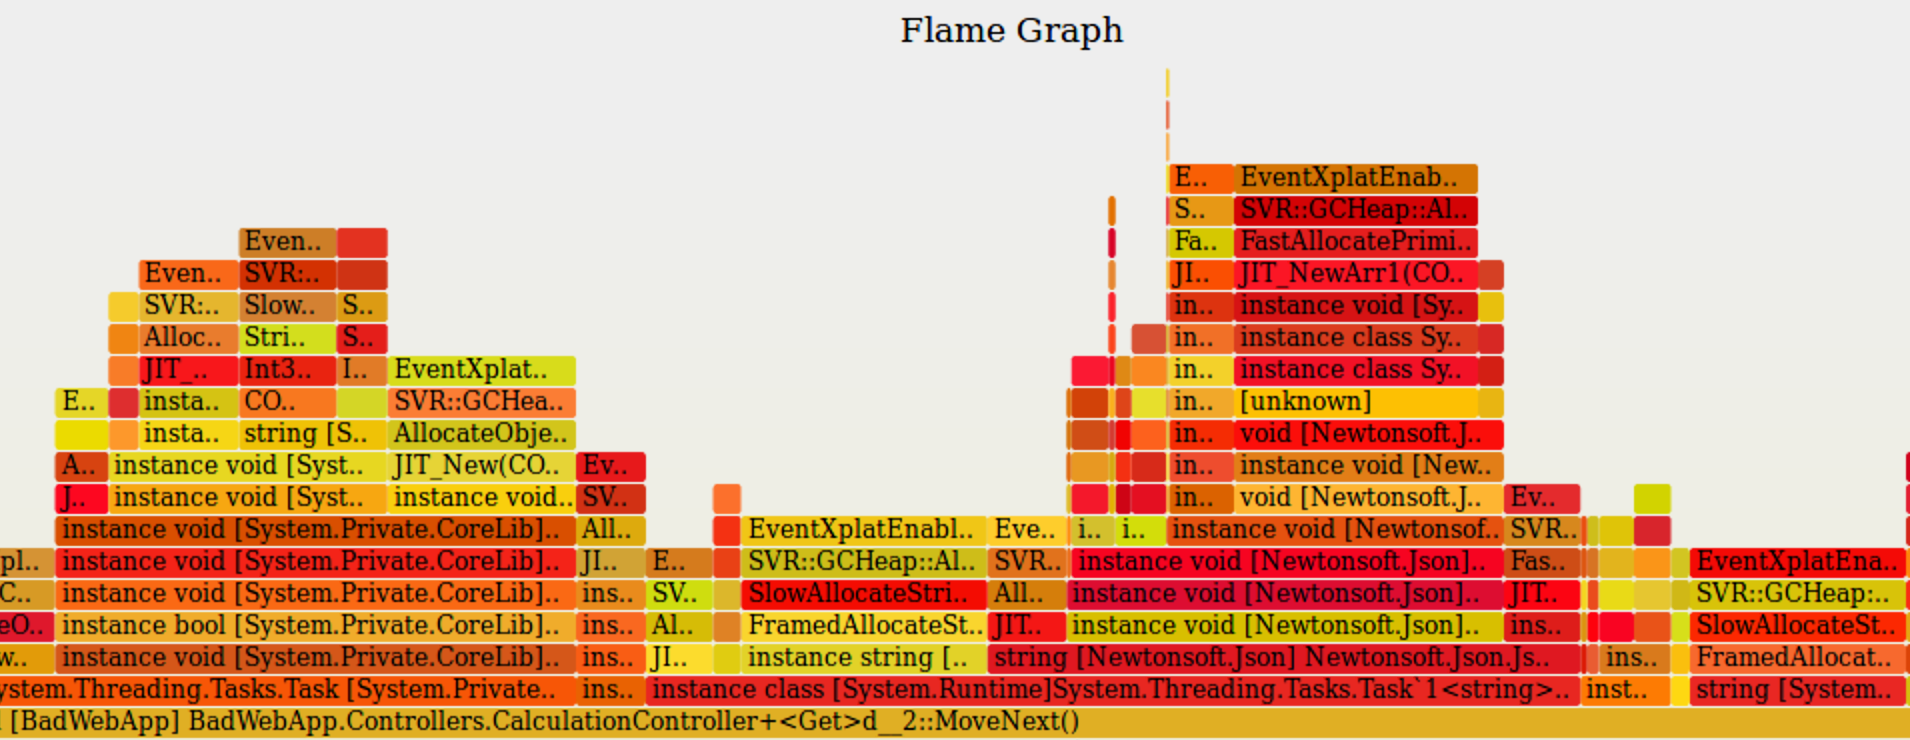
Flame Graph
It is an open-source visualization tool that allow us to identify (why CPU hot) the most frequently called code paths by grouping profile data quickly.
stack depth
each rectangle are functions
LTTng handles user-space events (e.g. runtime services, application-level events) using tracepoints generated by CoreCLR in build-time.
It is a lightweight tracing framework against more difficult problems in a similar way to the ETW events.
No more ETW events. :(
but...
We can use LTTng on Linux like ETW events.
Thanks LTTng community and .NET team for cooperation.
We can trace:
We can analyze tracing data on the same or another machine like Perf.
First step
COMPlus_EnableEventLog=1for getting event logs, we need to tell CoreCLR:
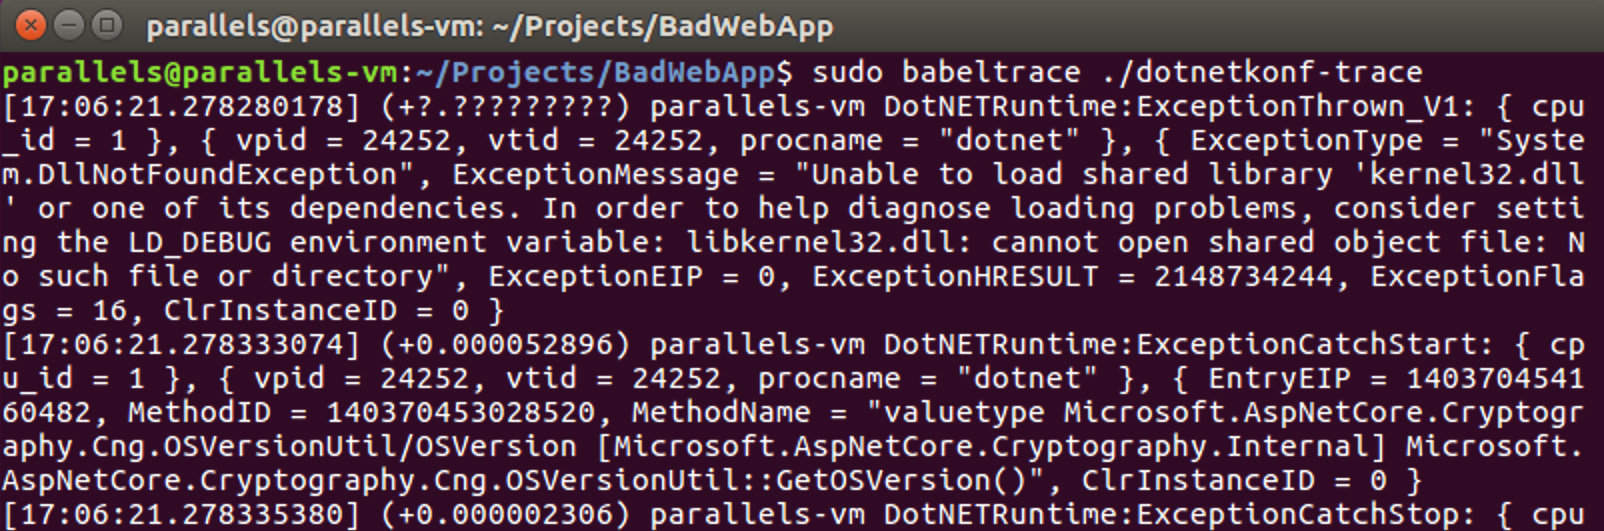
Let's assume, we have an API and want to trace exceptions on runtime:
sudo lttng create dotnetKonf -o ./dotnetkonf-trace
sudo lttng add-context --userspace --type vpid
sudo lttng add-context --userspace --type vtid
sudo lttng add-context --userspace --type procname
sudo lttng enable-event -s dotnetKonf -u --tracepoint DotNETRuntime:Exception*
sudo lttng start
sleep 20
sudo lttng stop
sudo lttng destroySecond step - viewer
as a simple default viewer, we can use babeltrace.
sudo babeltrace {TRACE_PATH}Second step - viewer
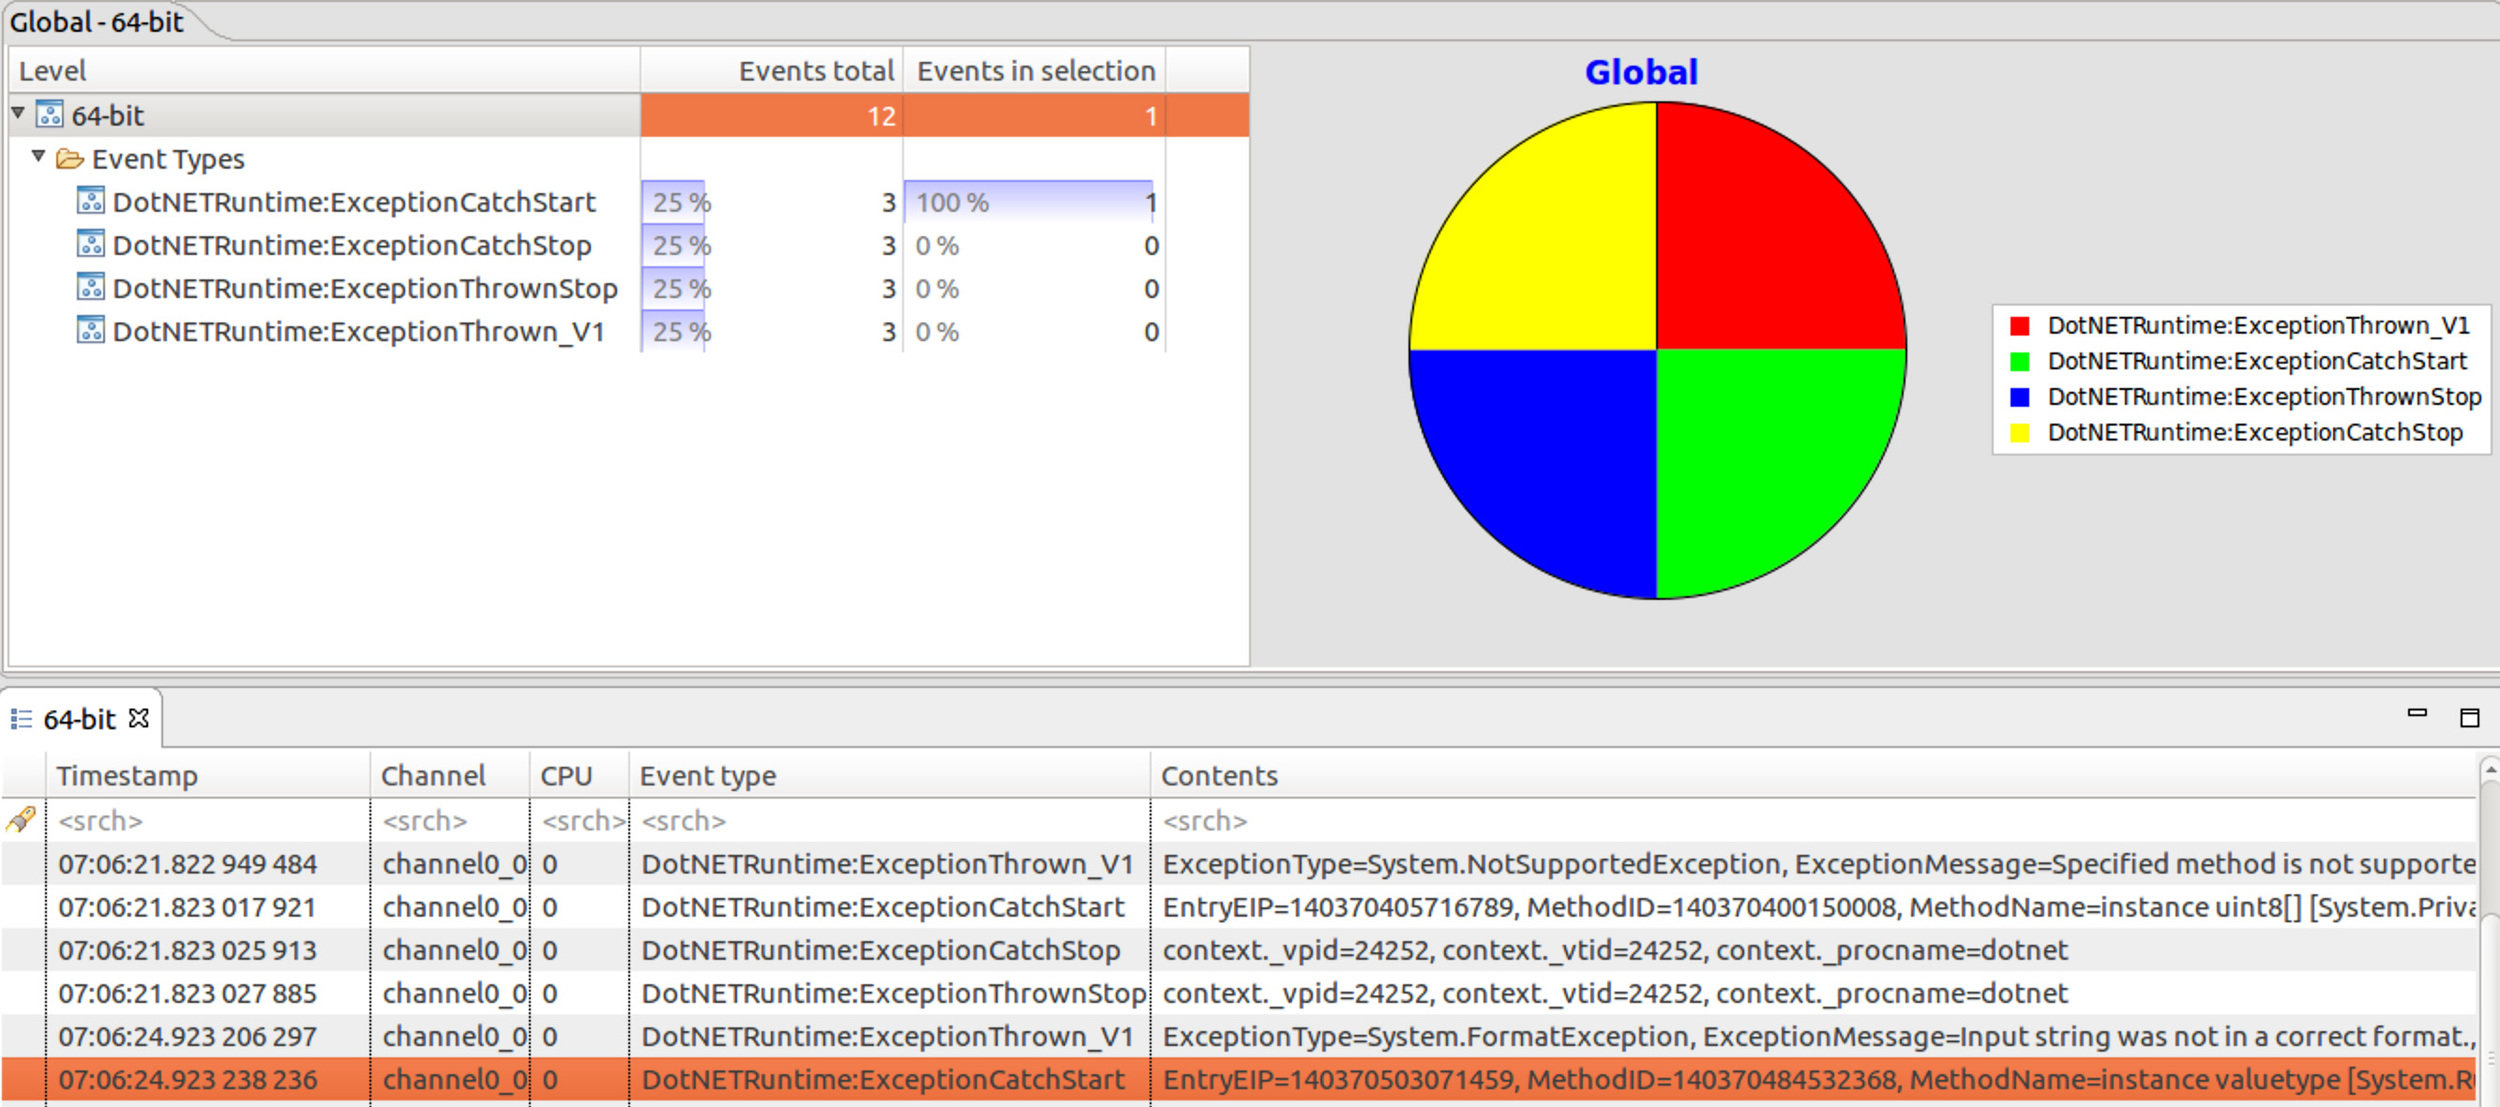
or we can use Eclipse Trace Compass.
We can trace object allocations, exceptions, but can not access callstacks,
but stack traces are not supported for user-space. :(
sudo lttng create dotnetKonf -o ./dotnetkonf-trace
sudo lttng add-context --userspace --type vpid
sudo lttng add-context --userspace --type vtid
sudo lttng add-context --userspace --type procname
sudo lttng enable-event --userspace --tracepoint DotNETRuntime:GCStart*
sudo lttng enable-event --userspace --tracepoint DotNETRuntime:GCEnd*
sudo lttng enable-event --userspace --tracepoint DotNETRuntime:GCHeapStats*
sudo lttng enable-event --userspace --tracepoint DotNETRuntime:GCAllocationTick*
sudo lttng enable-event --userspace --tracepoint DotNETRuntime:GCTriggered
sudo lttng start
sleep 20
sudo lttng stop
sudo lttng destroy
Demo - object allocations
Let's assume, we have an API and want to see object allocations:
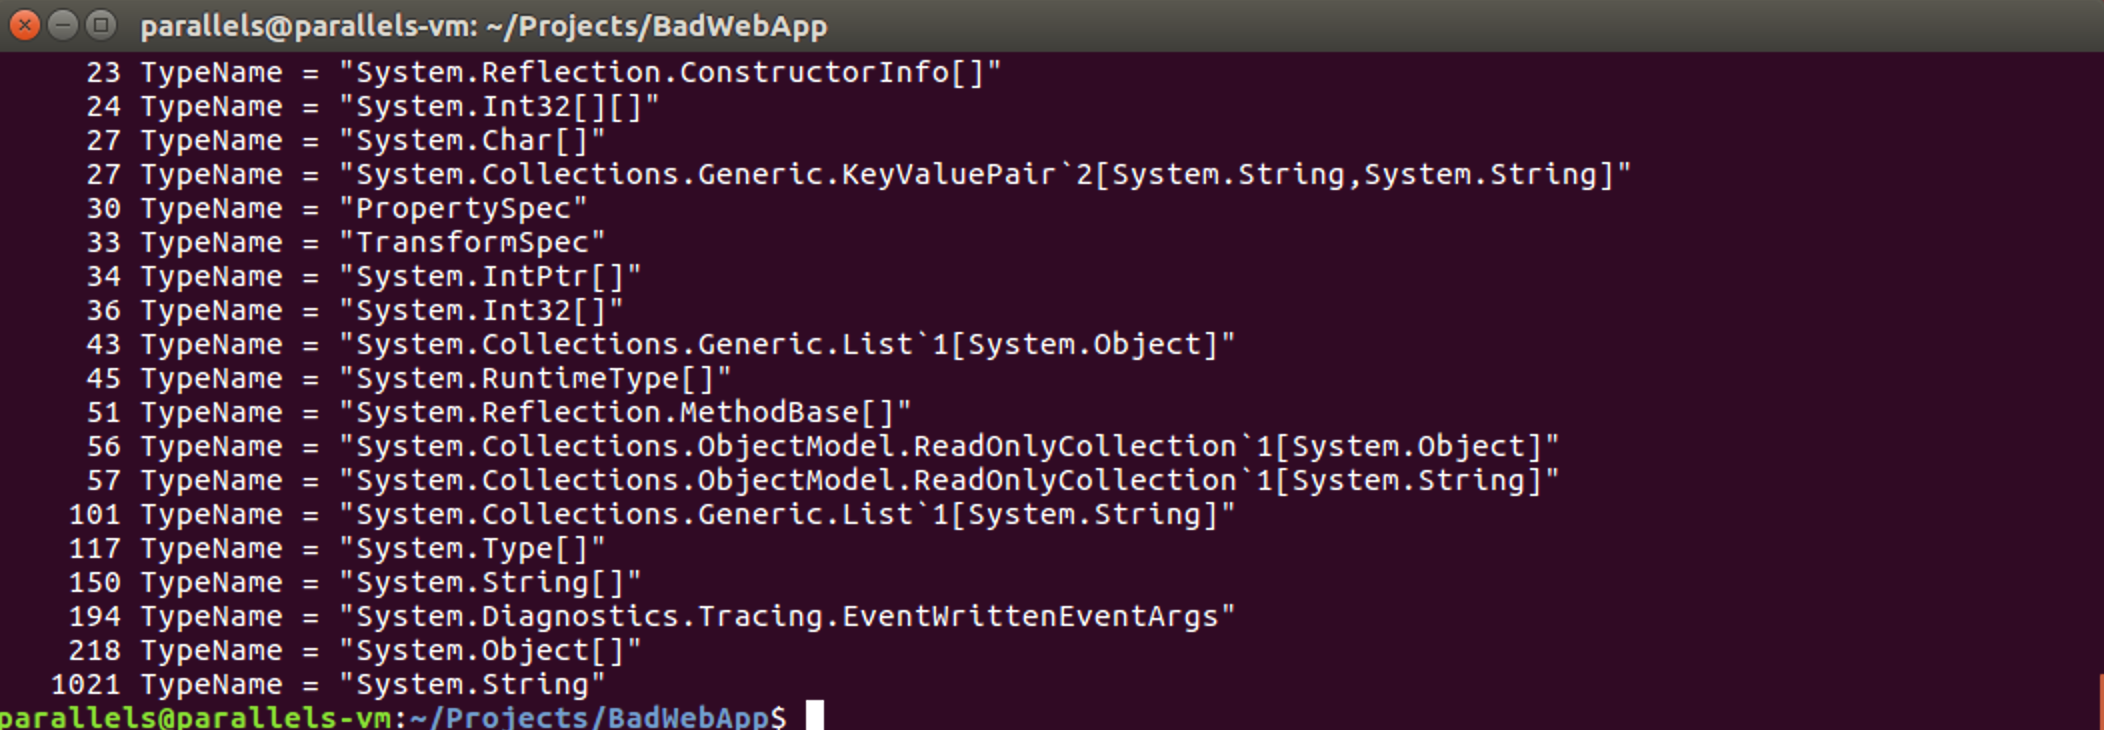
sudo babeltrace ./dotnetkonf-trace | grep GCAllocationTick* |\
grep 'TypeName = "[^"]*"' -o | sort | uniq -c | sort -n
Demo - object allocations
Filter the result with babeltrace.
GCAllocationTick fires for every 100KB of object allocations.
Where they came from?
Demo - object allocations
We can see stack traces with a few tricky ways.
EnabledAllocationTick event!
BCC is a toolkit for creating efficient kernel tracing and manipulation programs.
sudo /usr/share/bcc/tools/stackcount ./libcoreclr.so:EventXplatEnabledGCAllocationTick*\
-p {PID} -f > allocs.stacks
Let's see stack traces with BCC's stackcount func.
Demo - object allocations
sudo /.../FlameGraph/flamegraph.pl < allocs.stacks > allocs.svgLet's generate a graph.
The stack path where the objects allocated mostly.
Basically, core dump generation is a standard Linux feature.
Core file is a memory snapshot of the currently running process.
Two ways available:
Crashed
On-demand dump generation with gcore utility.
sudo gcore <pid>The core dump file will be generated with PID number under the execution path of the application.
If the core dump file will be generated as a result of crash:
/home/user/core
Note: We can remove maximum limit of core file.
ulimit -c unlimited
The default "/home/user/core" path can configure with "/proc/sys/kernel/core_pattern" configuration.
E.g.
/tmp/cores/core.%p.%e.%tOutput: /tmp/cores/core.1133.bash.1436935952
Core dump analyzing - LLDB
We need to install a suitable LLDB version with CoreCLR's architecture.
lldb-3.6 'which dotnet' -c core.{PID}First create LLDB for relevant core dump target.
(lldb) plugin load {SOS_PLUGIN_PATH}Then load the SOS plugin which comes with .NET Core SDK
Note: You can find SOS plugin with:
find /usr -name libsosplugin.so
Core dump analyzing - LLDB
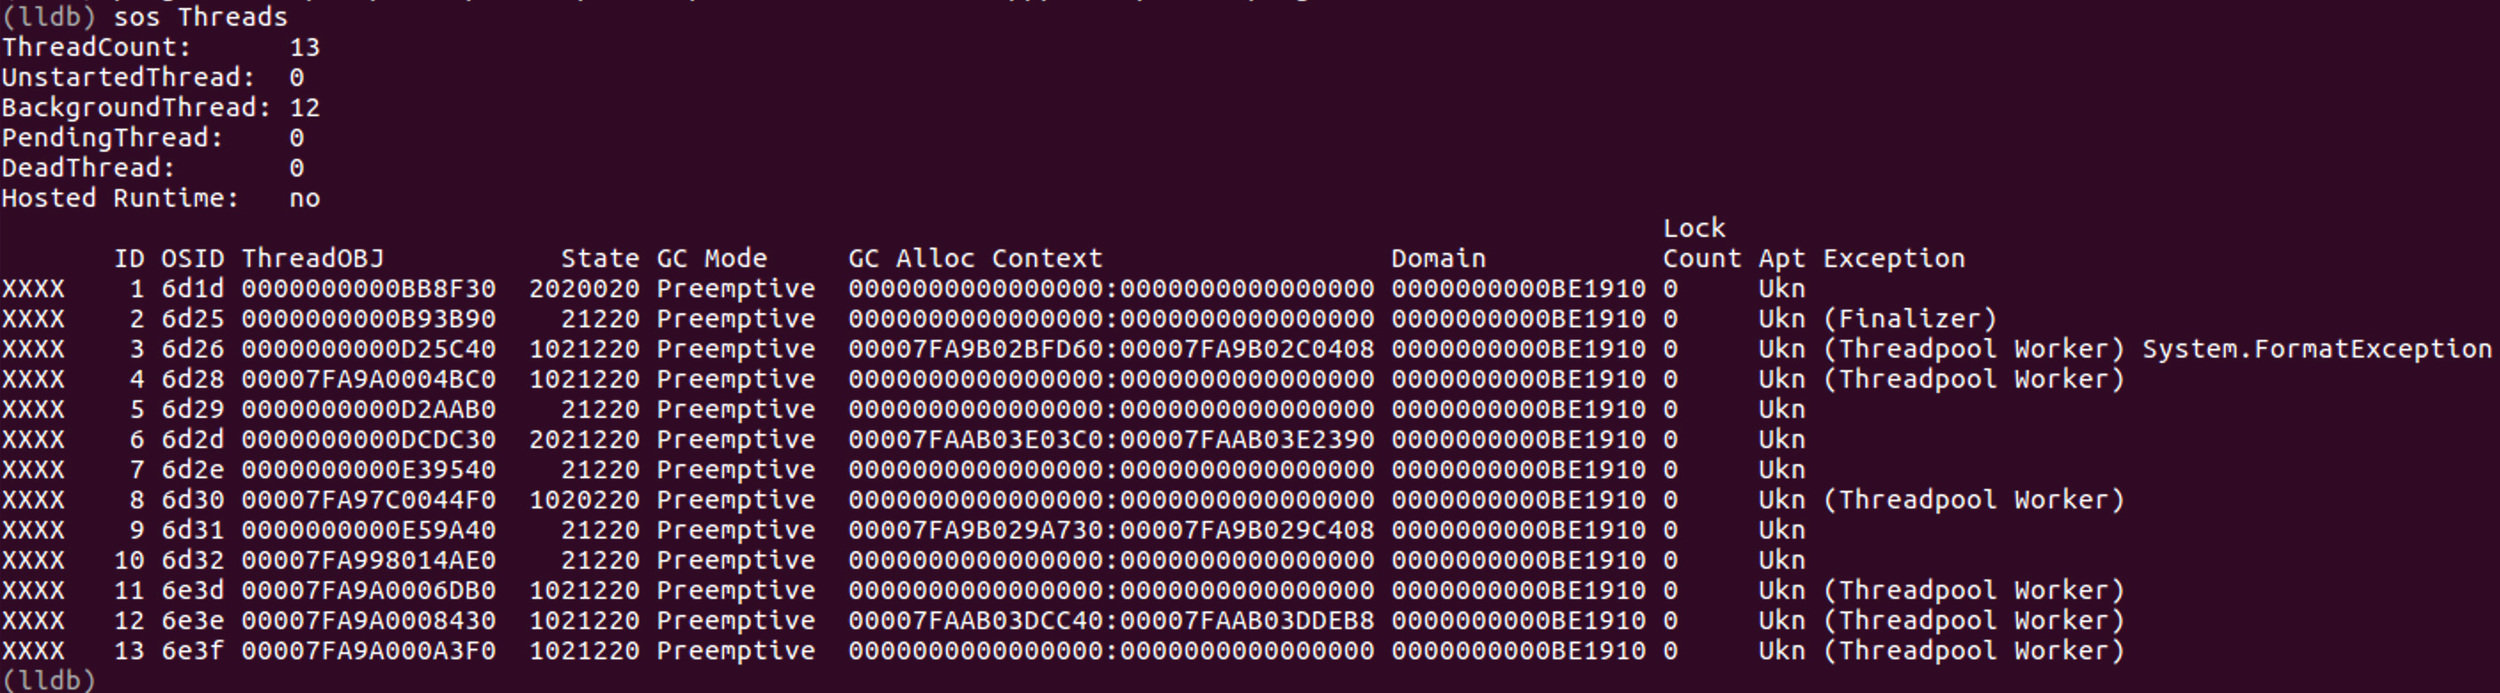
Now we are ready to analyze.
Let's see the threads:
(lldb) sos Threadsthis thread looks
suspicious
Core dump analyzing - LLDB
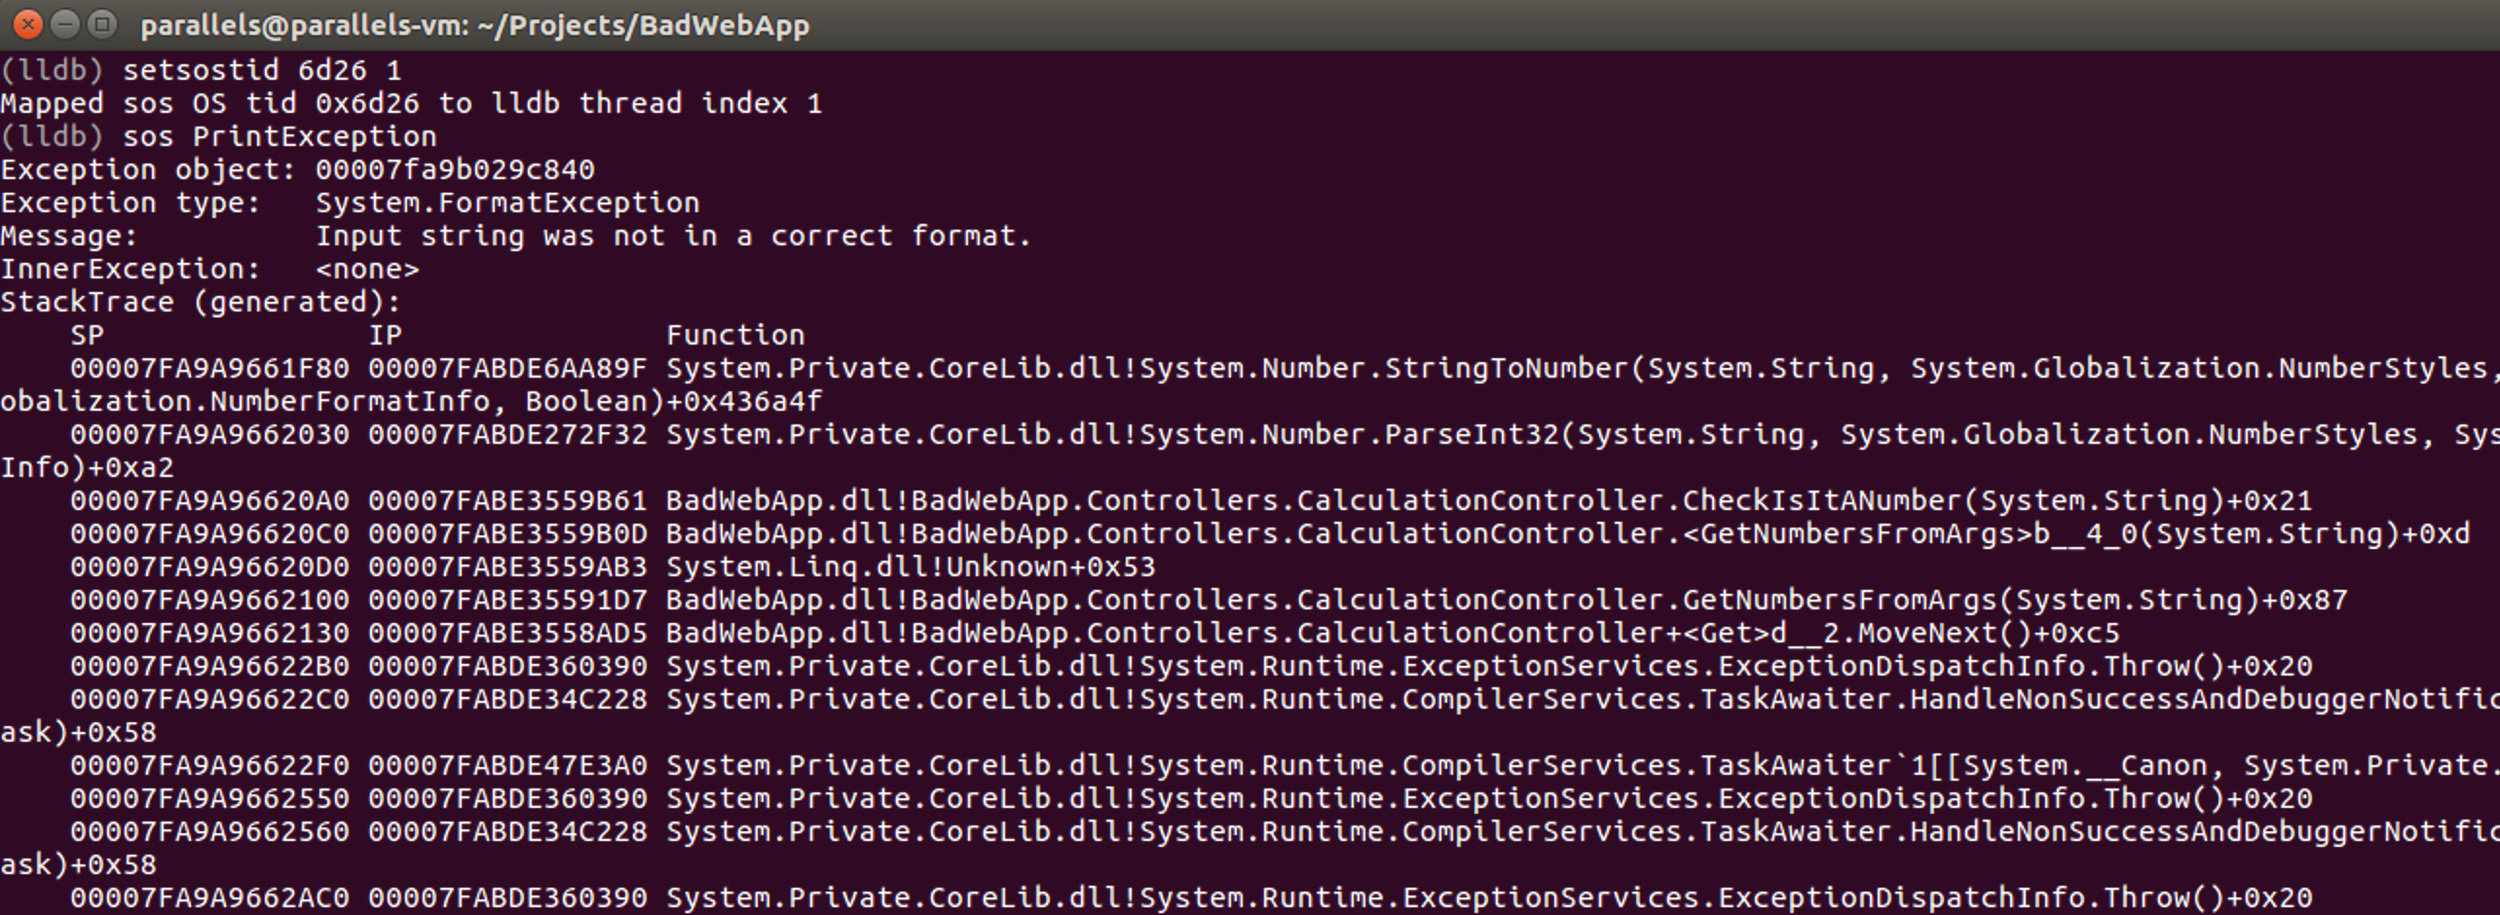
Let's investigate suspicious thread.
(lldb) setsostid 6d26 1this thread looks like
suspicious
We mapped thread's OSID with LLDB's thread id.
(lldb) sos PrintExceptionand print the exception!
Core dump analyzing - LLDB
this thread looks like
suspicious
By Gökhan Gökalp
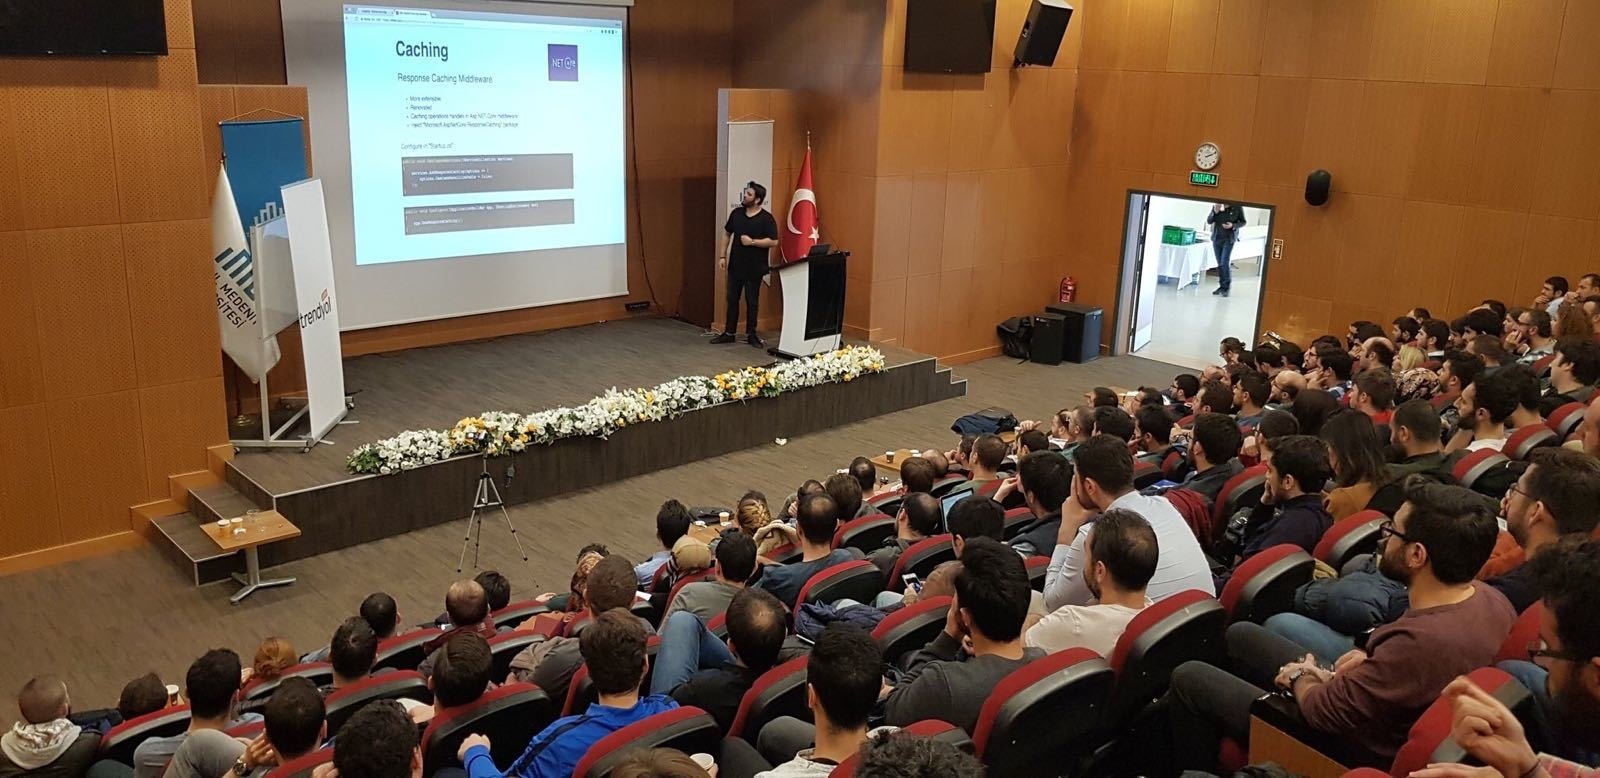
dotnet reconnect() developer conference 2018 - www.dotnetkonf.com


