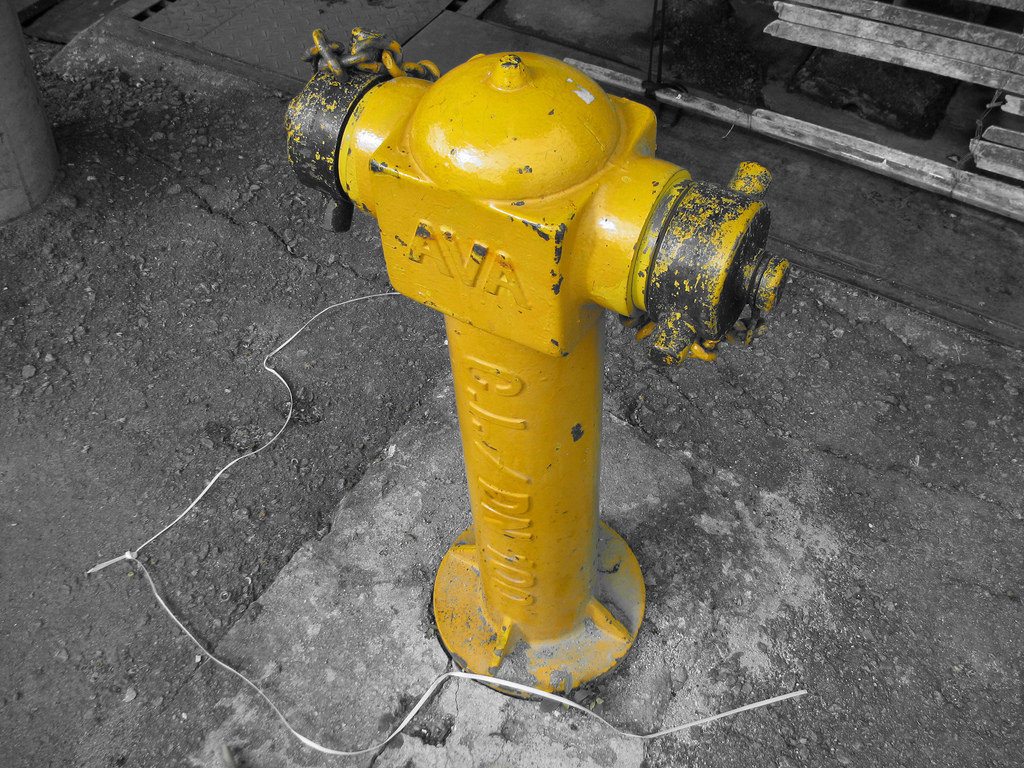
Automated Feature Extraction
Feature Measurement
from 360° street images

Panoramic image from Google Streetview
Heading
90°
180°
270°
360°
Features that can be be extracted
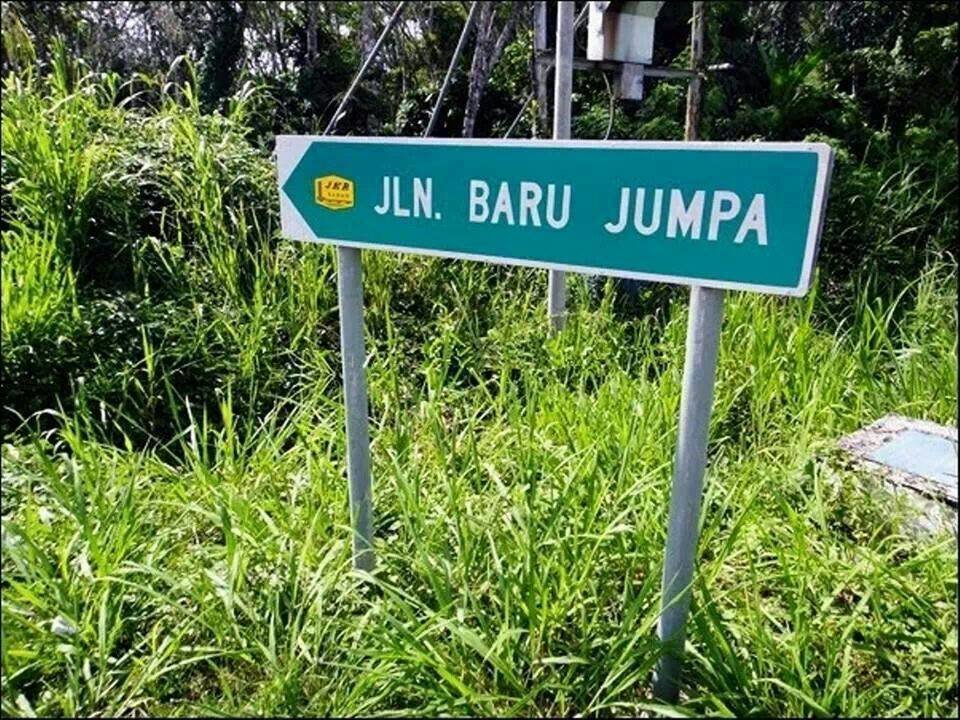
Road information (Road name, expressway info etc)
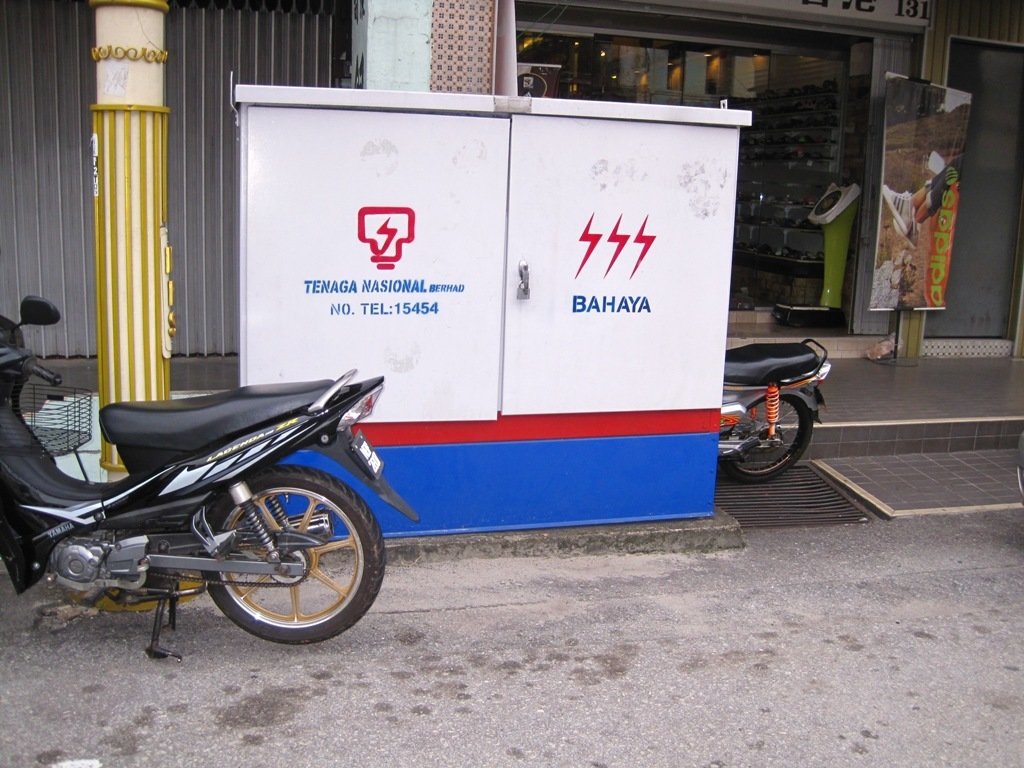
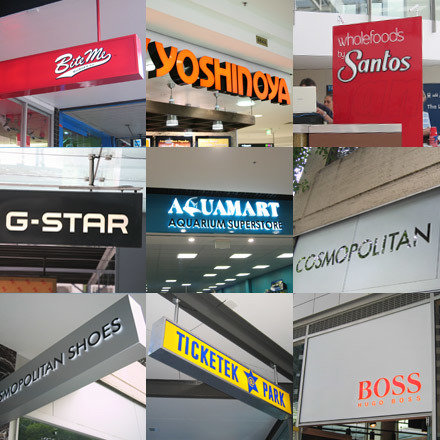
Point of interests (place name, brand logo etc)
Road features (Traffic light, street lamps etc)
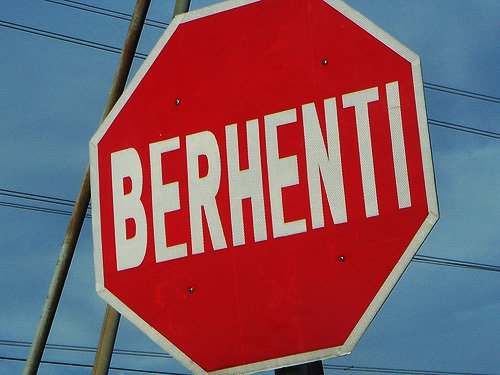
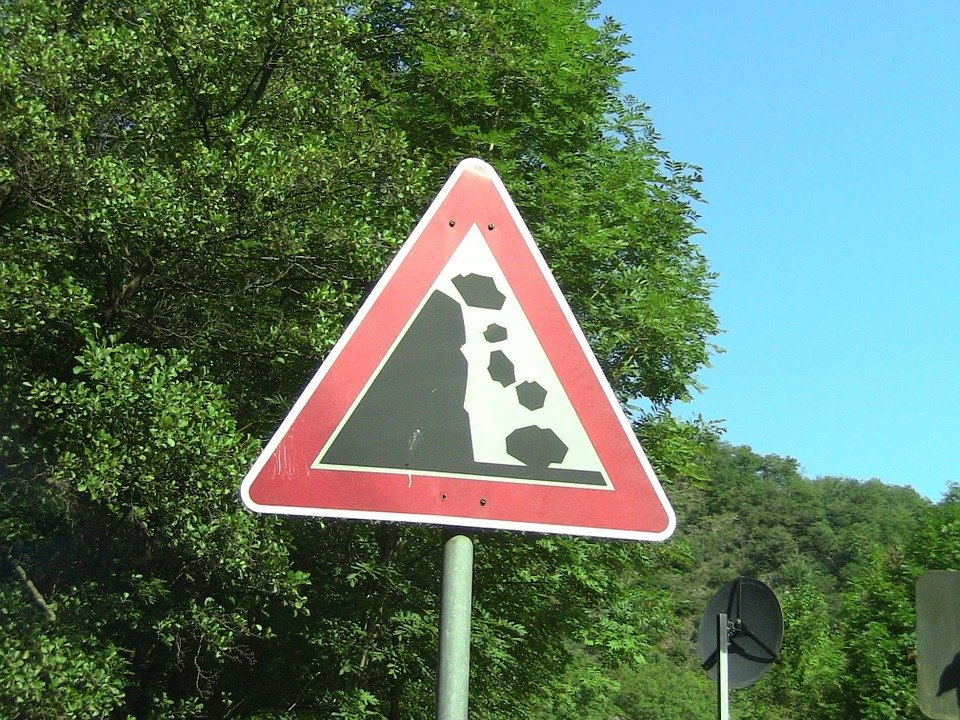
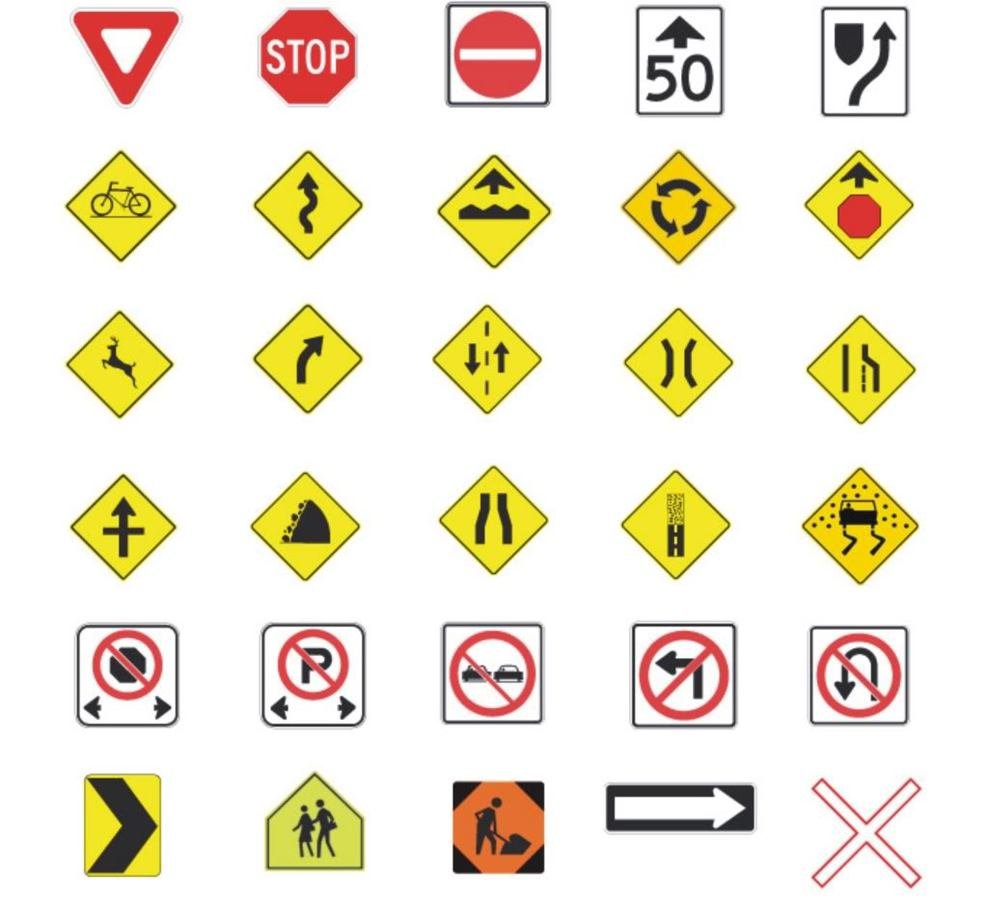
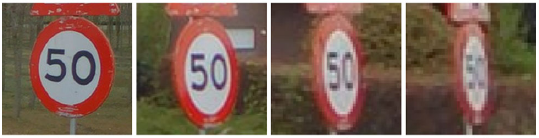
Traffic signs (warning, restriction, limit etc)
Features that can be be extracted
(Latitude?, Longitude?)
(Latitude?, Longitude?)
(Latitude?, Longitude?)
(Latitude?, Longitude?)
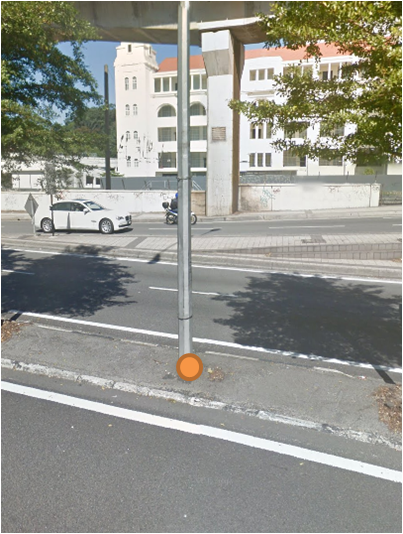
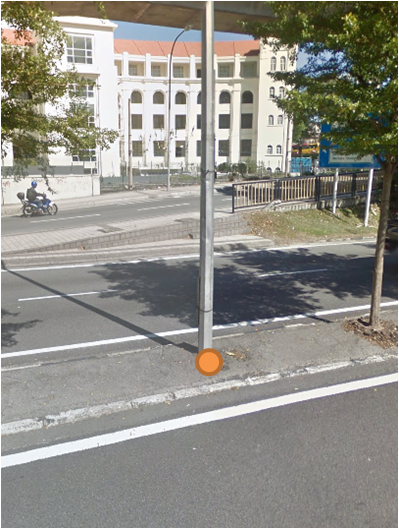
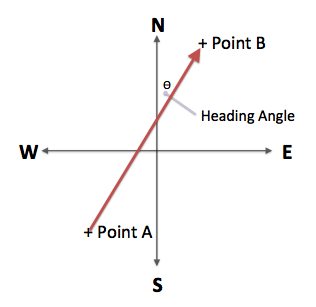
Photogrammetry concept in Street View Feature Extraction
Get coordinates of Point from position A
Move to the next sequence of image
Get coordinates of Point from postion B
Apply some trigonometry calculations
Receive coordinates of Point
Photogrammetry concept in Street View Feature Extraction
Position A
Position B
Point of interest
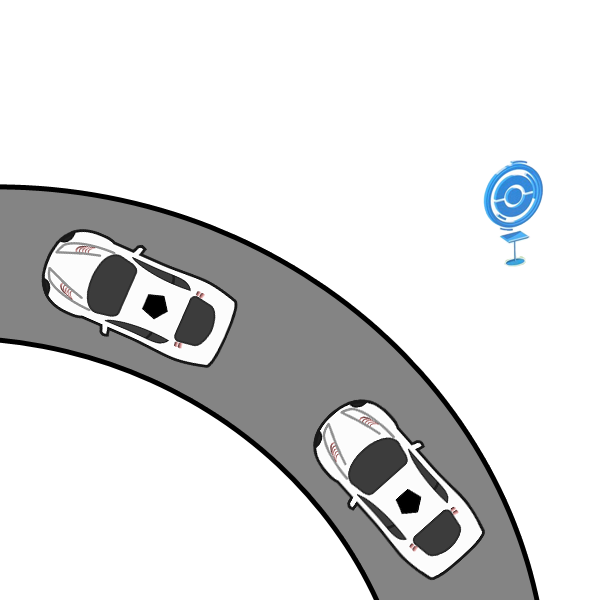
Photogrammetry concept in Street View Feature Extraction
Position A
Position B
Point of interest
Photogrammetry concept in Street View Feature Extraction
B
A
b
a

P
( NB x tan ( b ) ) - ( NA x tan ( a ) ) - EB + EA
tan ( b ) - tan ( a )
( EB x cot ( b ) ) - ( EA x cot ( a ) ) - NB + NA
cot ( b ) - cot ( a )
NP =
EP =
(EP, NP)
(EB, NB)
(EA, NA)
Heading A
Heading B
http://www.hugha.co.uk/PhotoInt/SphericalPanos.htm
Photogrammetry concept in Street View Feature Extraction
http://www.hugha.co.uk/PhotoInt/SphericalPanos.htm

A
P
(EP, NP)
(EA, NA)
HD = Square Root ( dE2 + dN2 )
dH = HD x tan ( VA )
VA
Photogrammetry concept in Street View Feature Extraction
Horizontal Angle = (horizontal pixel difference between the reference and the point / horizontal pixels for the image) x Horizontal FOV
Vertical Angle = (vertical pixel difference between the horizon and the point / vertical pixels for the image) x Vertical FOV
Horizontal FOV
Vertical FOV
Horizon
Reference - Heading
Automated Feature Detection
from images
Identifying Features

Identifying Features


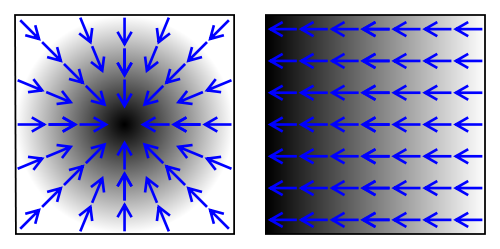
Histogram of Oriented Gradients (HOG)
For every pixel in an image, it can be calculated in which direction the color changes the fastest.
The gradient would point into the direction where the image is getting darker.
https://kiriproject.wordpress.com/tag/computer-vision/
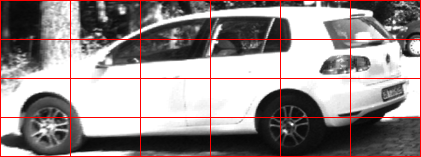
Histogram of Oriented Gradients (HOG)
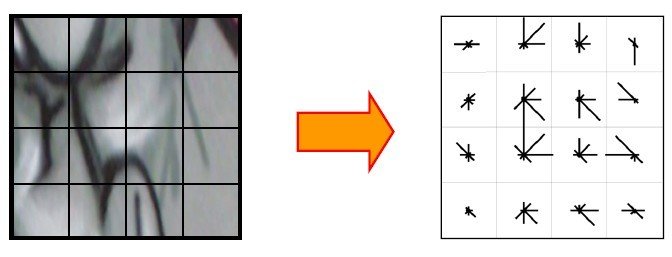
An image is separated into cells
Orientations of gradient are calculated and visualized in histograms for each cells
https://kiriproject.wordpress.com/tag/computer-vision/
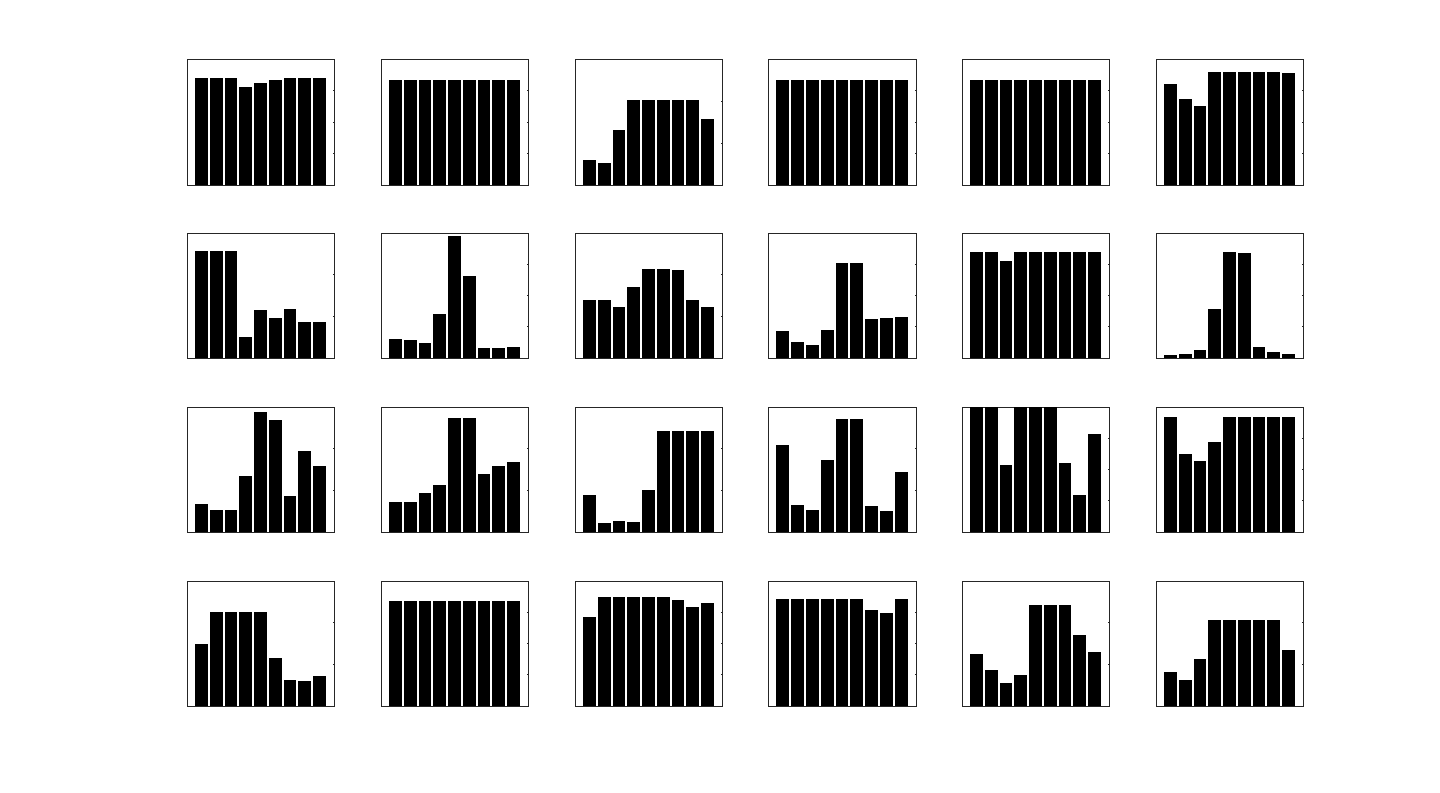
Histogram of Oriented Gradients (HOG)
Most of the time the histograms are visualized in angular histogram form
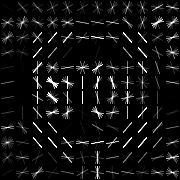
Example of a STOP sign HOG using Matlab+Python
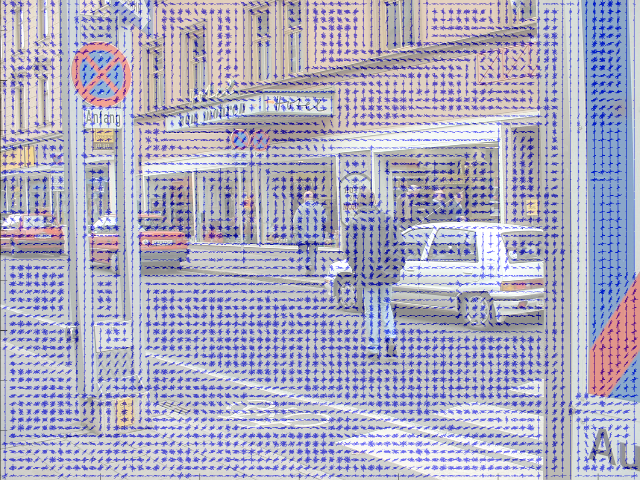
Histogram of Oriented Gradients (HOG)
Example of a street view image HOG
Histogram of Oriented Gradients (HOG)
A sliding window for each image and scale will slide through the image to detect trained image

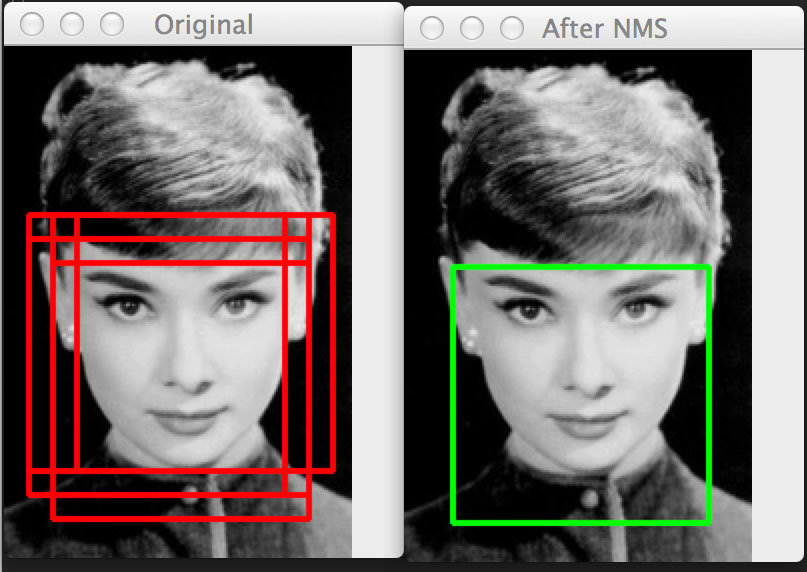
Overlapping detection will be merged using MeanShift algorithm
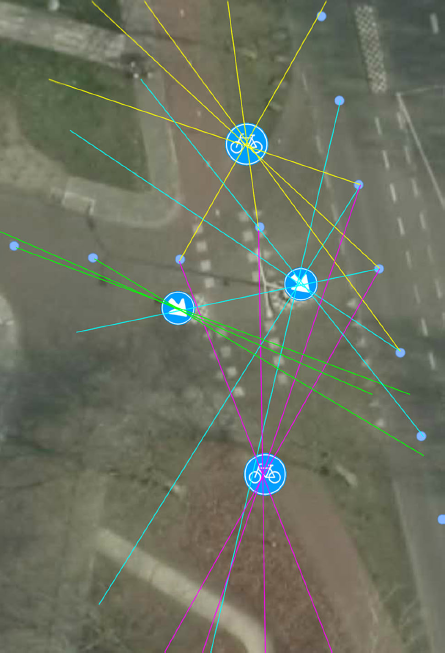
Scale-invariant feature transform (SIFT)
SIFT is another descriptor developed based on HOG
Keypoints are extracted from trained images (keypoints localization)
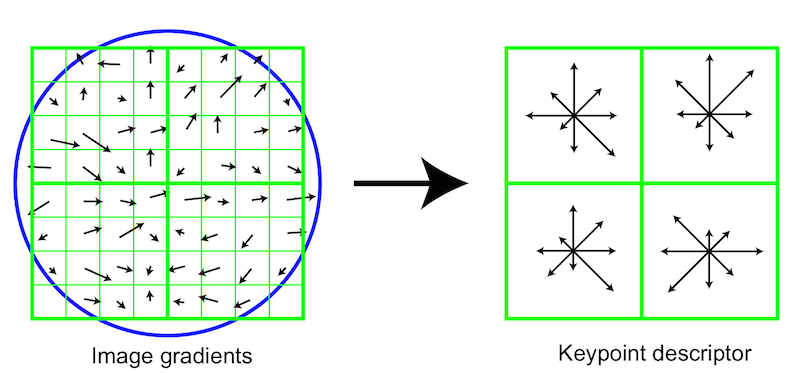
Scale-invariant feature transform (SIFT)
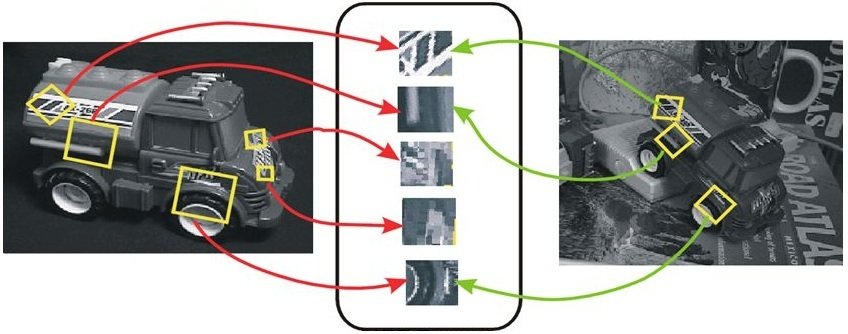
SIFT features
Particular scales and orientations are generated to keypoints ensuring invariance to image location, scale and rotation
Scale-invariant feature transform (SIFT)
Automated Feature Extraction
from 360° street images
Objective
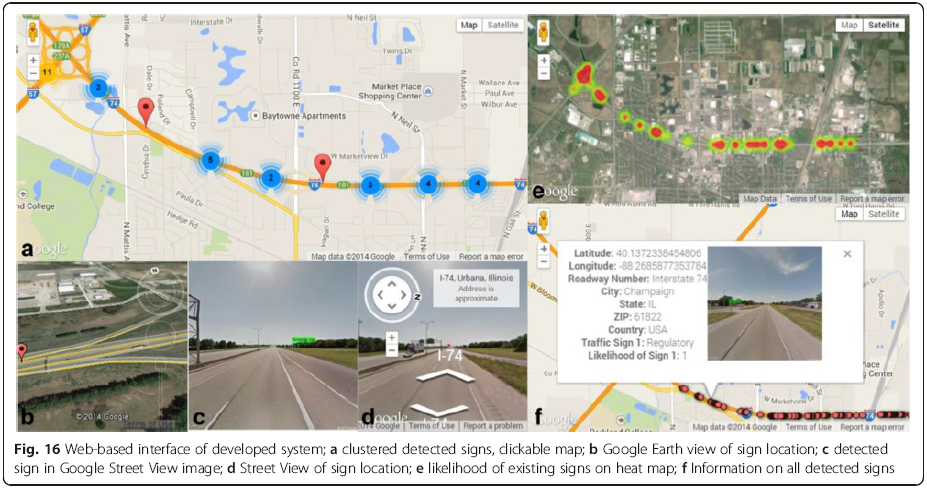
Automatically extract features from streetview images by classifying the feature type and identify its location

Proposed Strategy
Input
Single Image detection
Multi-view sign positioning
Multi-view sign classification
Output
Input
Single Image detection
Multi-view sign positioning
Multi-view sign classification
Output
- Sequence of street view images
-
Image information
- Capturing position (Latitude & longitude)
- Camera heading (° facing North)
Input
Single Image detection
Multi-view sign positioning
Multi-view sign classification
Output
1st stage: HOG detector
2nd stage: SIFT classifier
Identify if street view image has the feature
Identify the feature
- HOG use less resource
- provide positive & negative training data
- retrieve pixel locations of all features
- based on bounding boxes from 1st stage
- algorithm multiplies the huge training data
- generalize type of feature (e.g. warning signs, shop signs, road features etc.)
Input
Single Image detection
Multi-view sign positioning
Multi-view sign classification
Output
- Identifies detection from consecutive captured images
- Single detection will be identified as false positive
- Apply trigonometry to estimate location
Input
Single Image detection
Multi-view sign positioning
Multi-view sign classification
Output
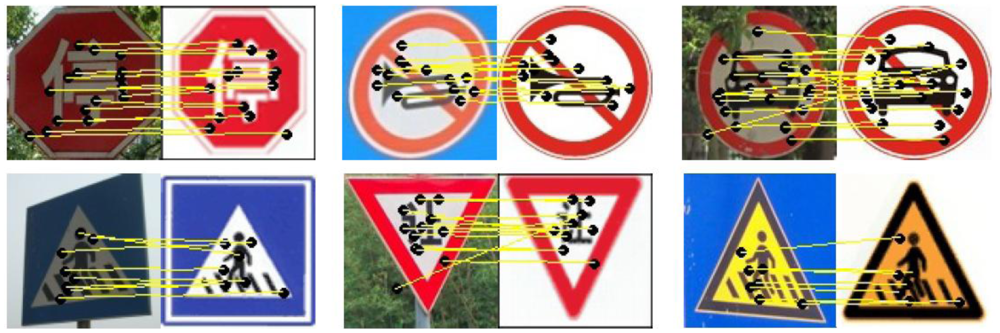
- Further accurately classifies feature based on multiple angles of detection
- Text recognition for street signs
Input
Single Image detection
Multi-view sign positioning
Multi-view sign classification
Output


Challenges
-
Source data
- Coverage wise
- Accuracy wise
-
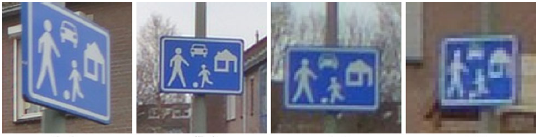
Complicated features
- Obstructions
- Look alike features
- Non-standardized signs
-
Requires large set of training data
- 10,000 - 50,000 data even for a specific detection
Automated Feature Extraction
By hizumi