
Learning from time-series data
\(d\)
\(x=g(d)\)
\(\hat{y}=f(x)\)
\(\hat{y}\)
\(d → \hat{y}\)
| Area | Sub Region | Region | Item | Element | Unit | Start Year Value | ... | End Year Value |
|---|---|---|---|---|---|---|---|---|
| spain | southern europe | europe | lettuce and chicory | production | tonnes | 1960 | 2020 | |
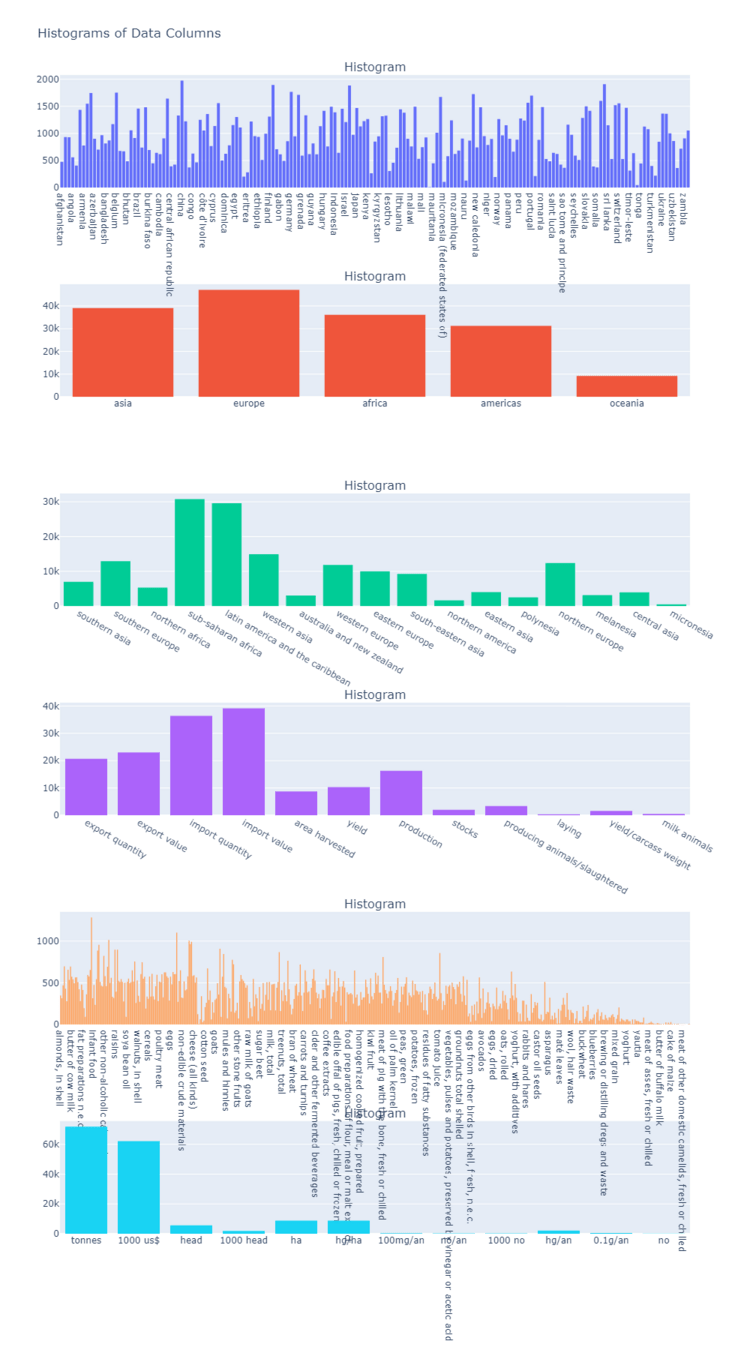
Data: FAOSTAT
Tables: Production, Trade
Observations: 167 381 time-series
| 2000 | 2001 | 2002 | ... | 2015 | 2016 | 2017 | 2018 | 2019 | 2020 |
|---|---|---|---|---|---|---|---|---|---|
| 1014592 | 994200 | 1037062 | ... | 929944 |
976112 | 938530 | 1009810 | 969060 | 1066010 |
| 1995 | 1996 | 1997 | ... | 2015 | 2016 | 2017 | 2018 | 2019 | 2020 |
|---|---|---|---|---|---|---|---|---|---|
| 1014592 | 994200 | 1037062 | ... | 929944 |
976112 | 938530 | 1009810 | 969060 | 1066010 |
A1
A2
OOD Validation
IID Train/Test
OOD Validation
OOD Validation
IID Train/Test
| 2000 | 2001 | 2002 | ... | 2015 | 2016 | 2017 | 2018 | 2019 | 2020 |
|---|---|---|---|---|---|---|---|---|---|
| 1014592 | 994200 | 1037062 | ... | 929944 |
976112 | 938530 | 1009810 | 969060 | 1066010 |
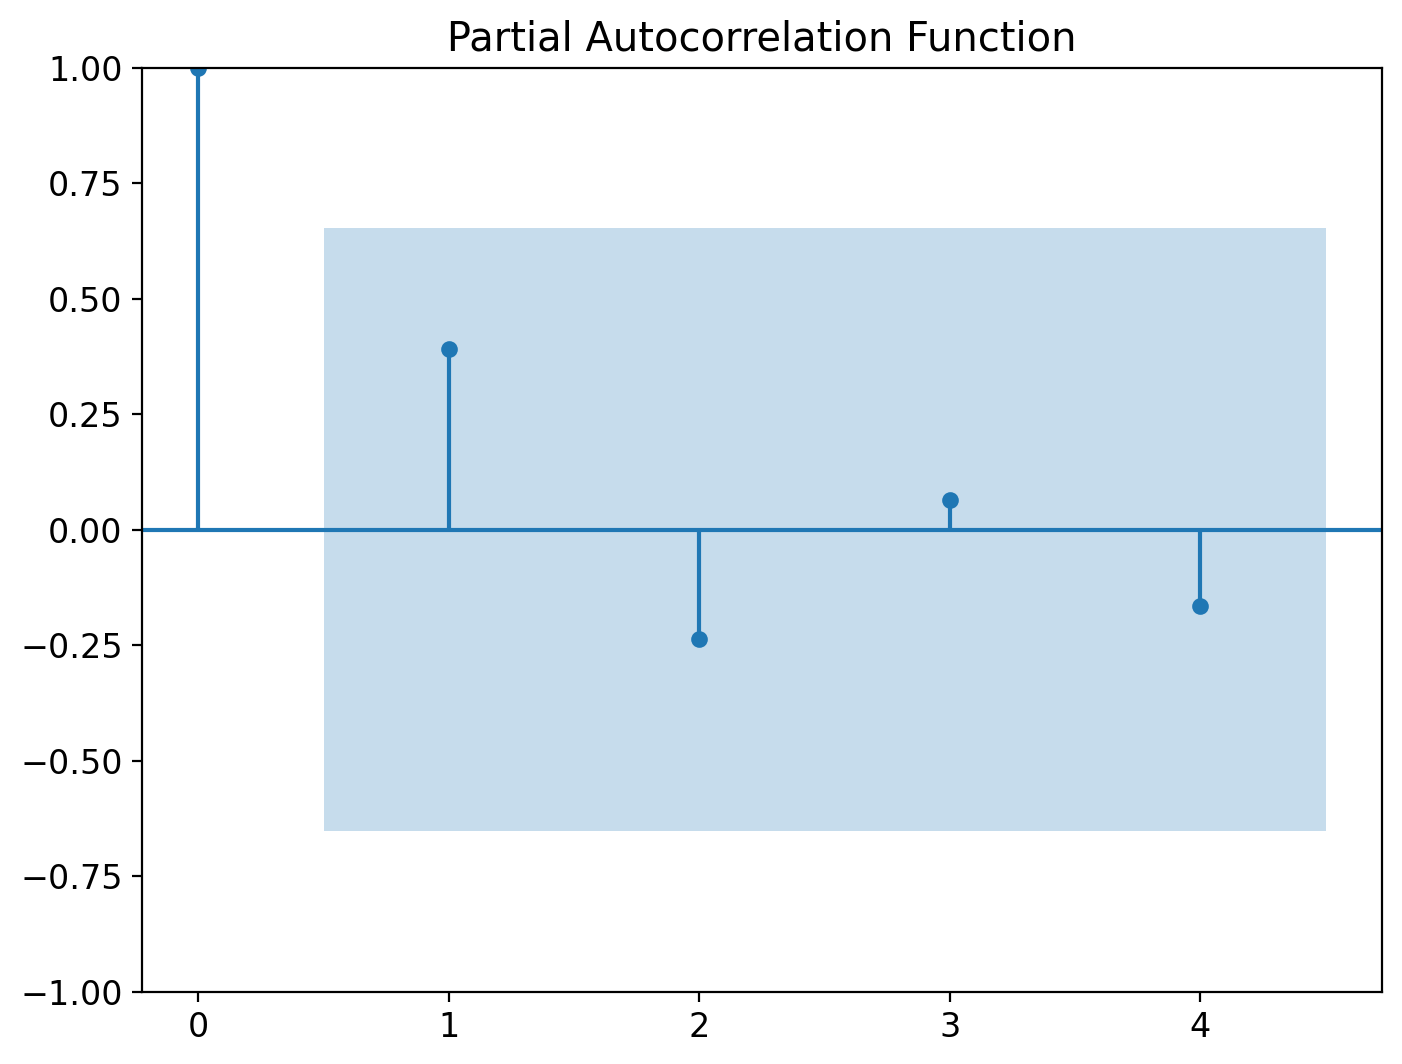
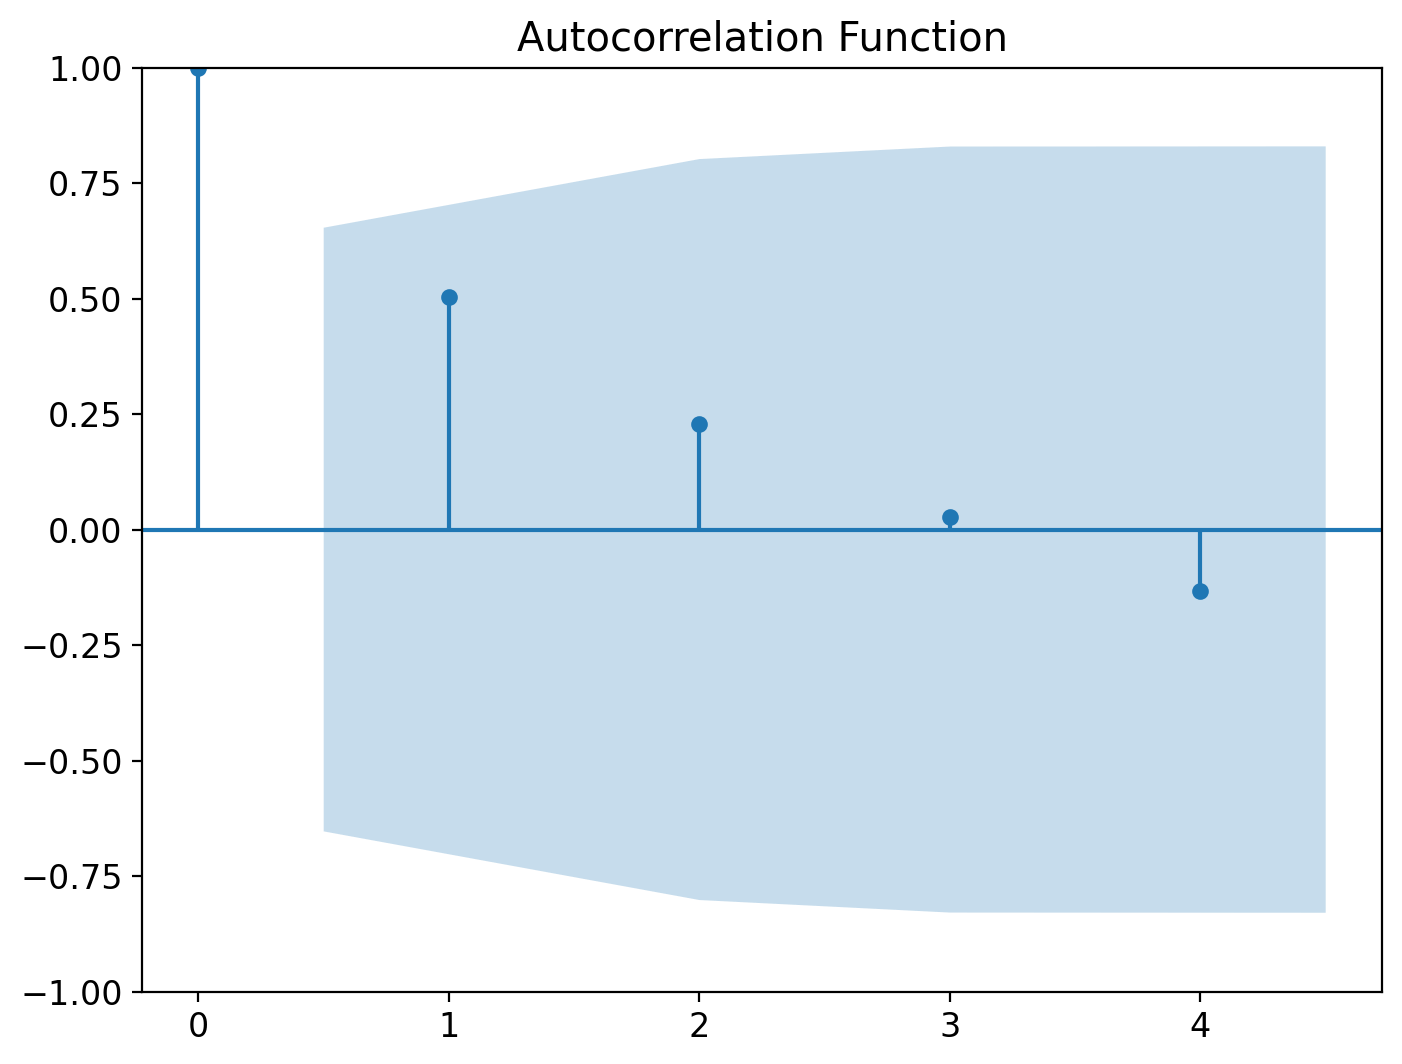
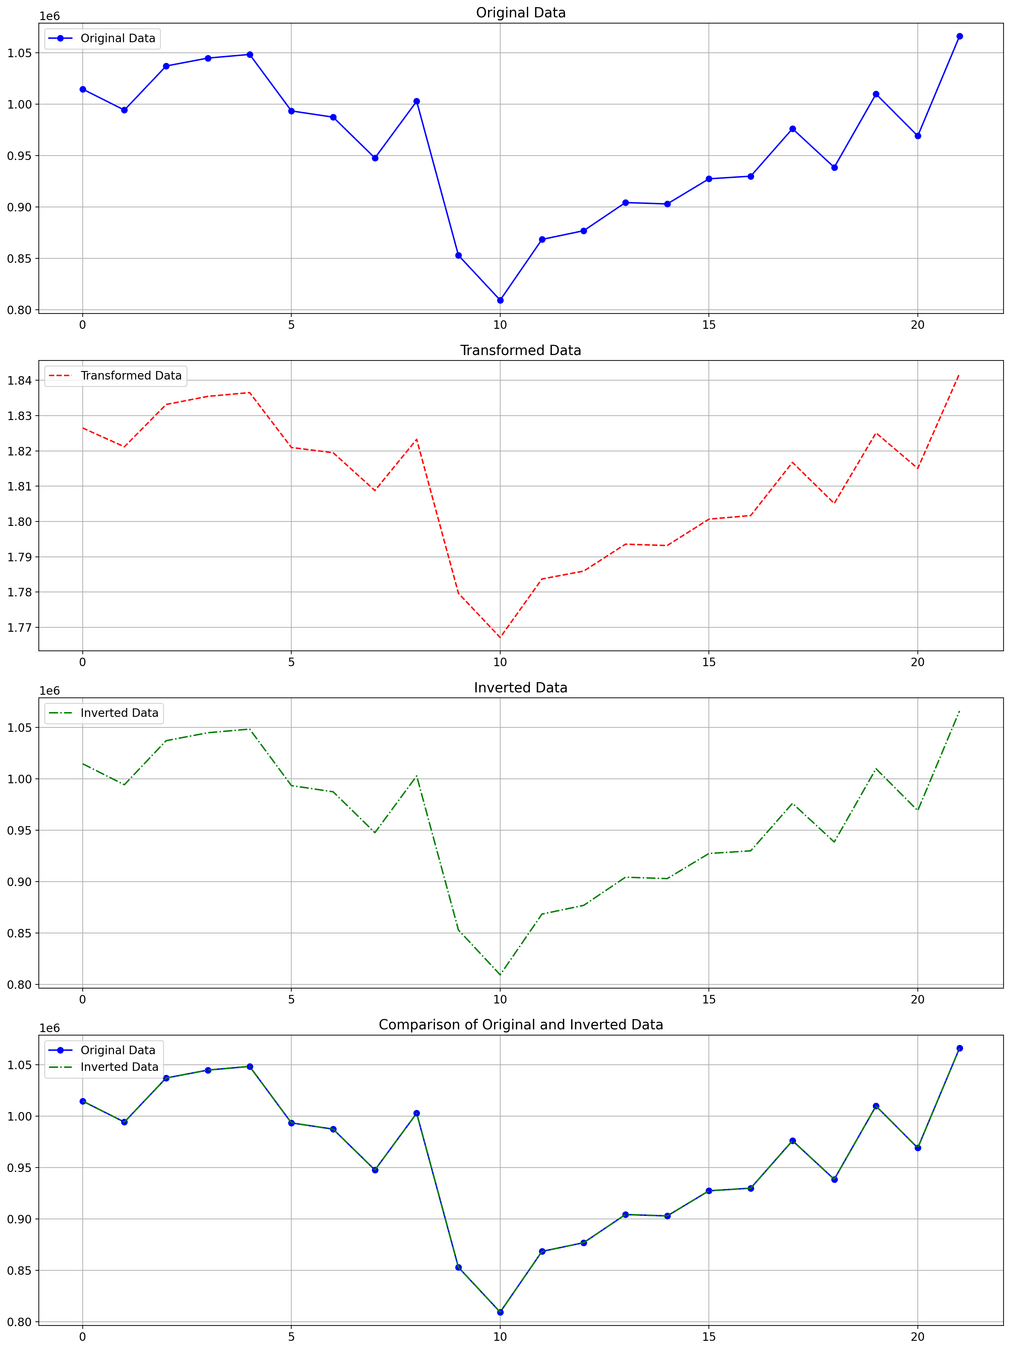
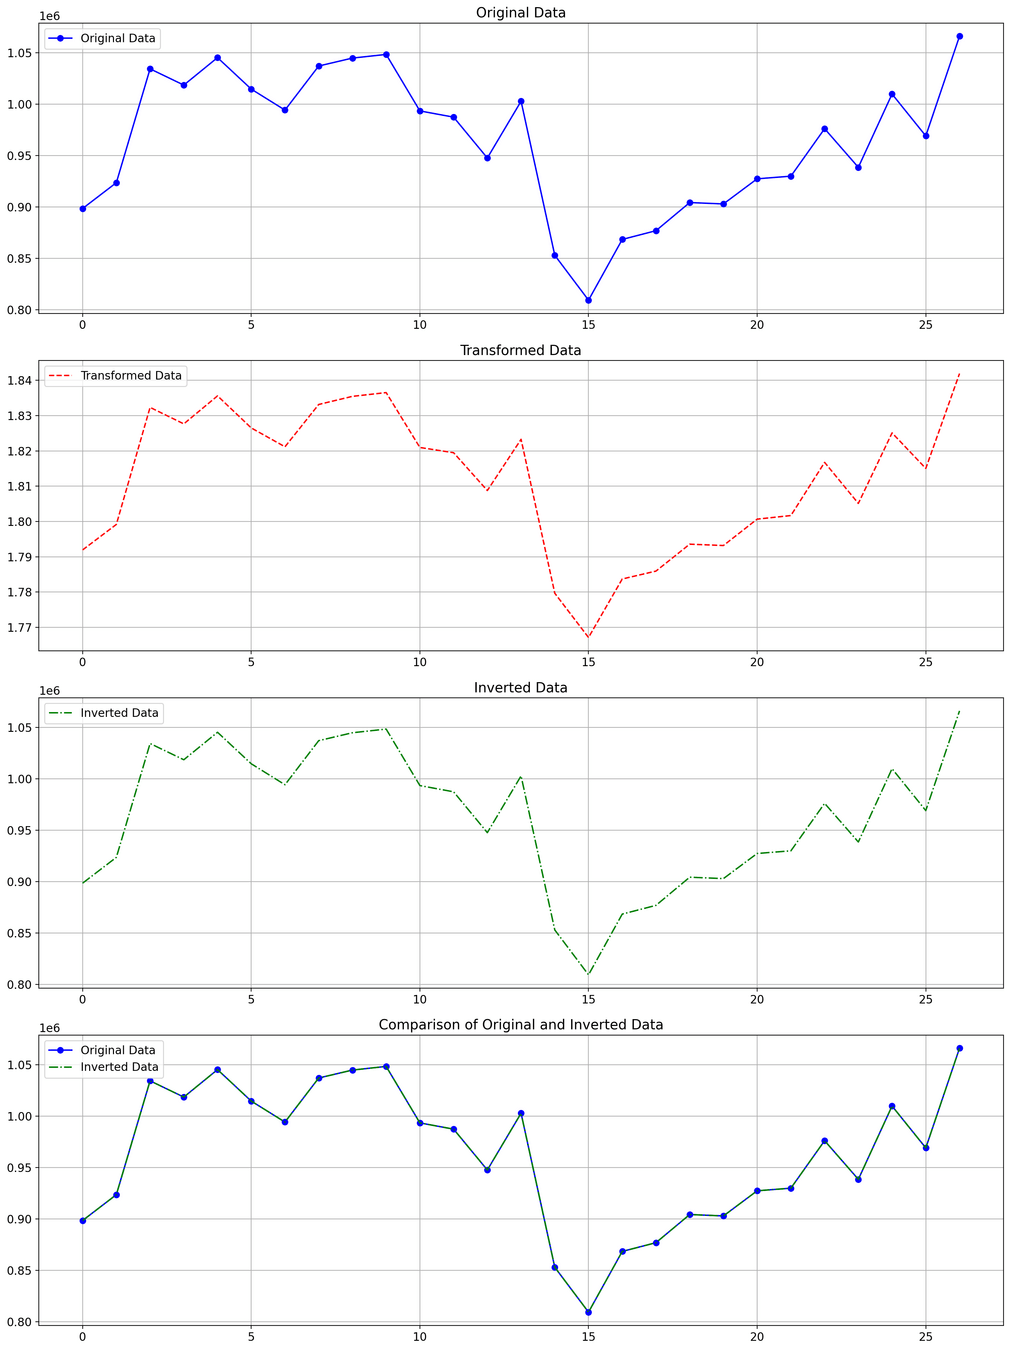
Simple EDA
| 2000 | 2001 | 2002 | ... | 2015 | 2016 | 2017 | 2018 | 2019 | 2020 |
|---|---|---|---|---|---|---|---|---|---|
| 1014592 | 994200 | 1037062 | ... | 929944 |
976112 | 938530 | 1009810 | 969060 | 1066010 |
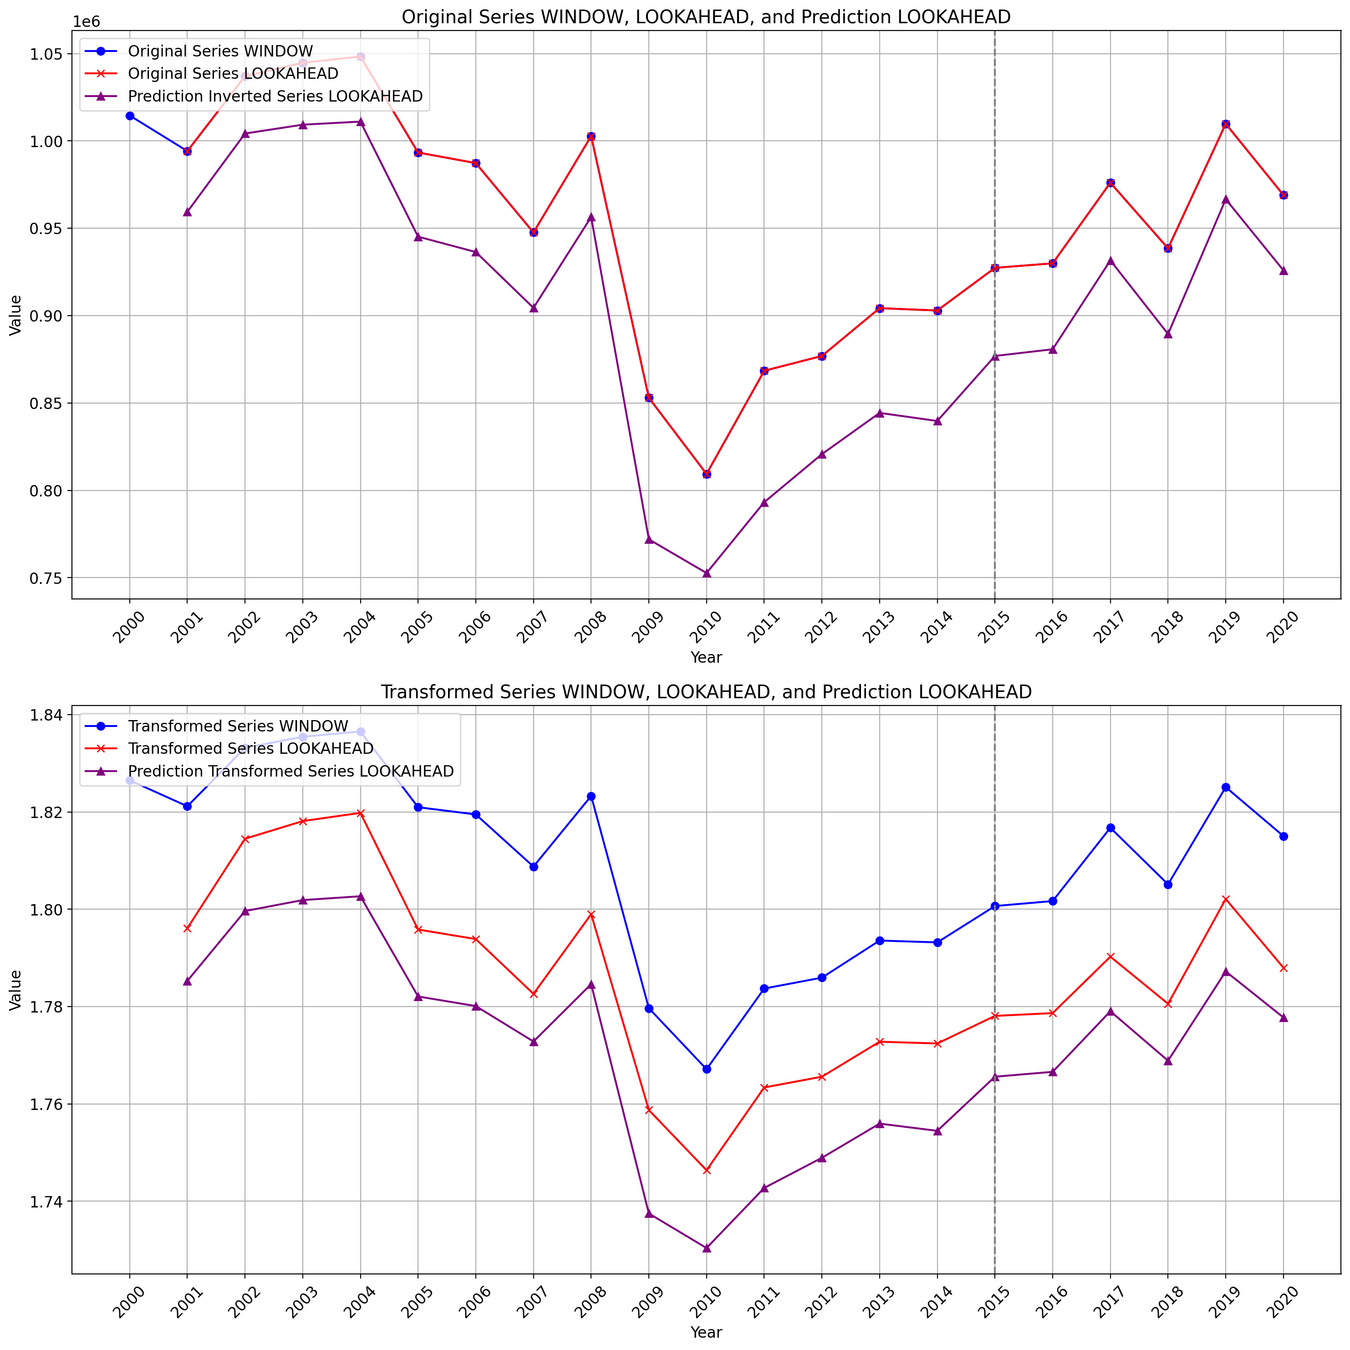
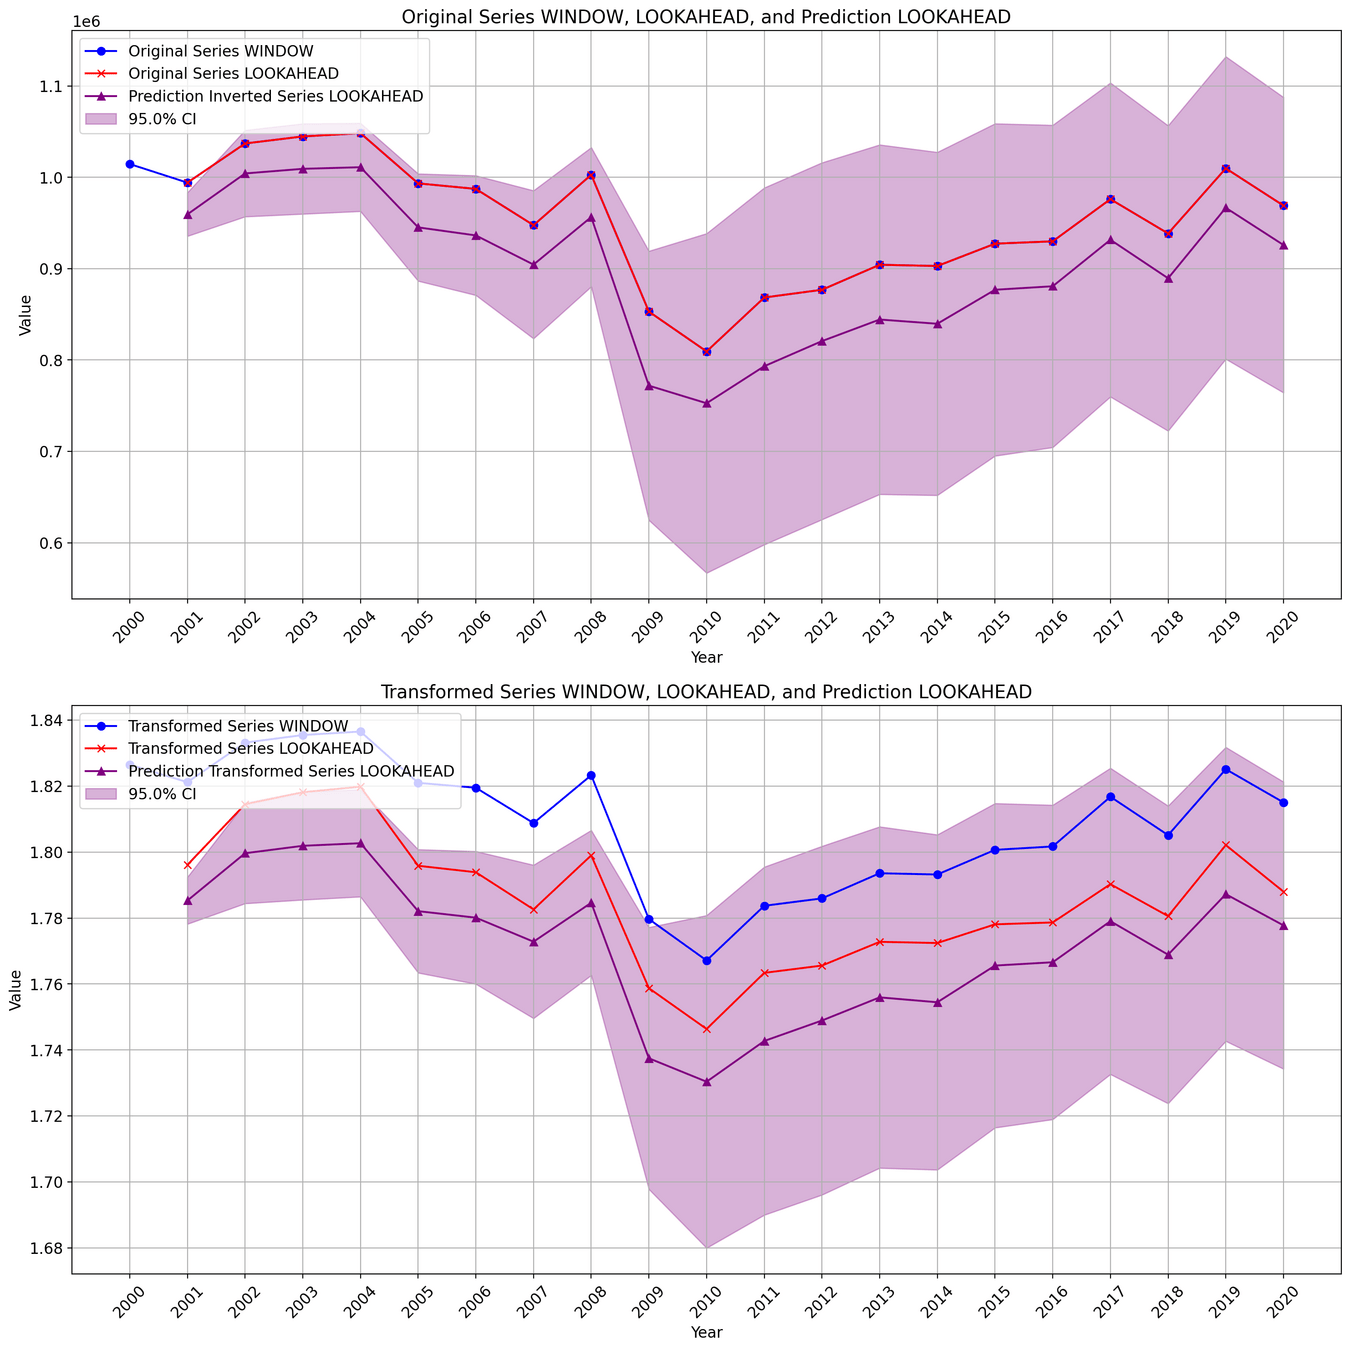
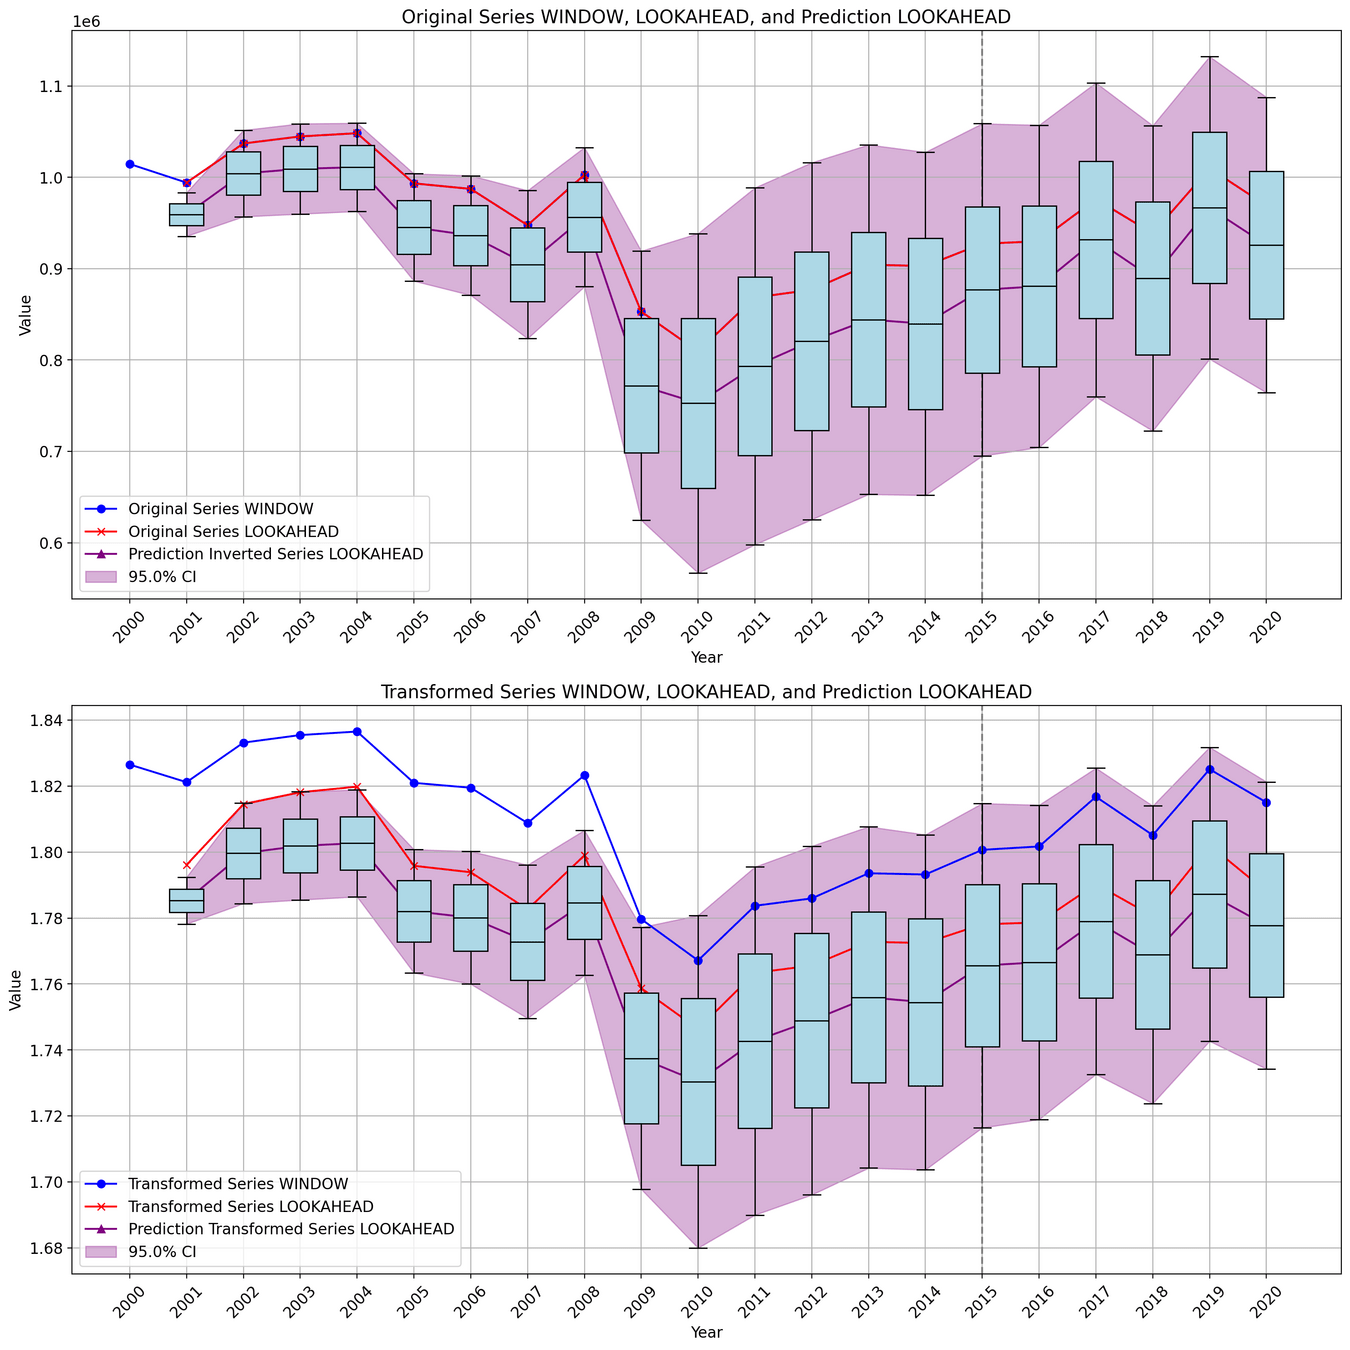
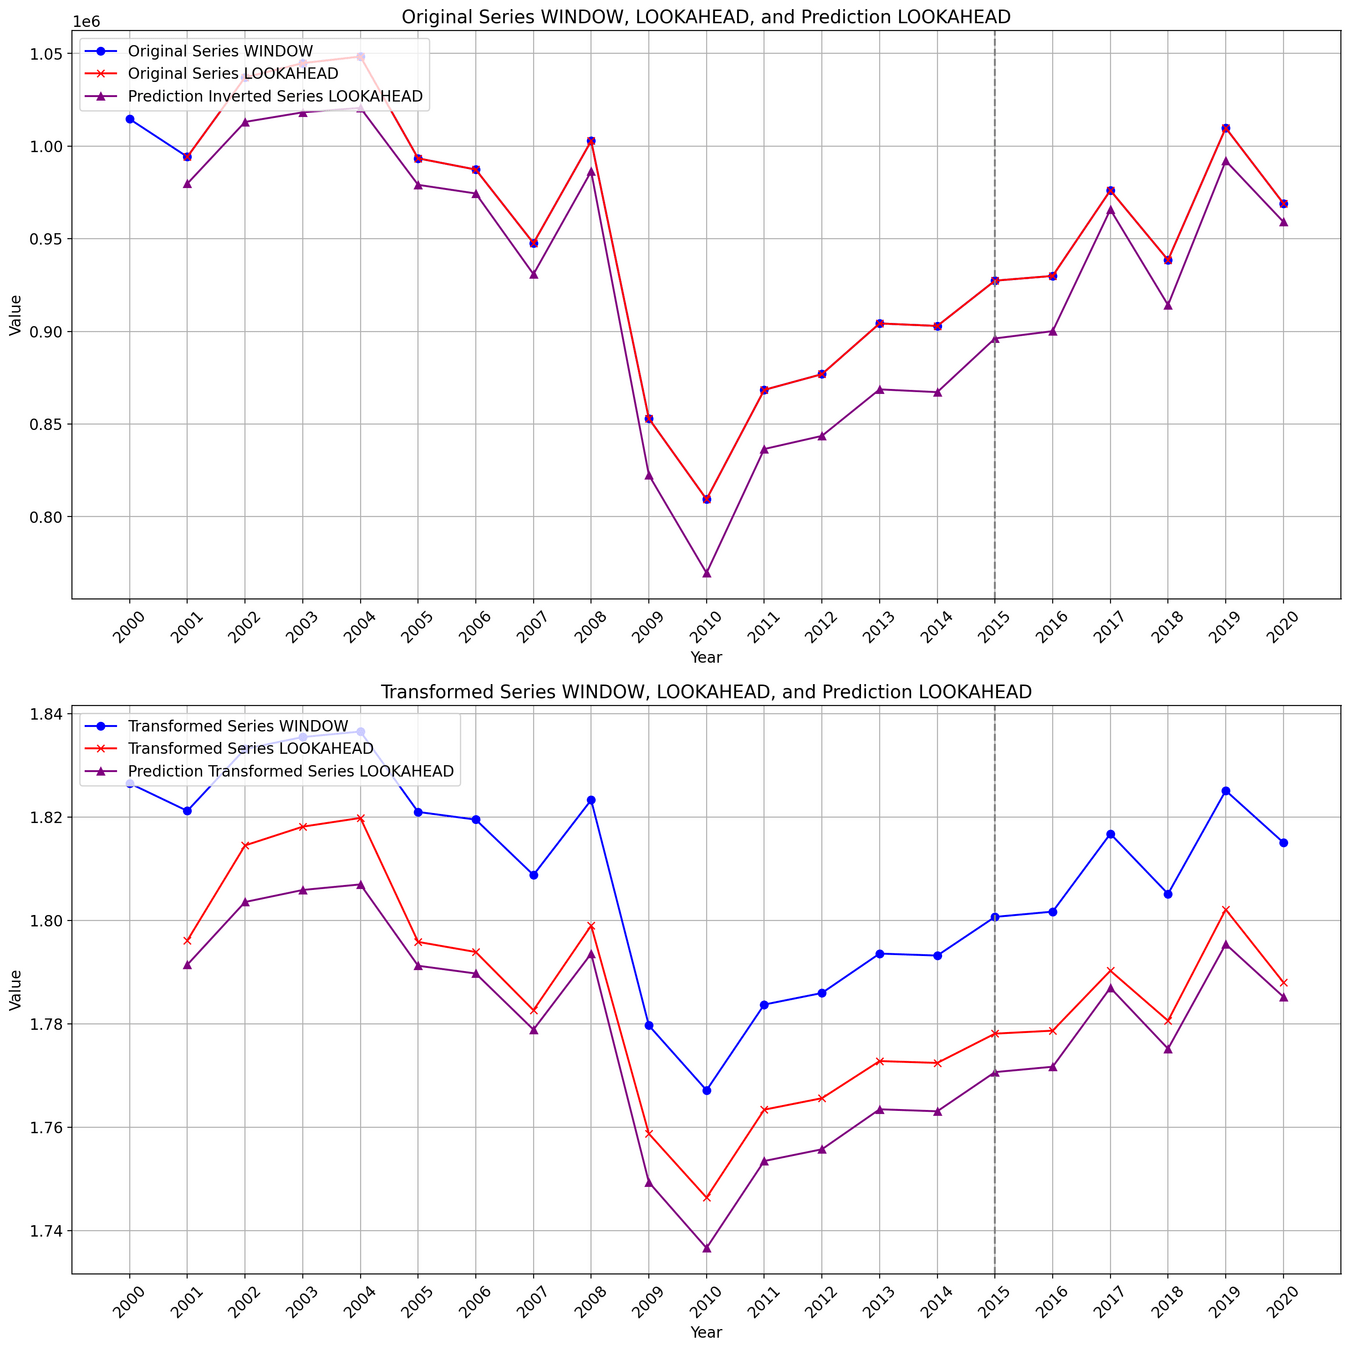
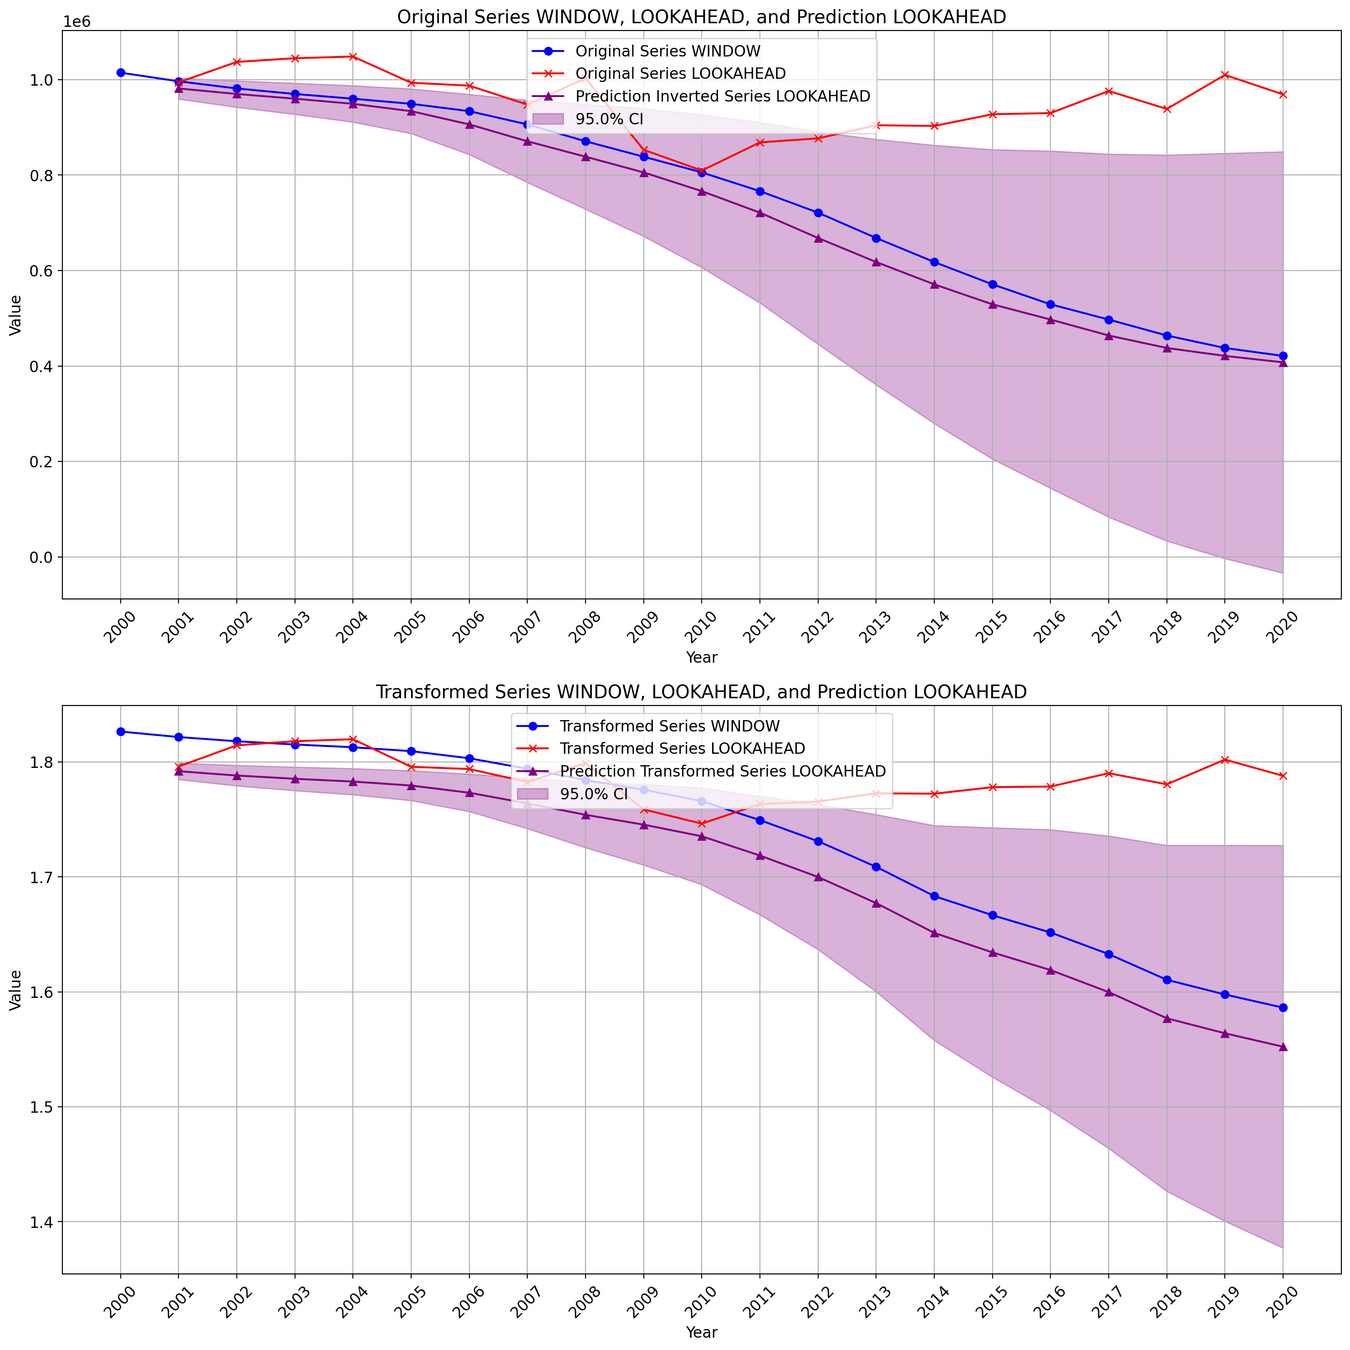
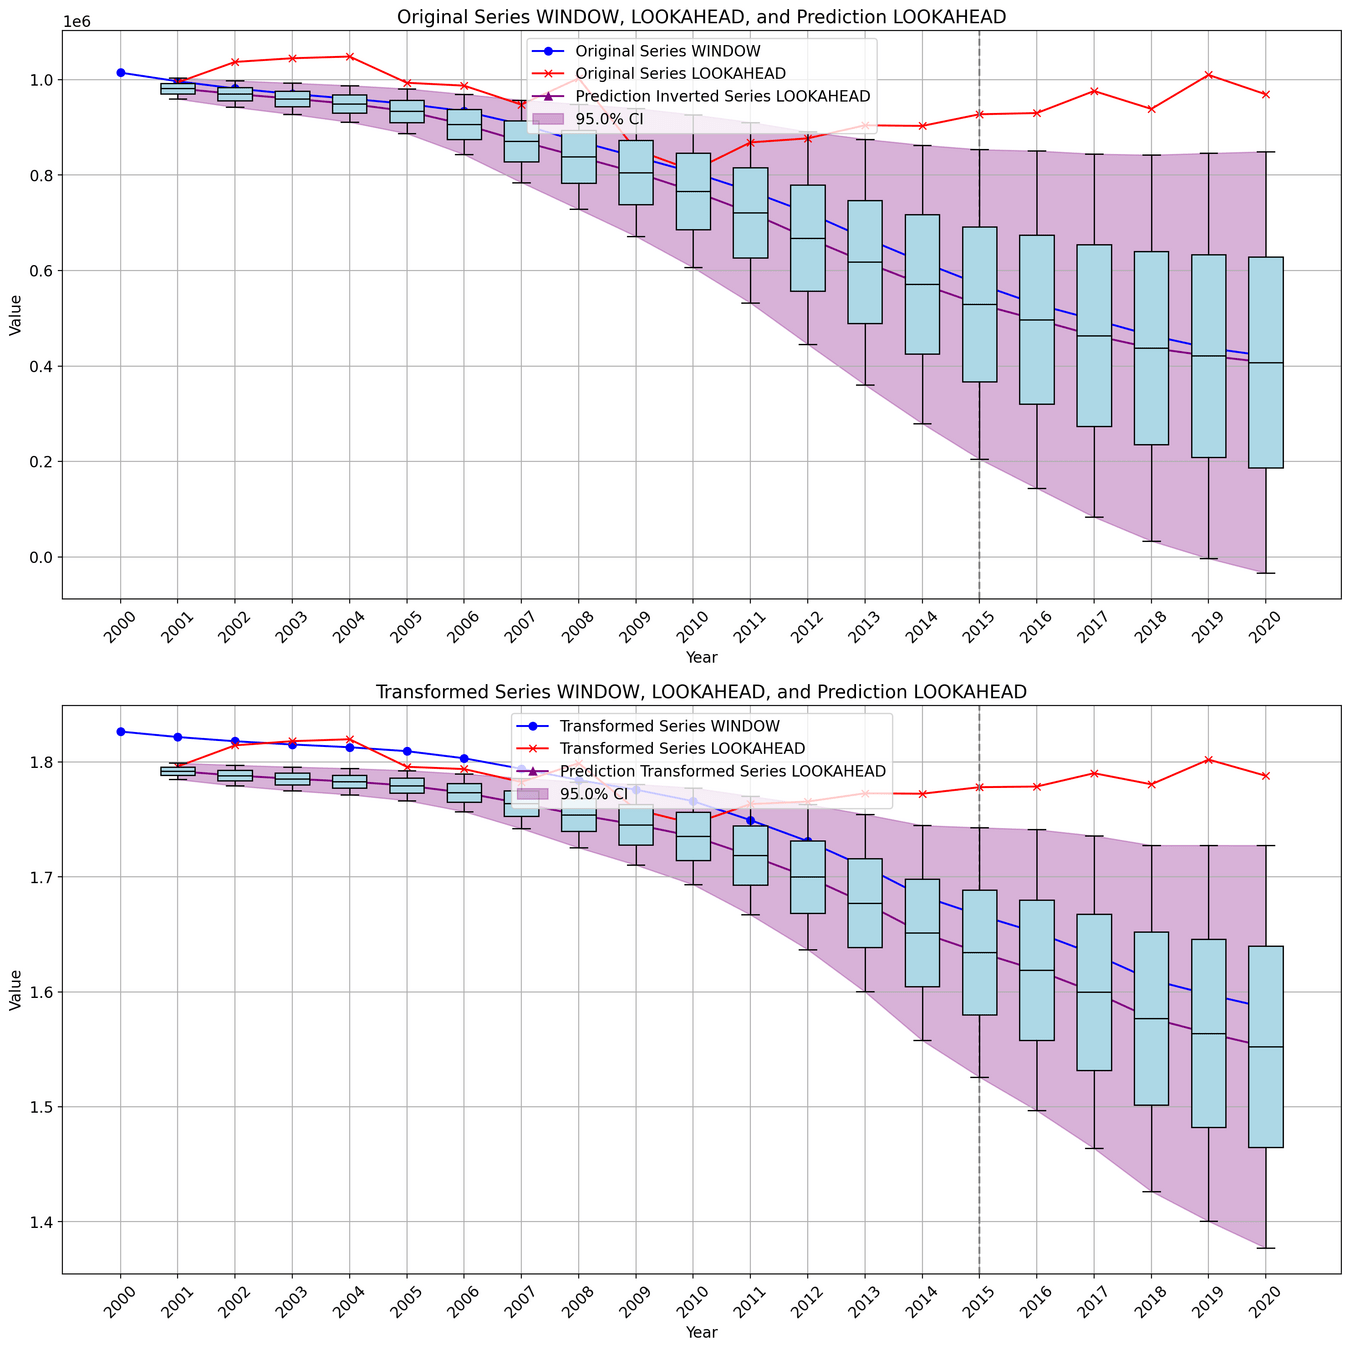
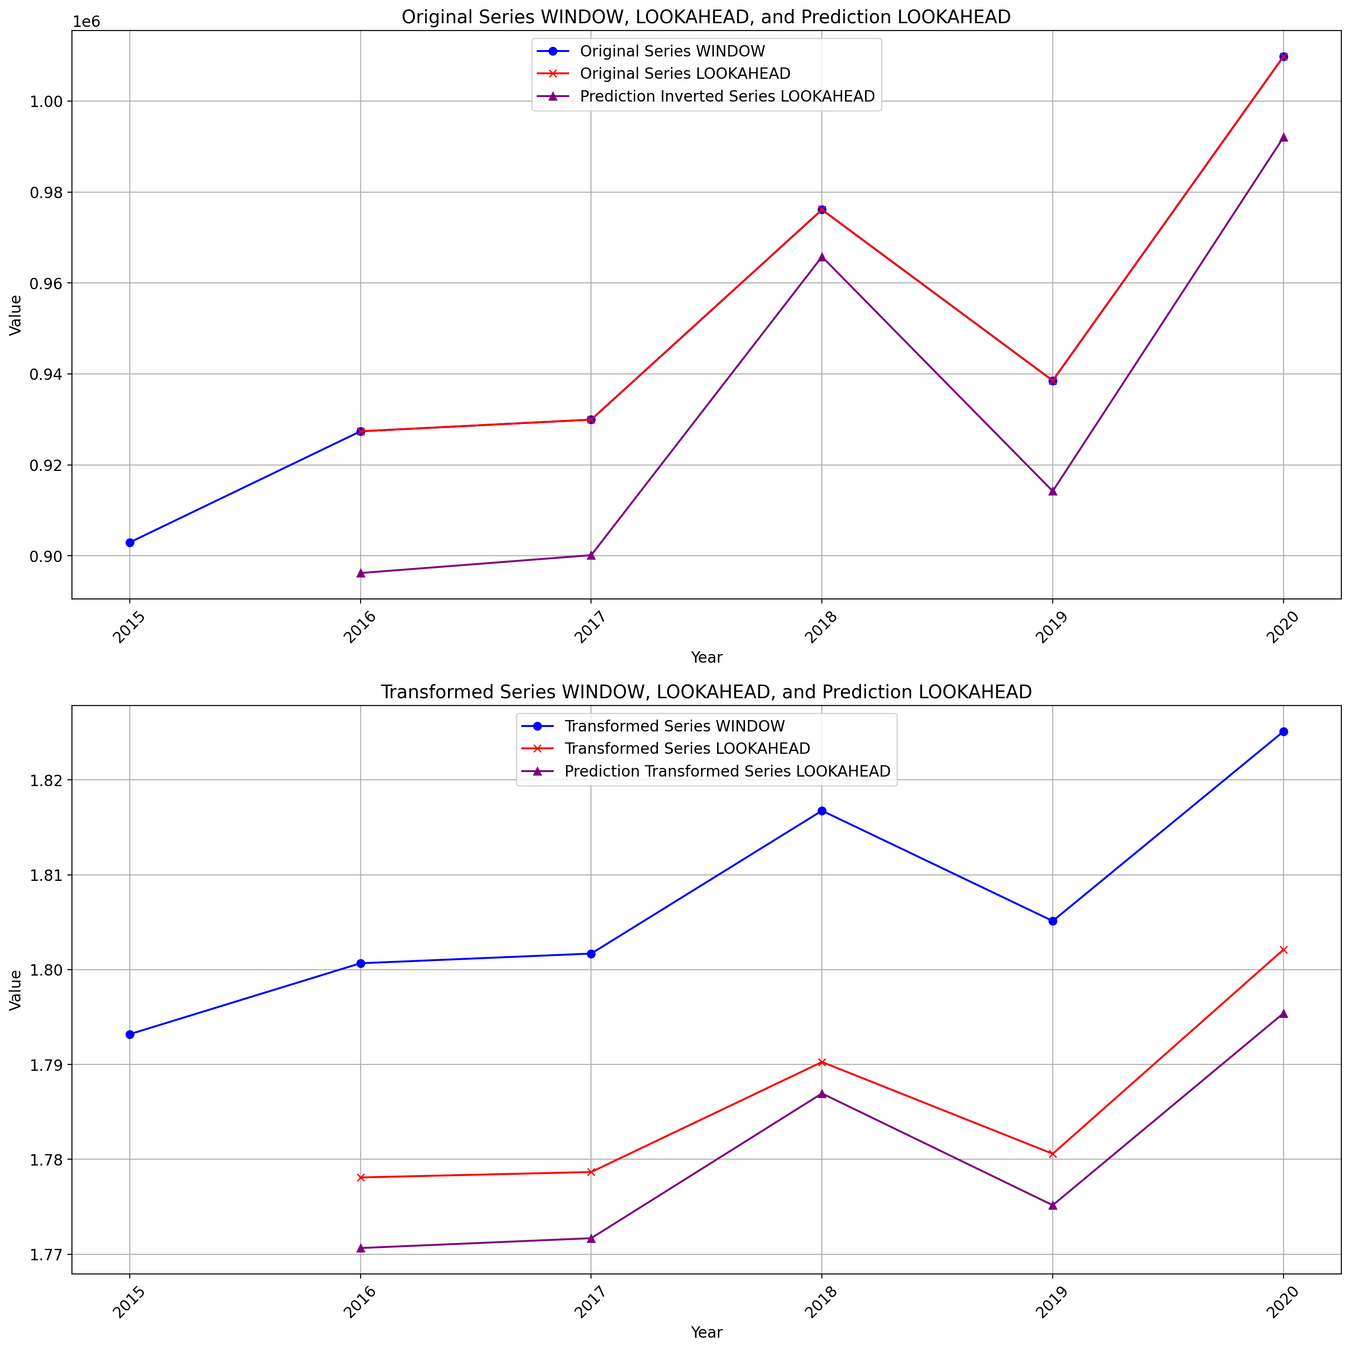
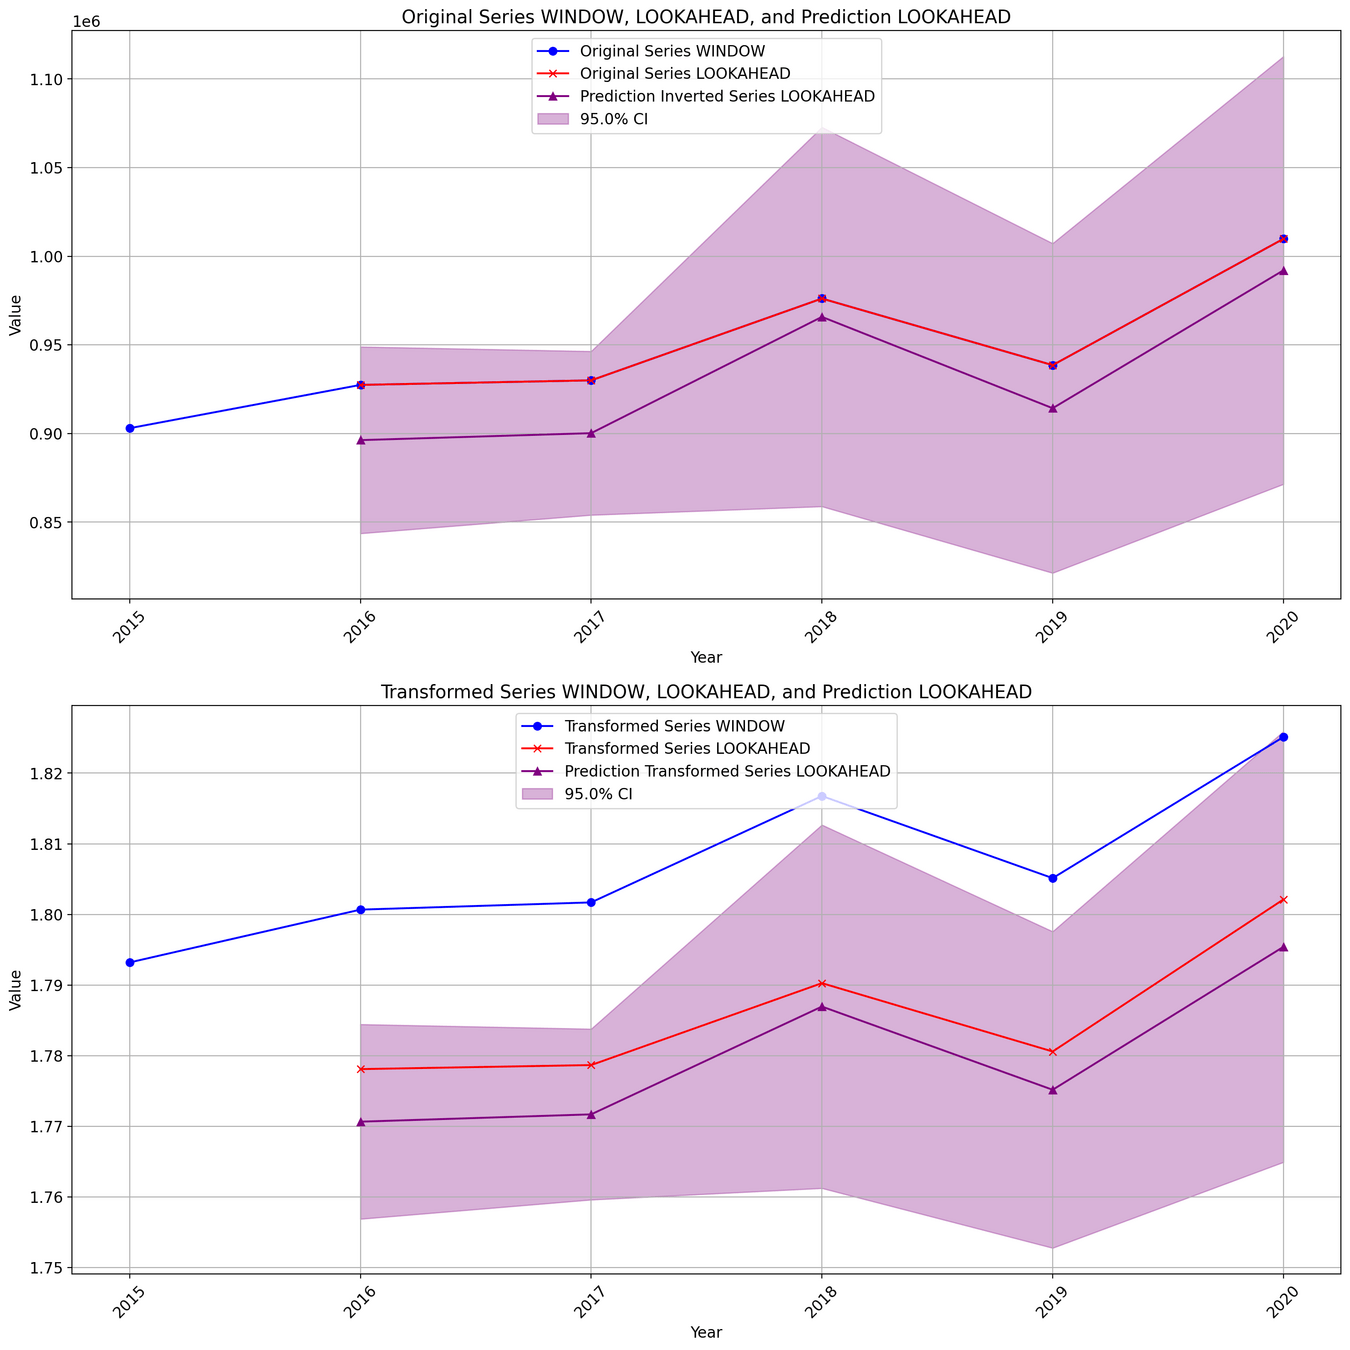
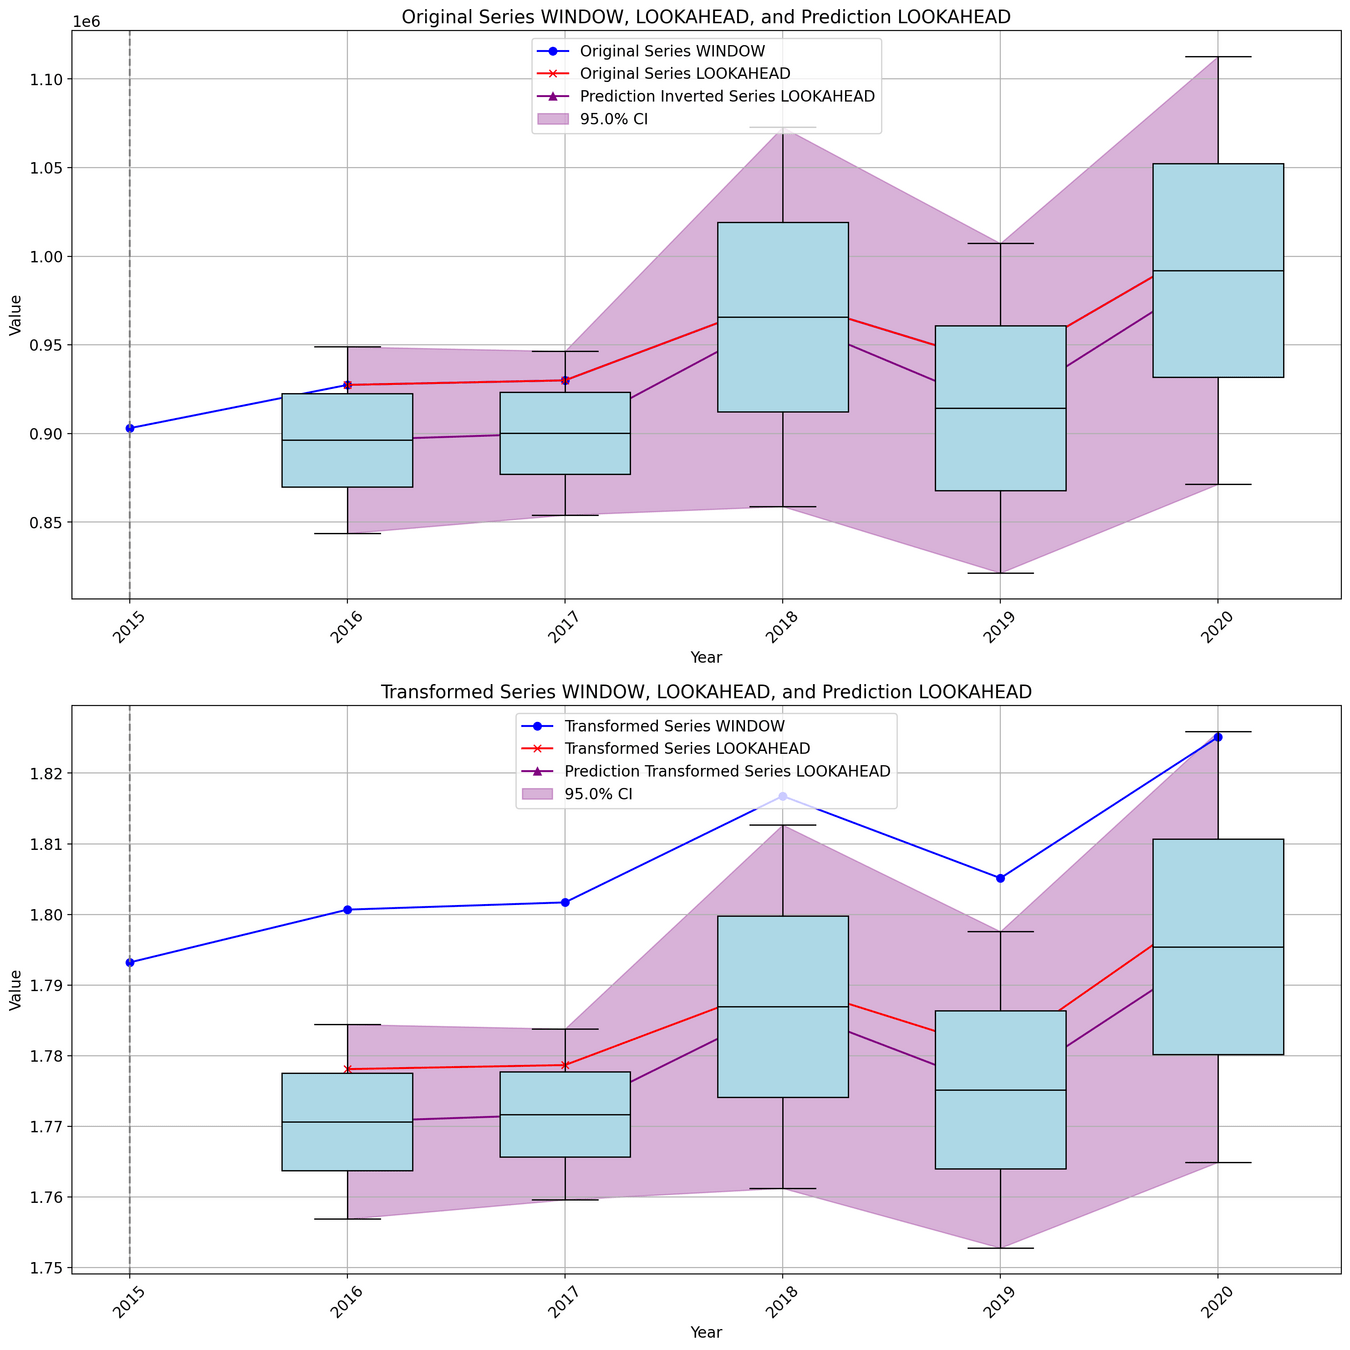
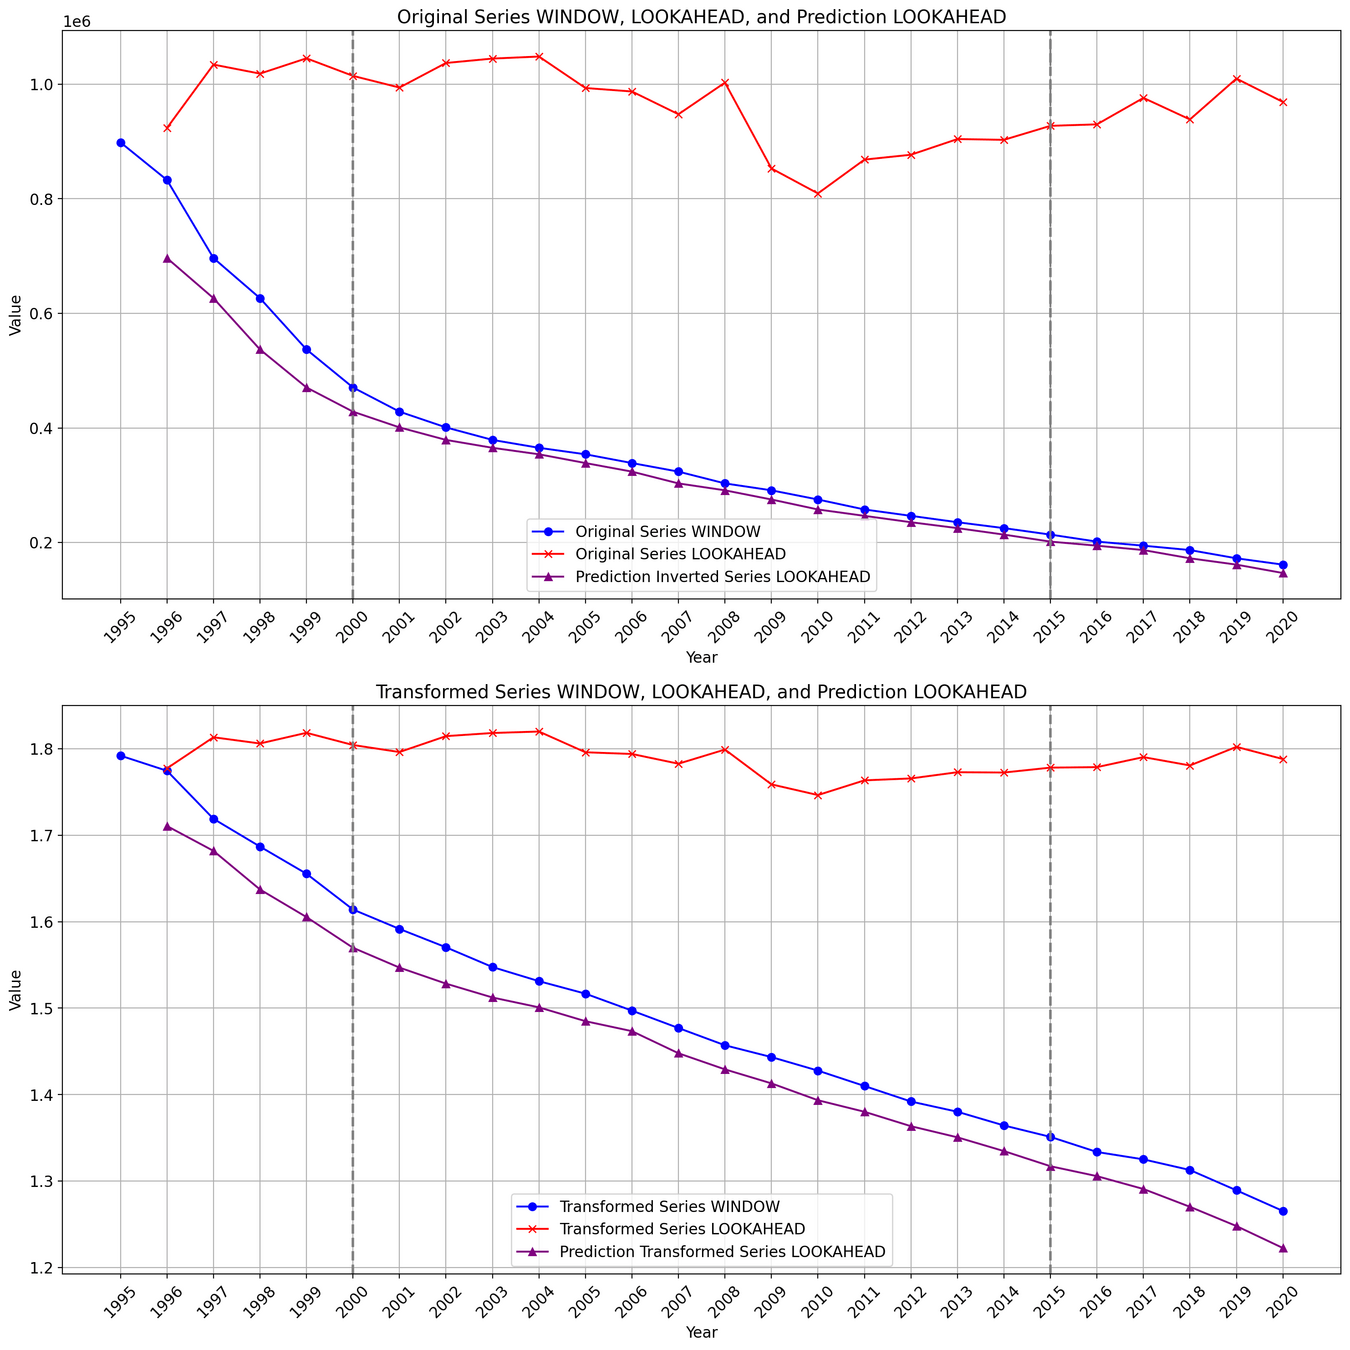
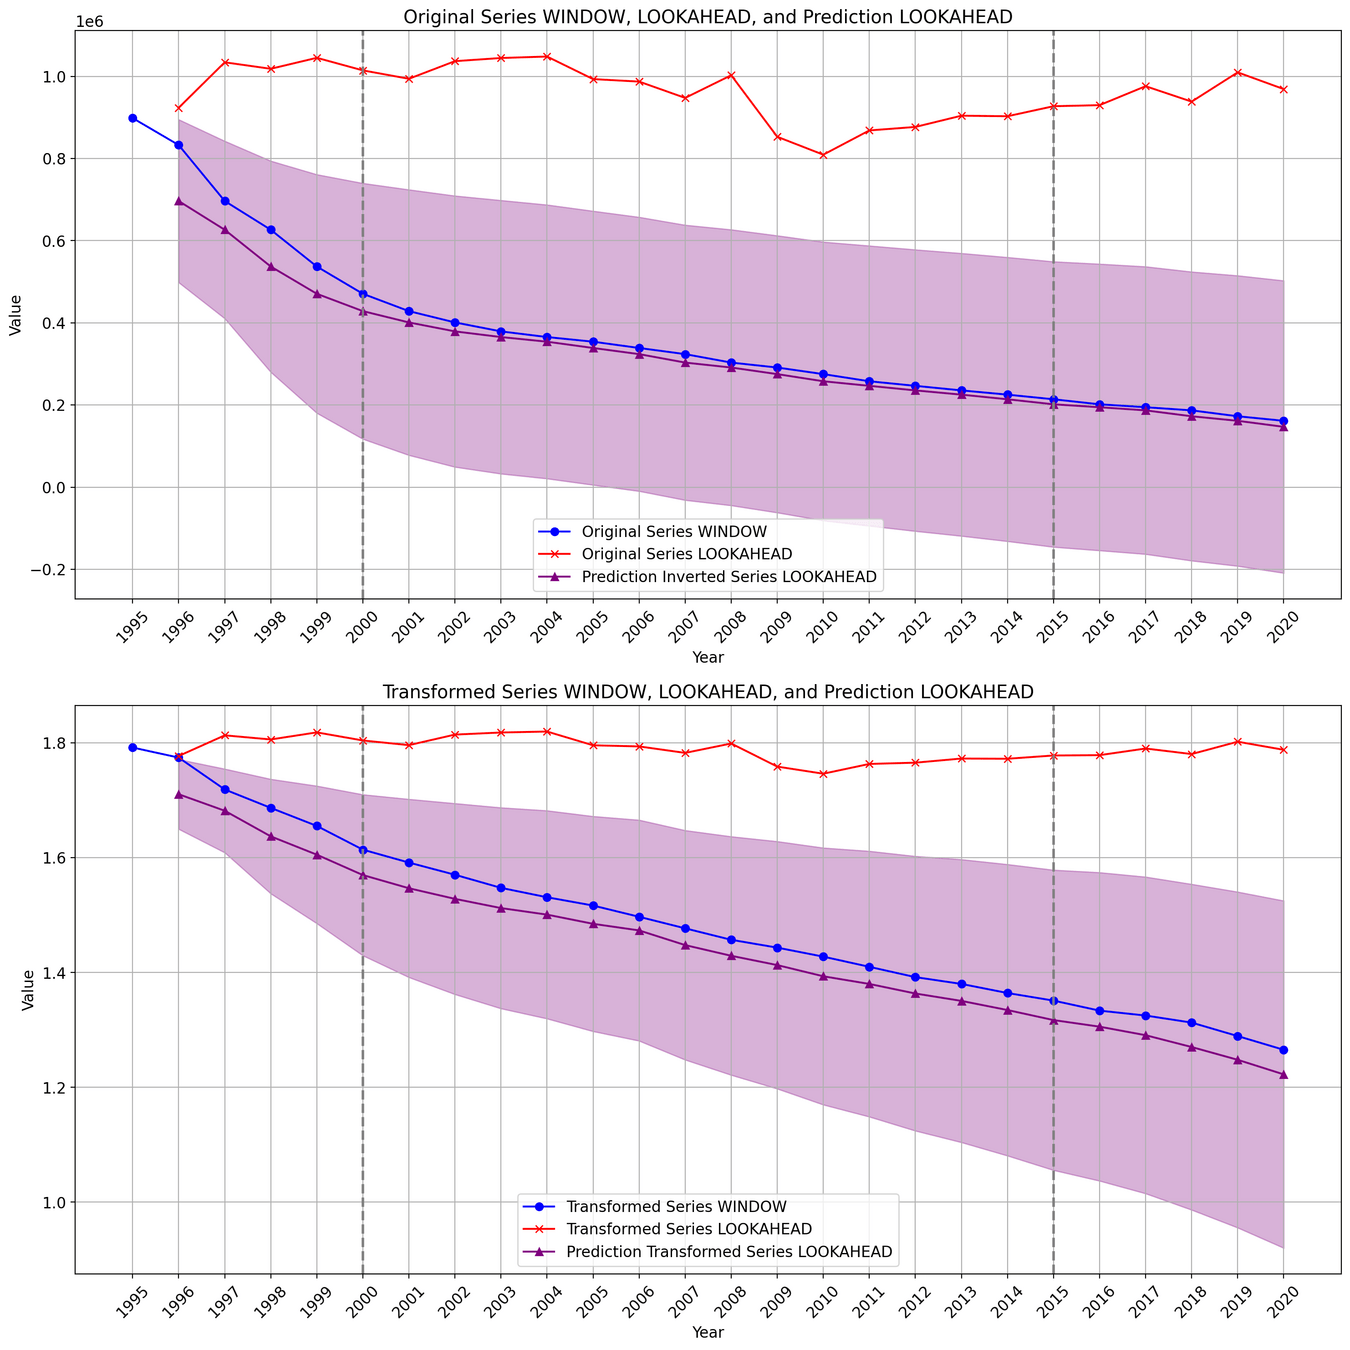
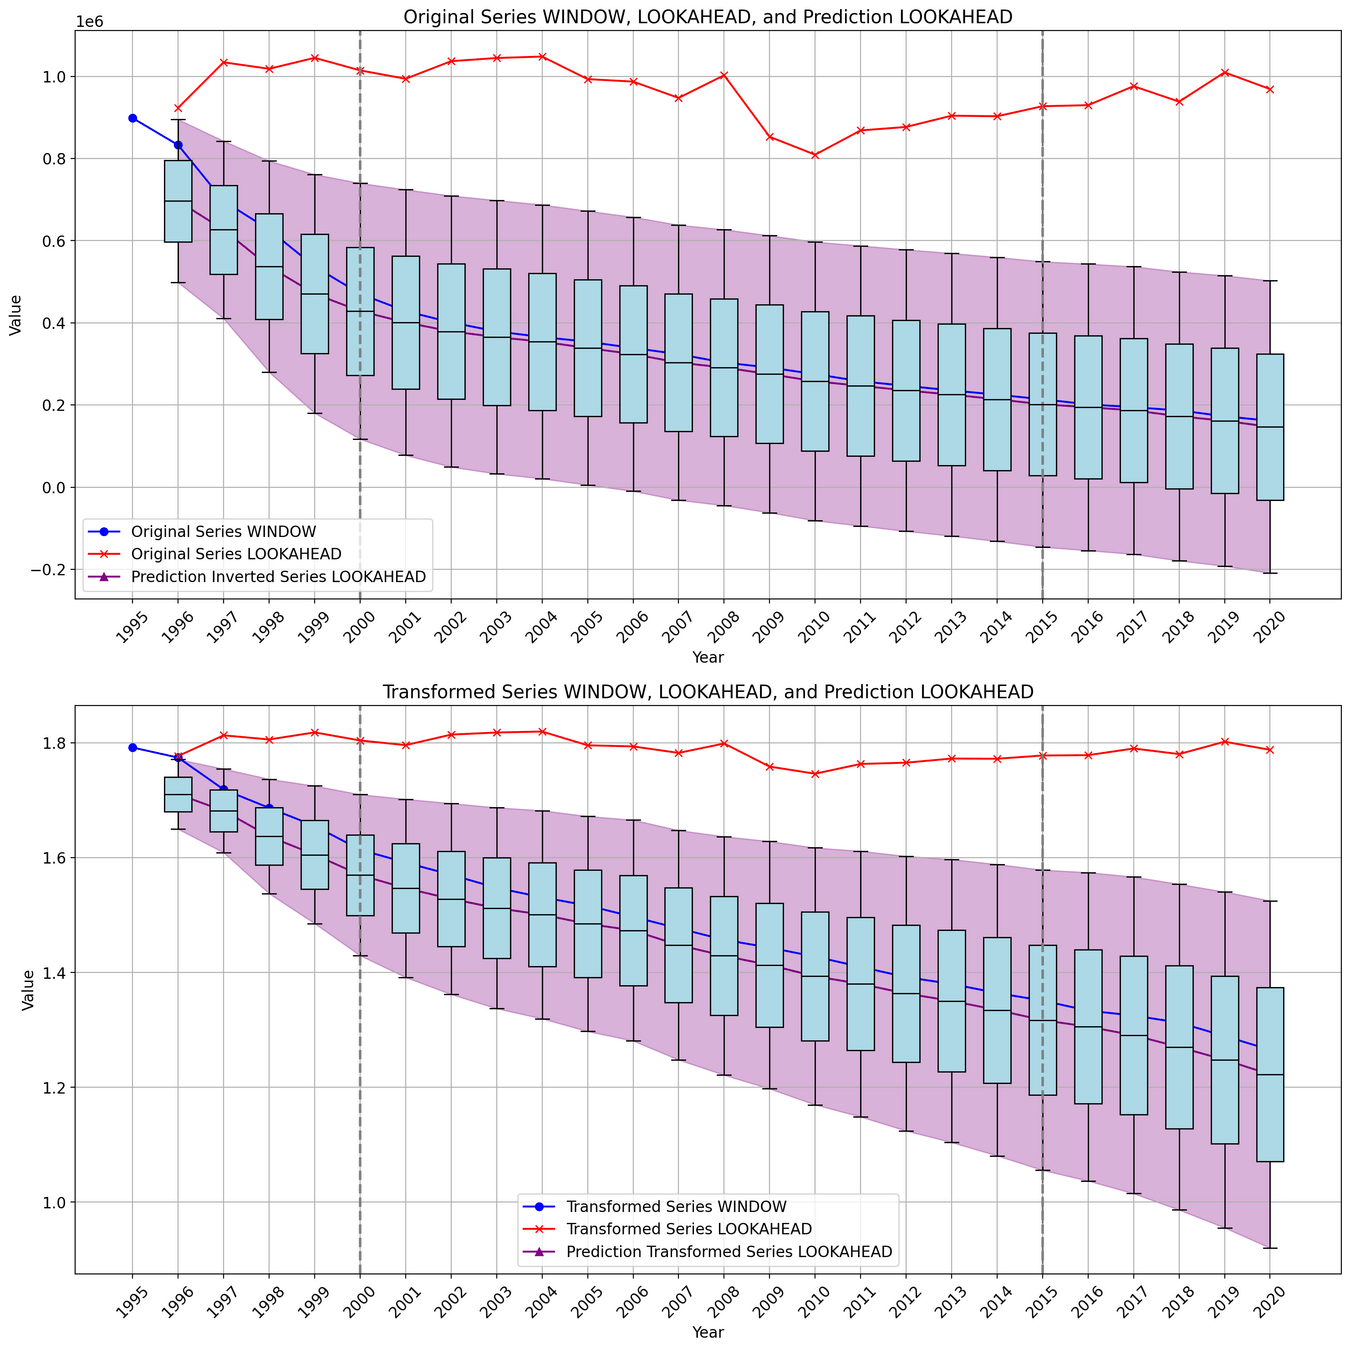
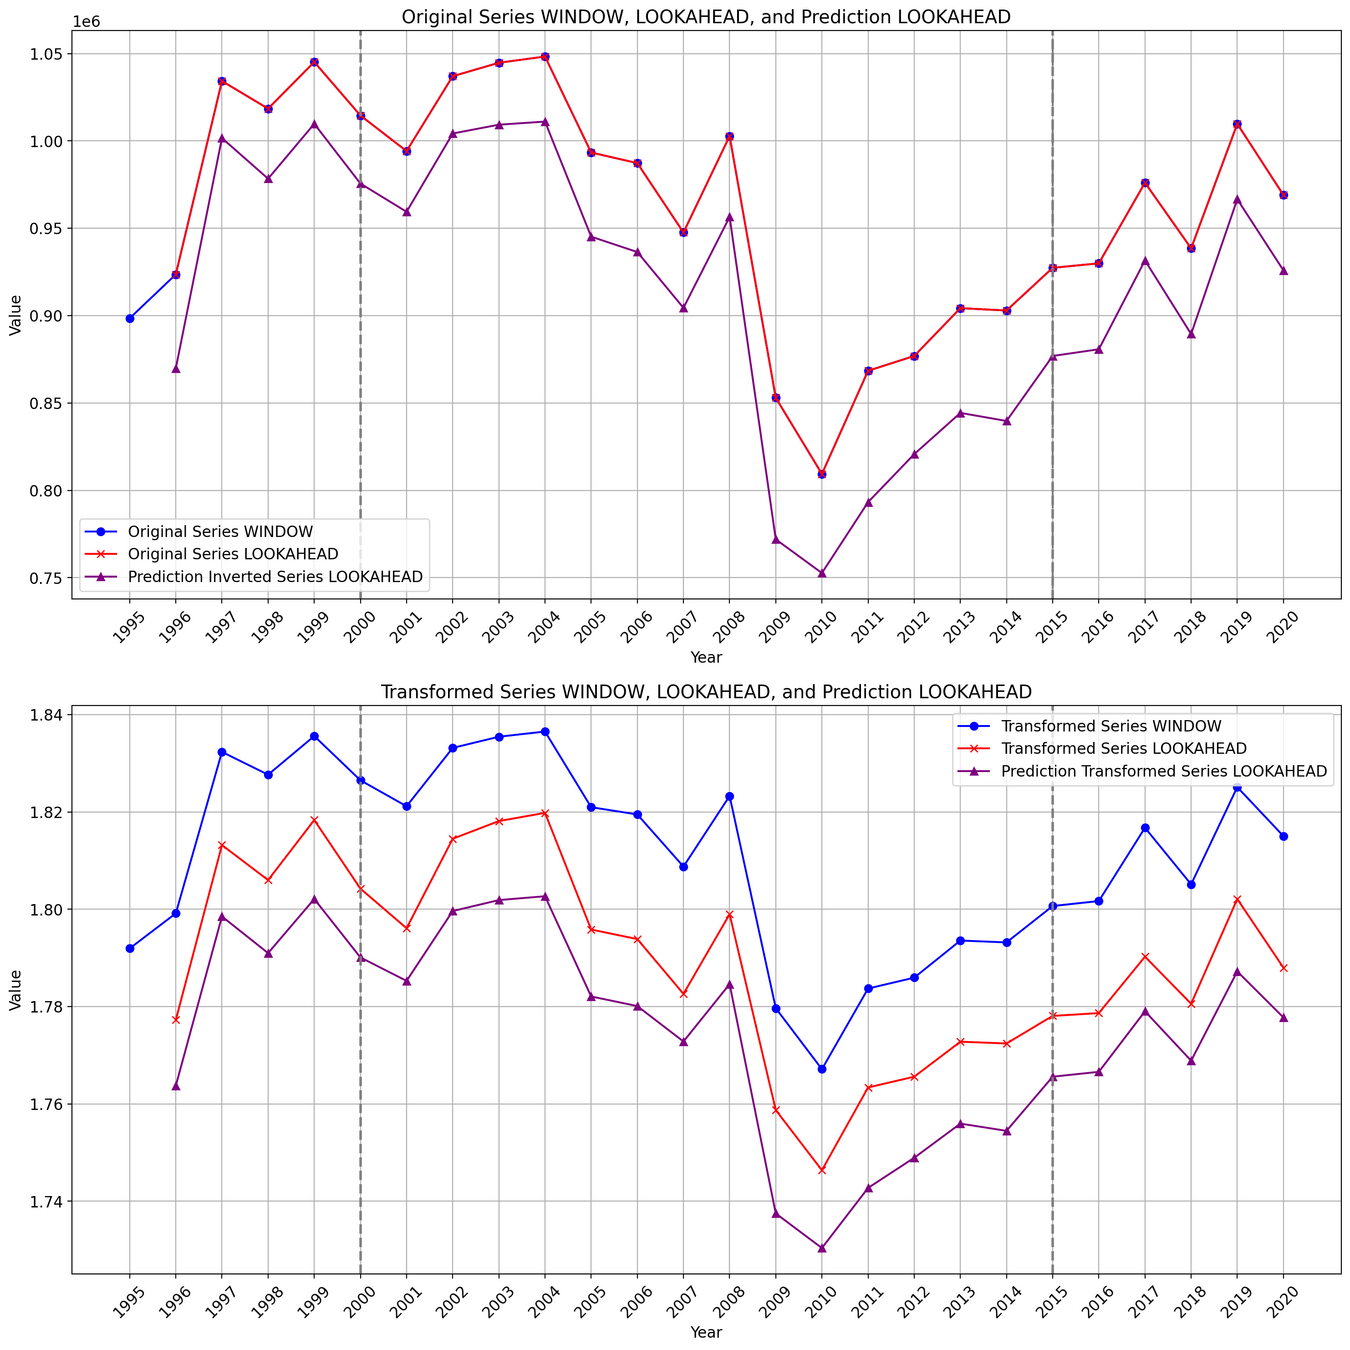
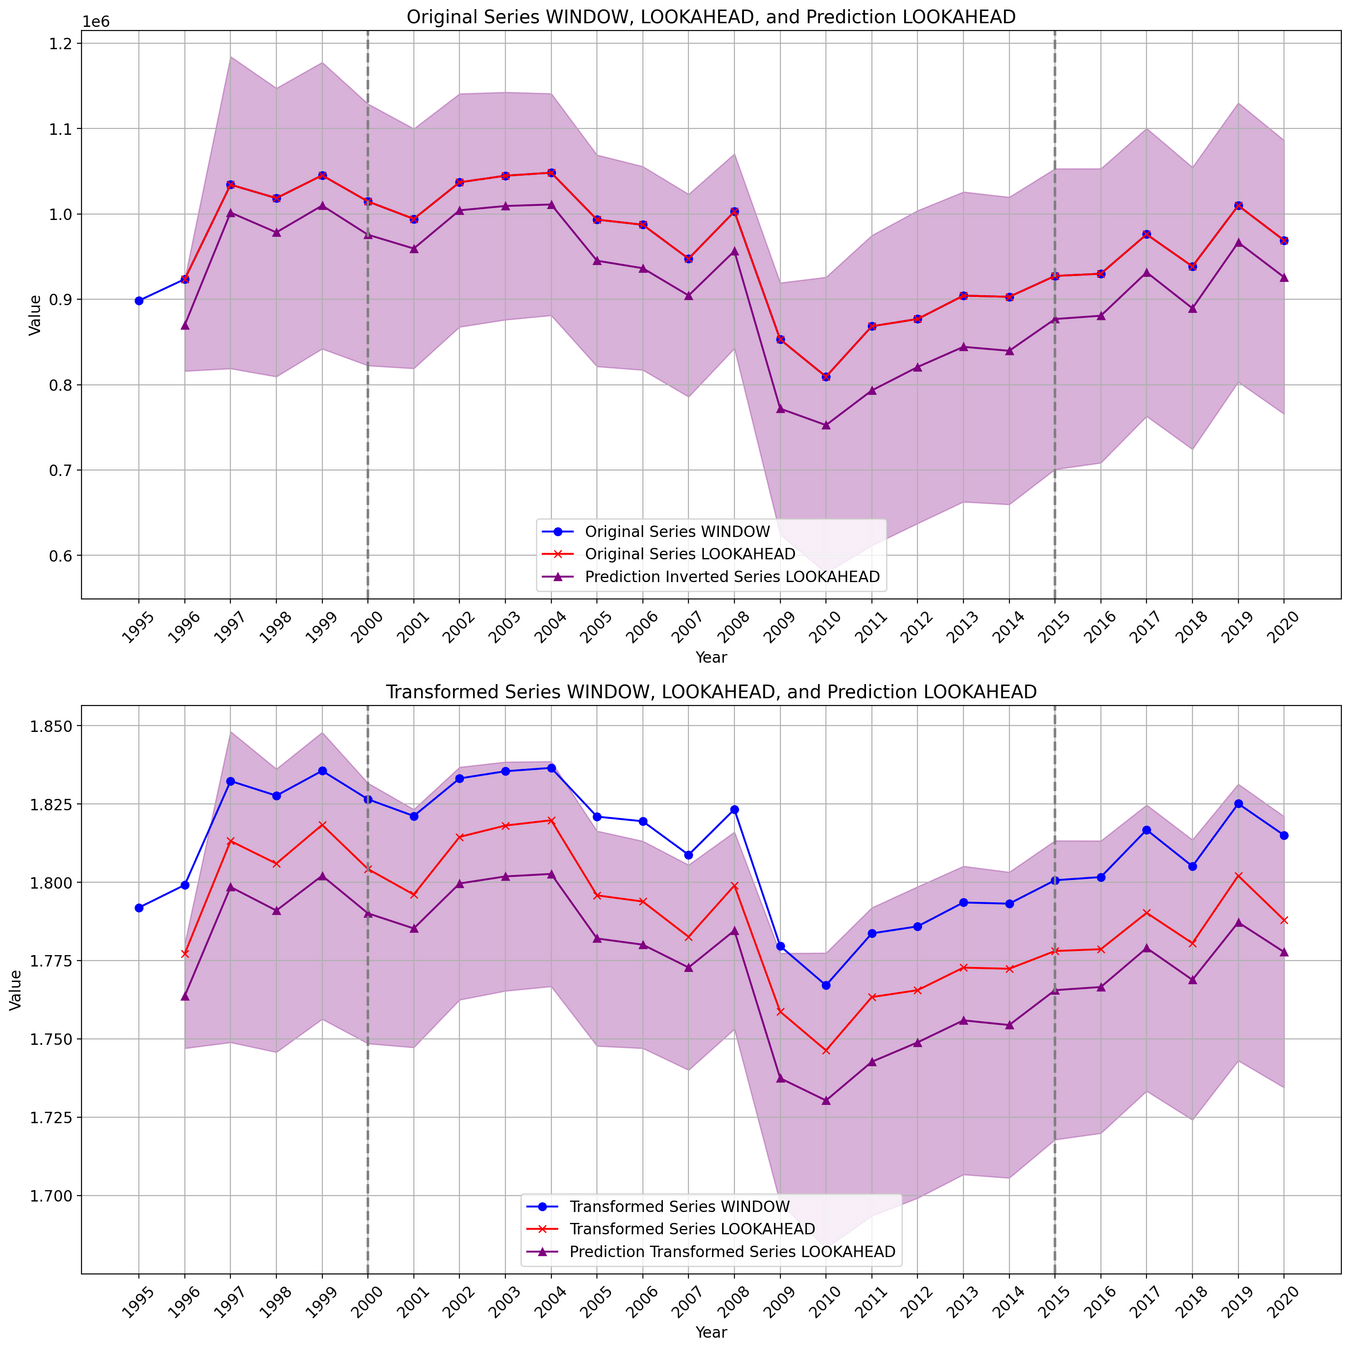
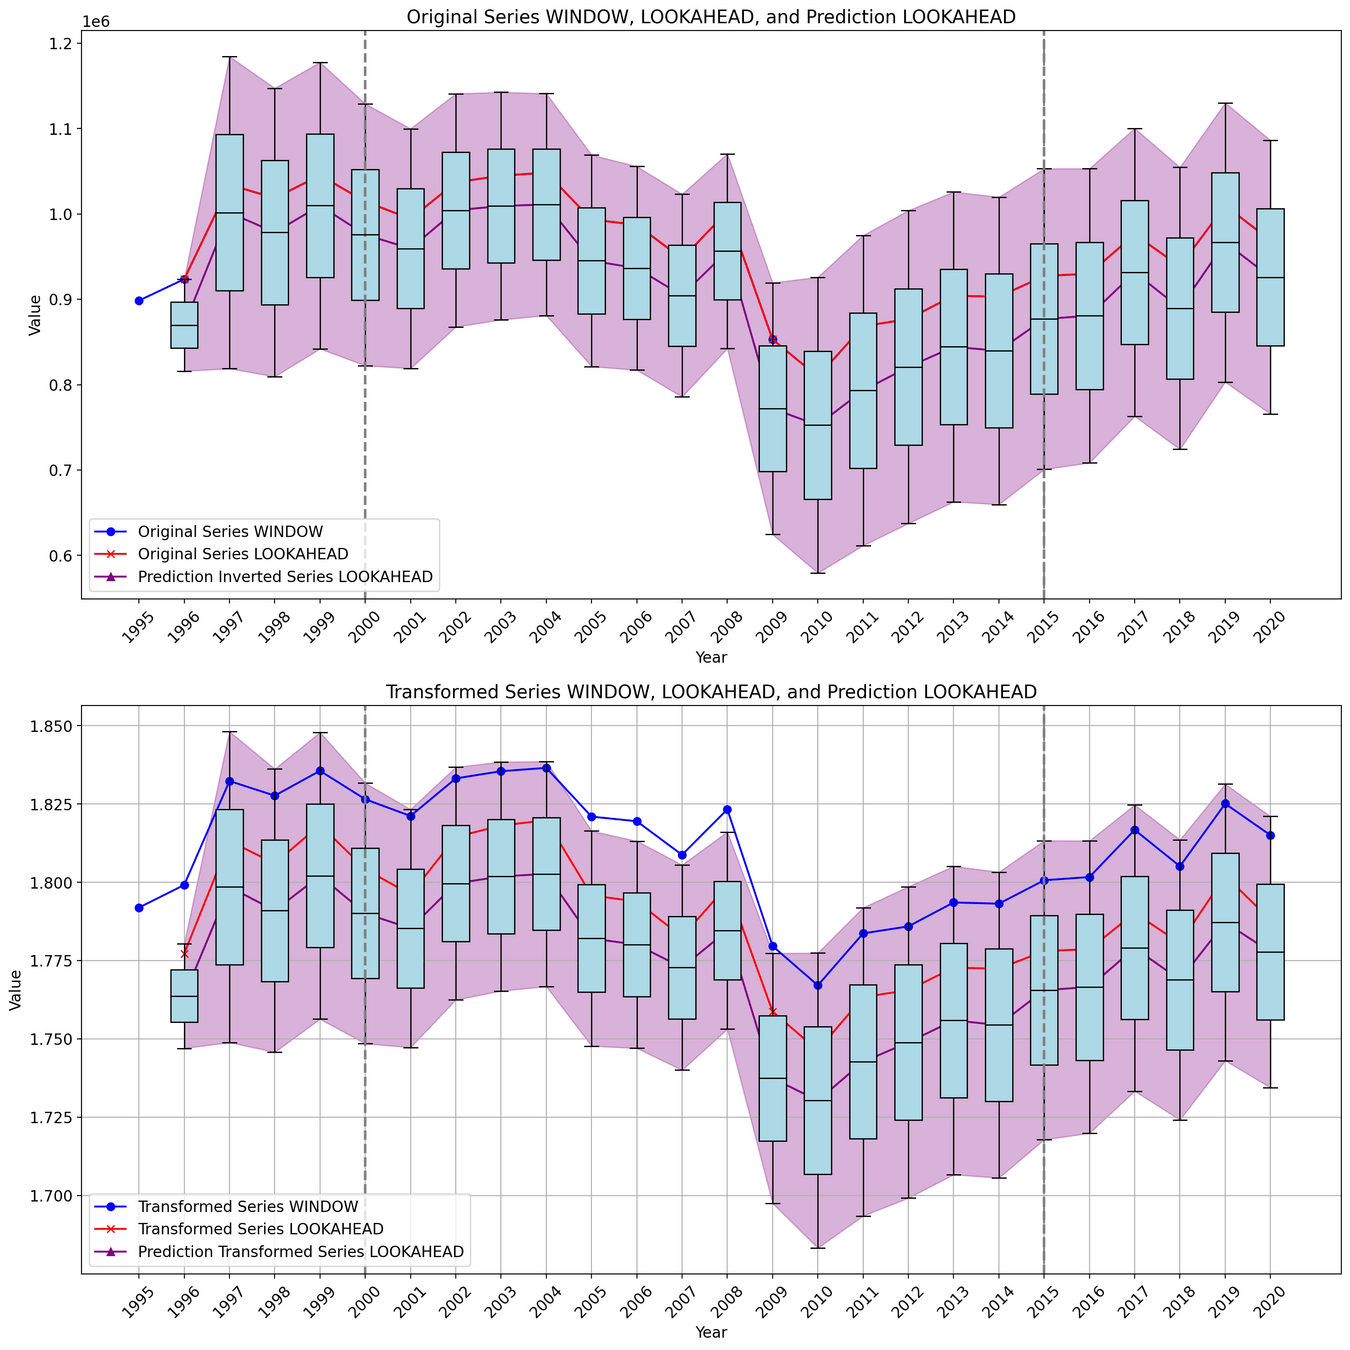
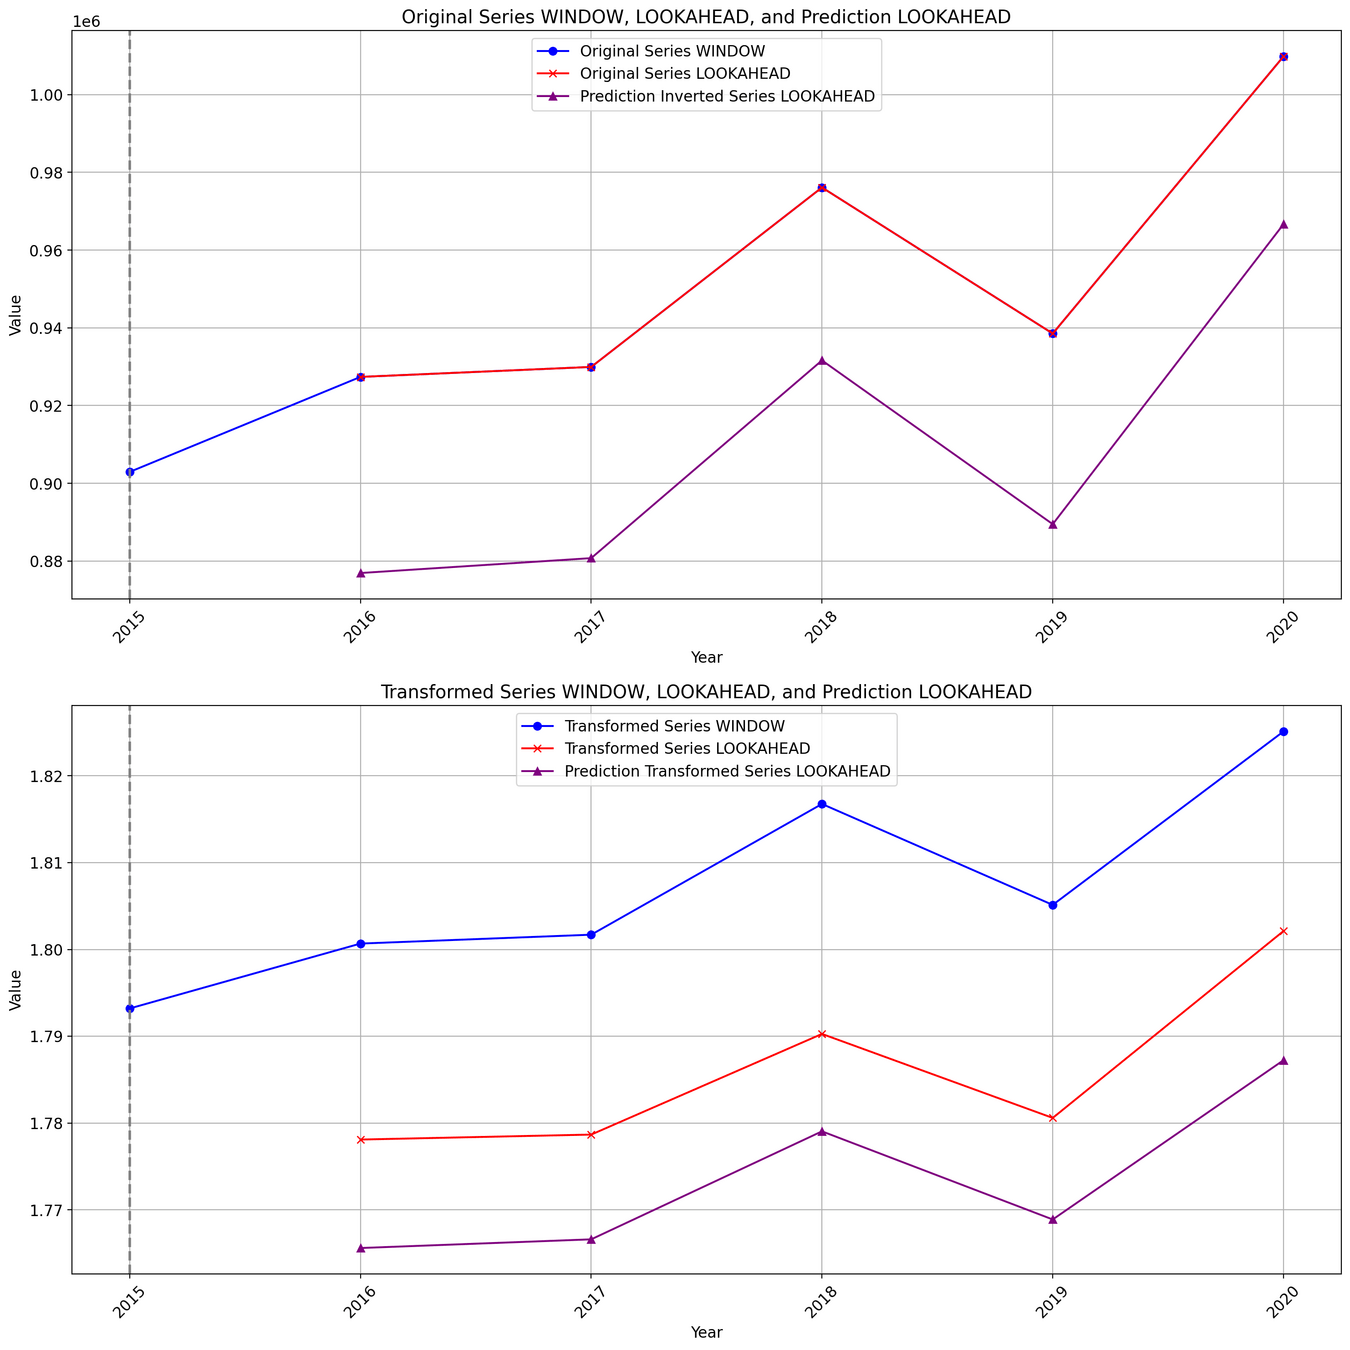
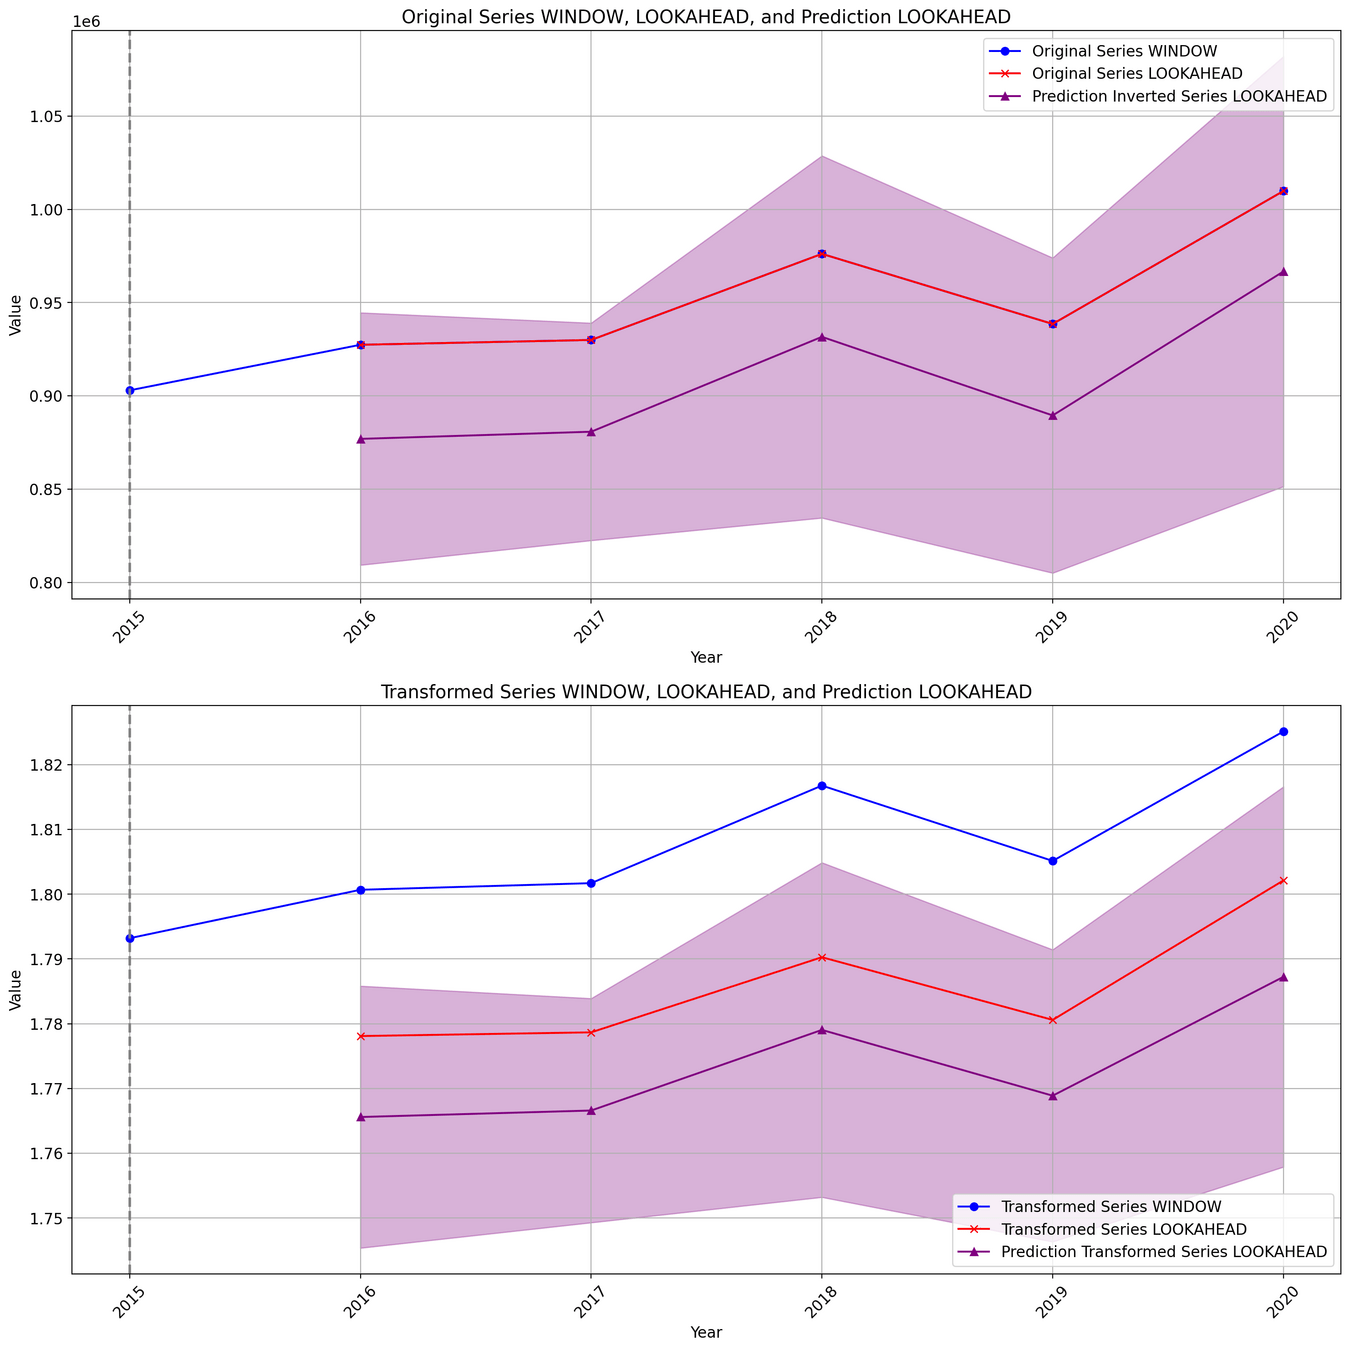
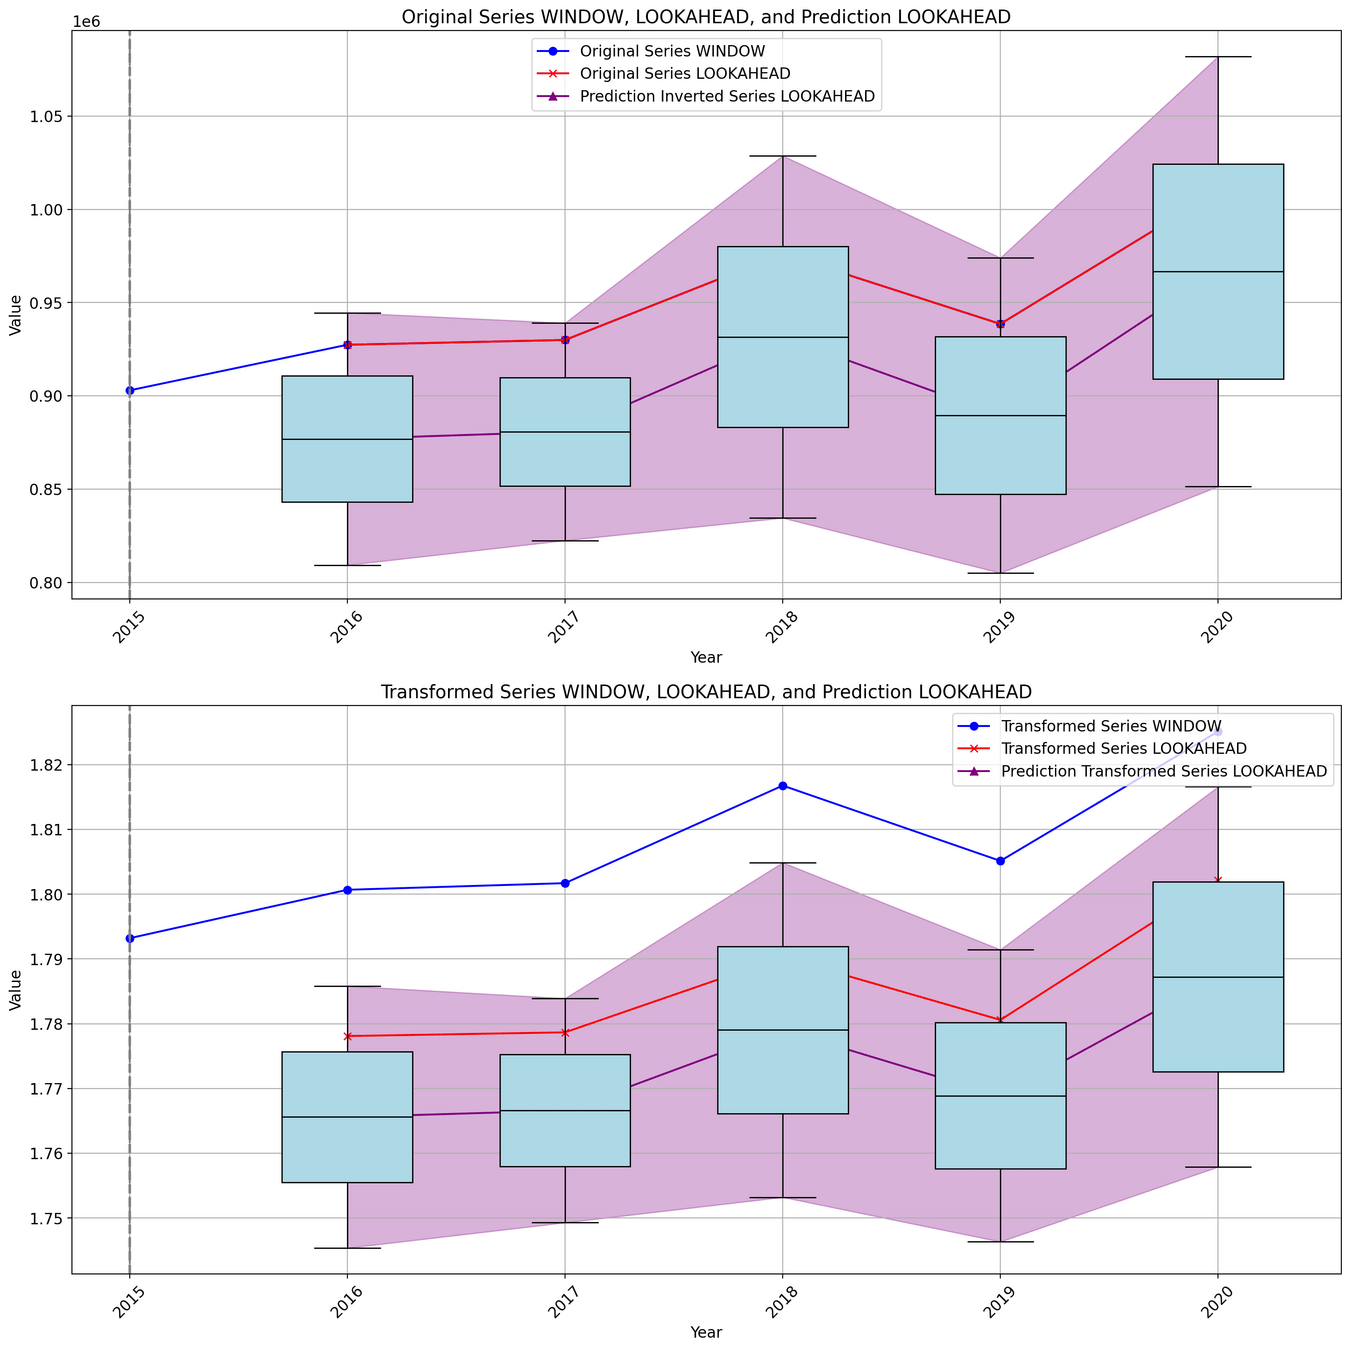
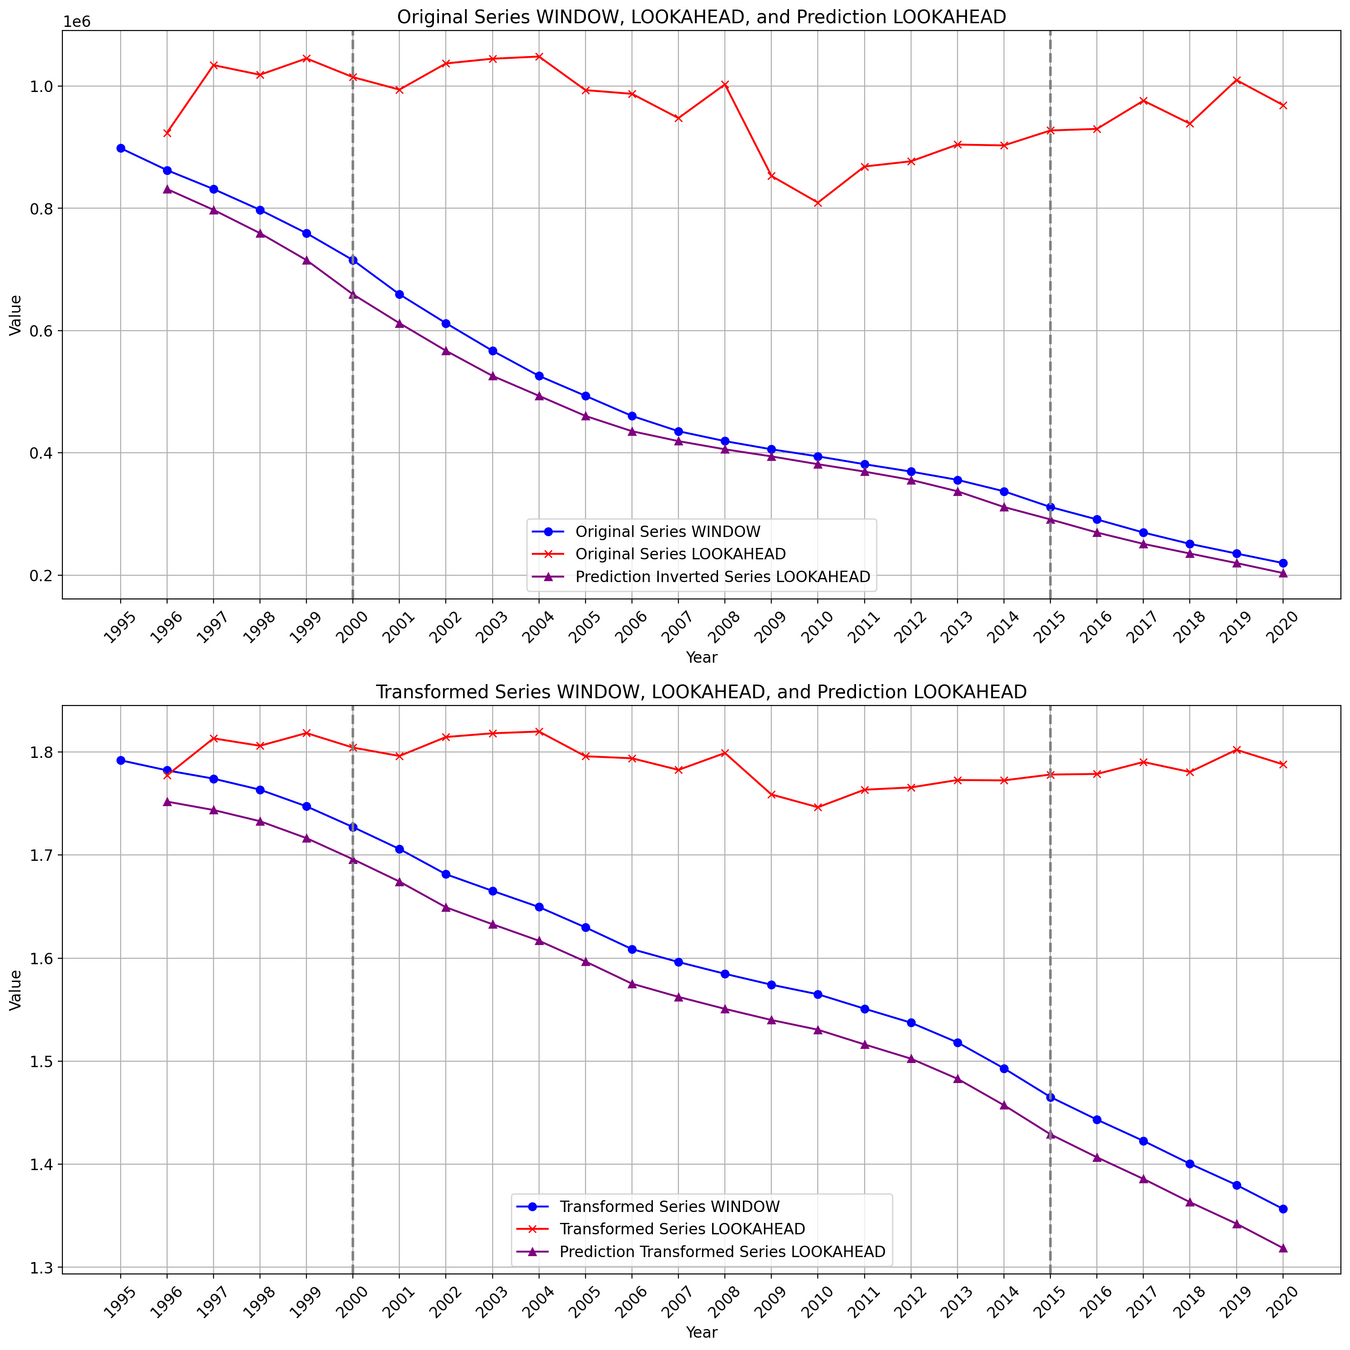
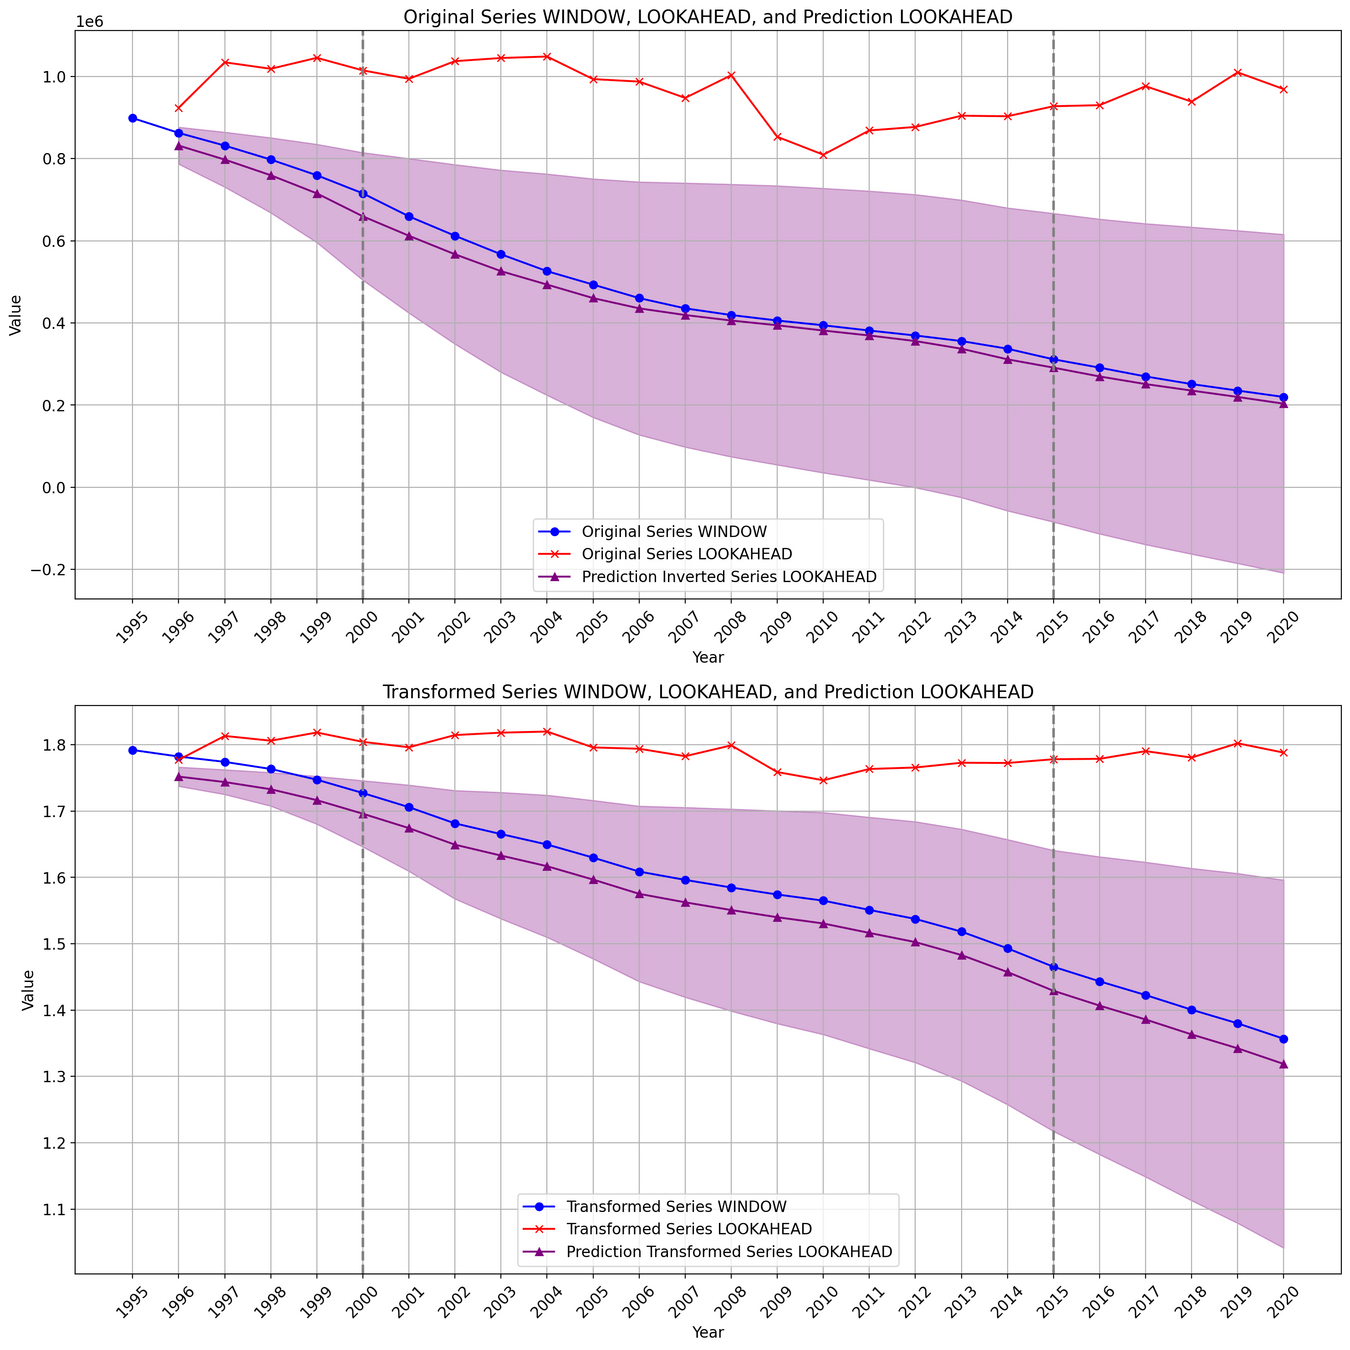
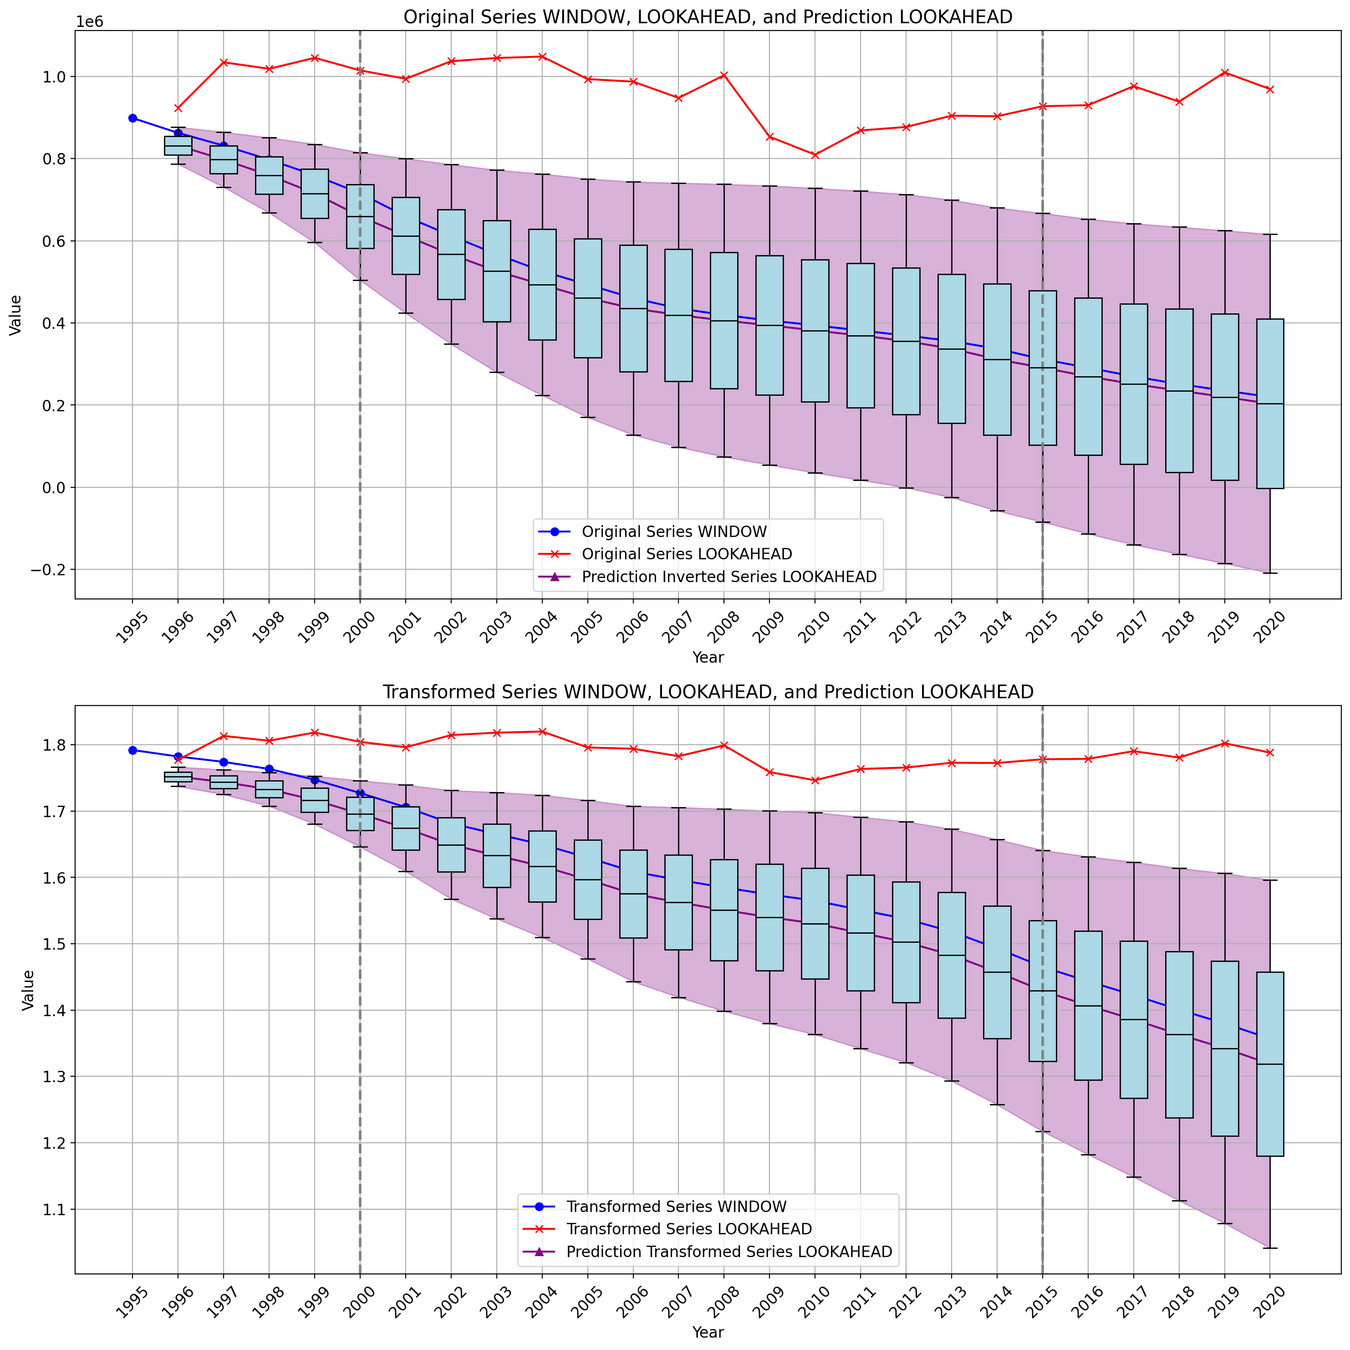
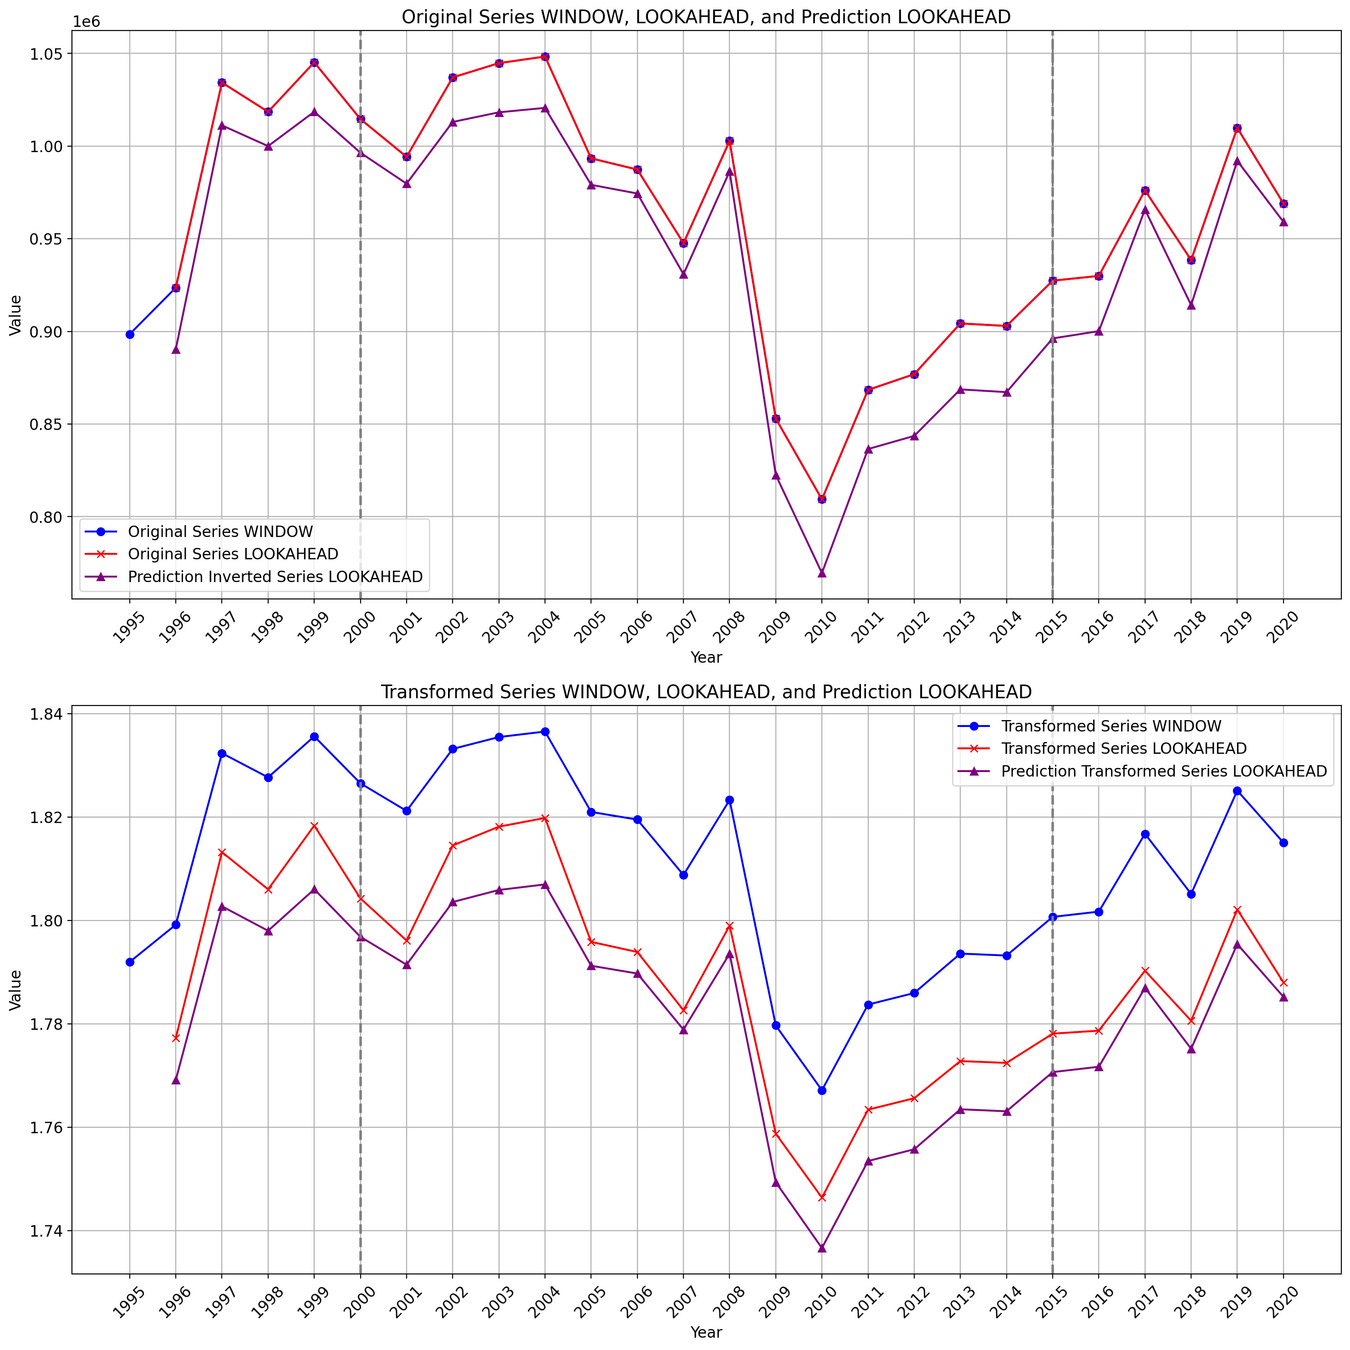
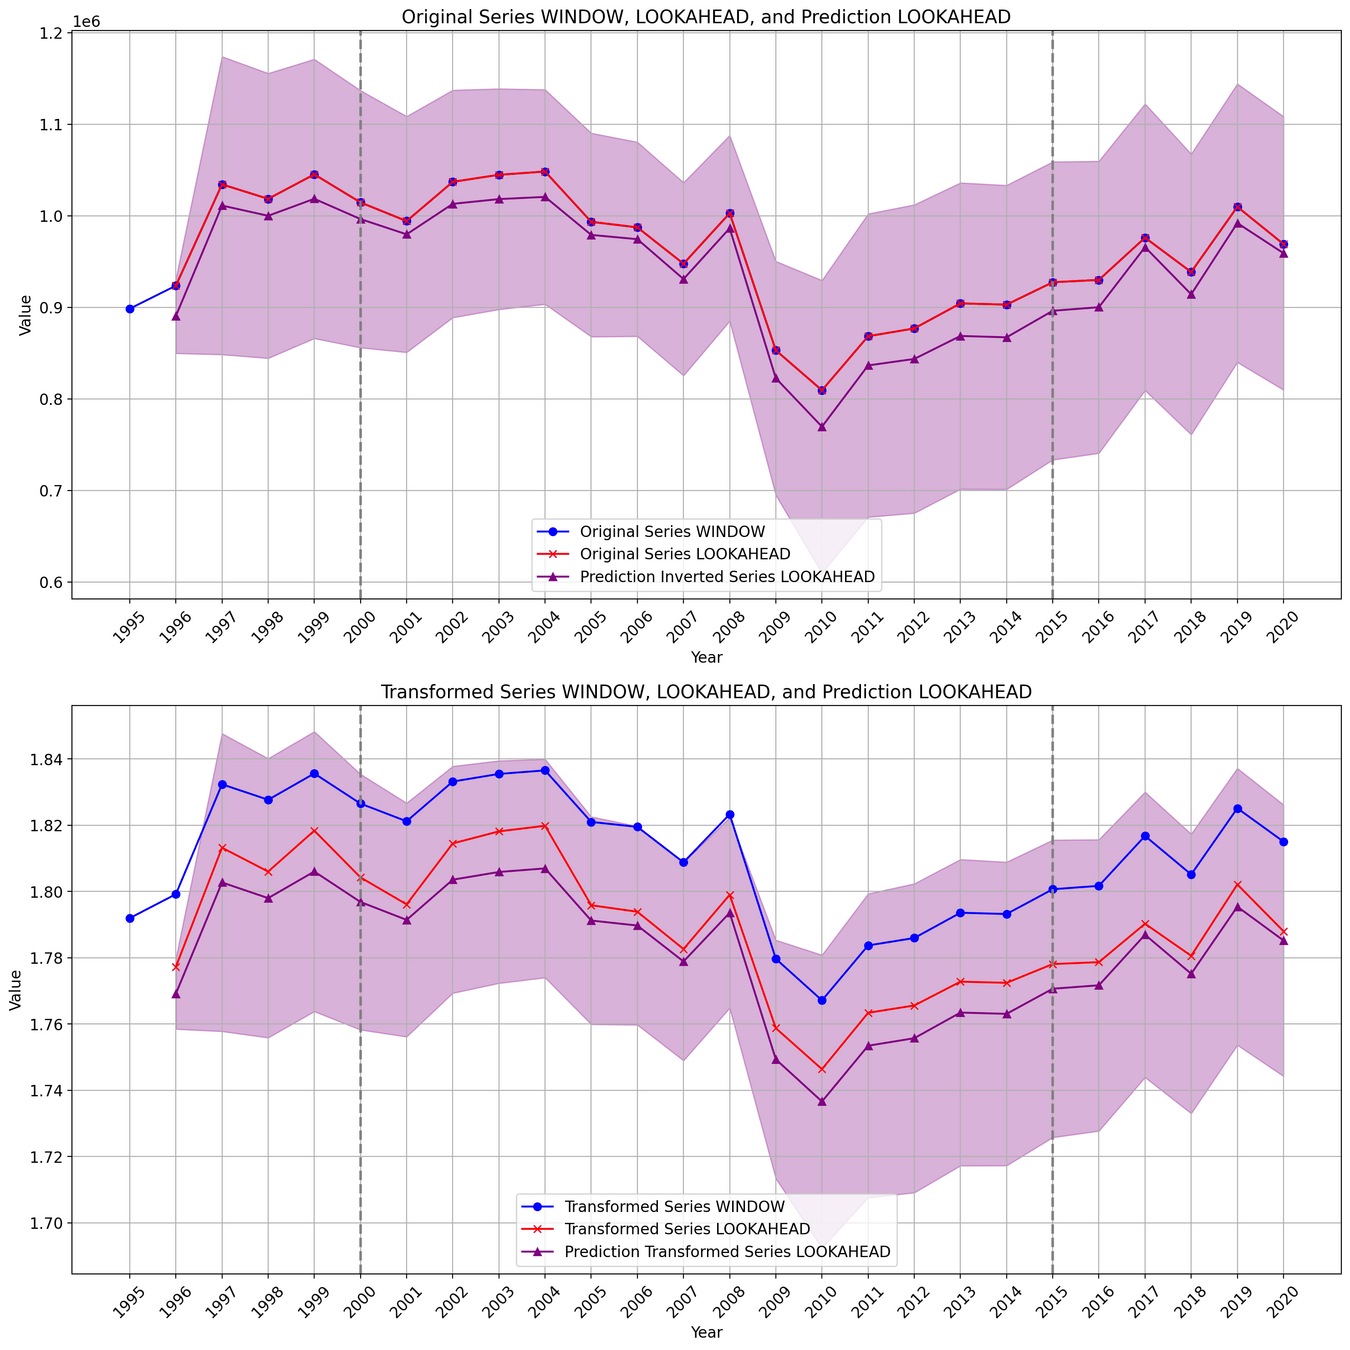
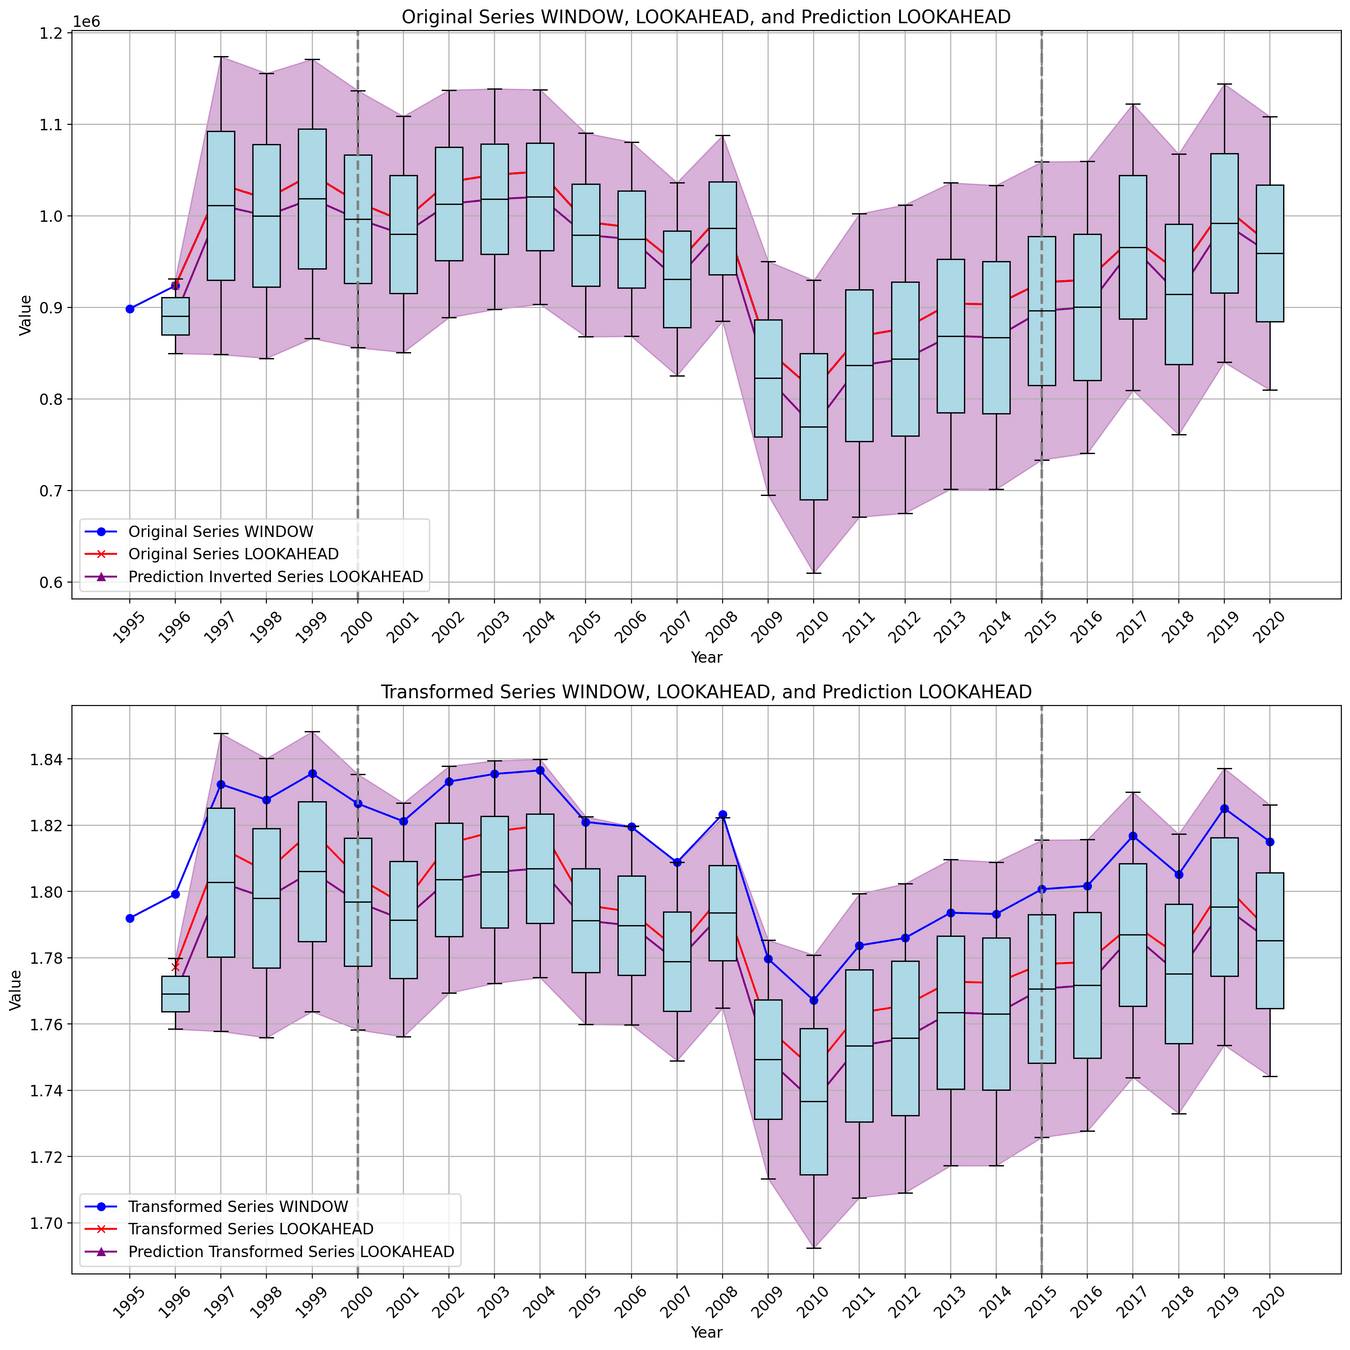
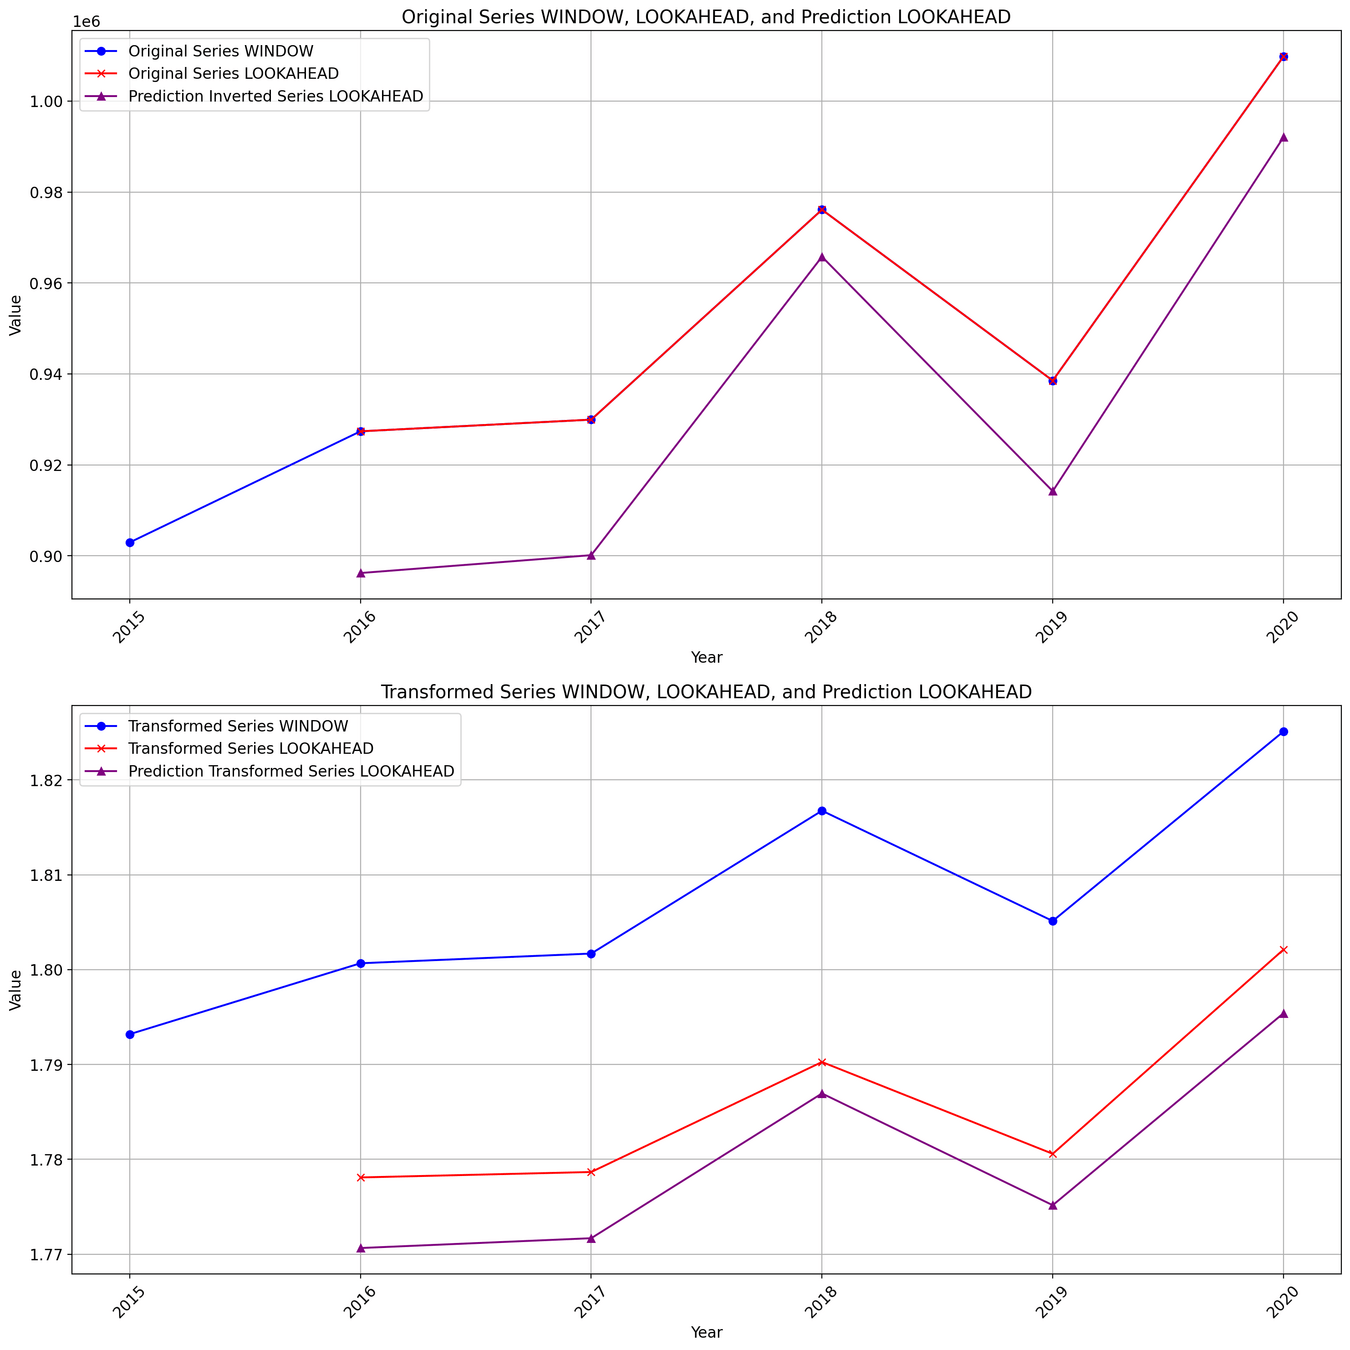
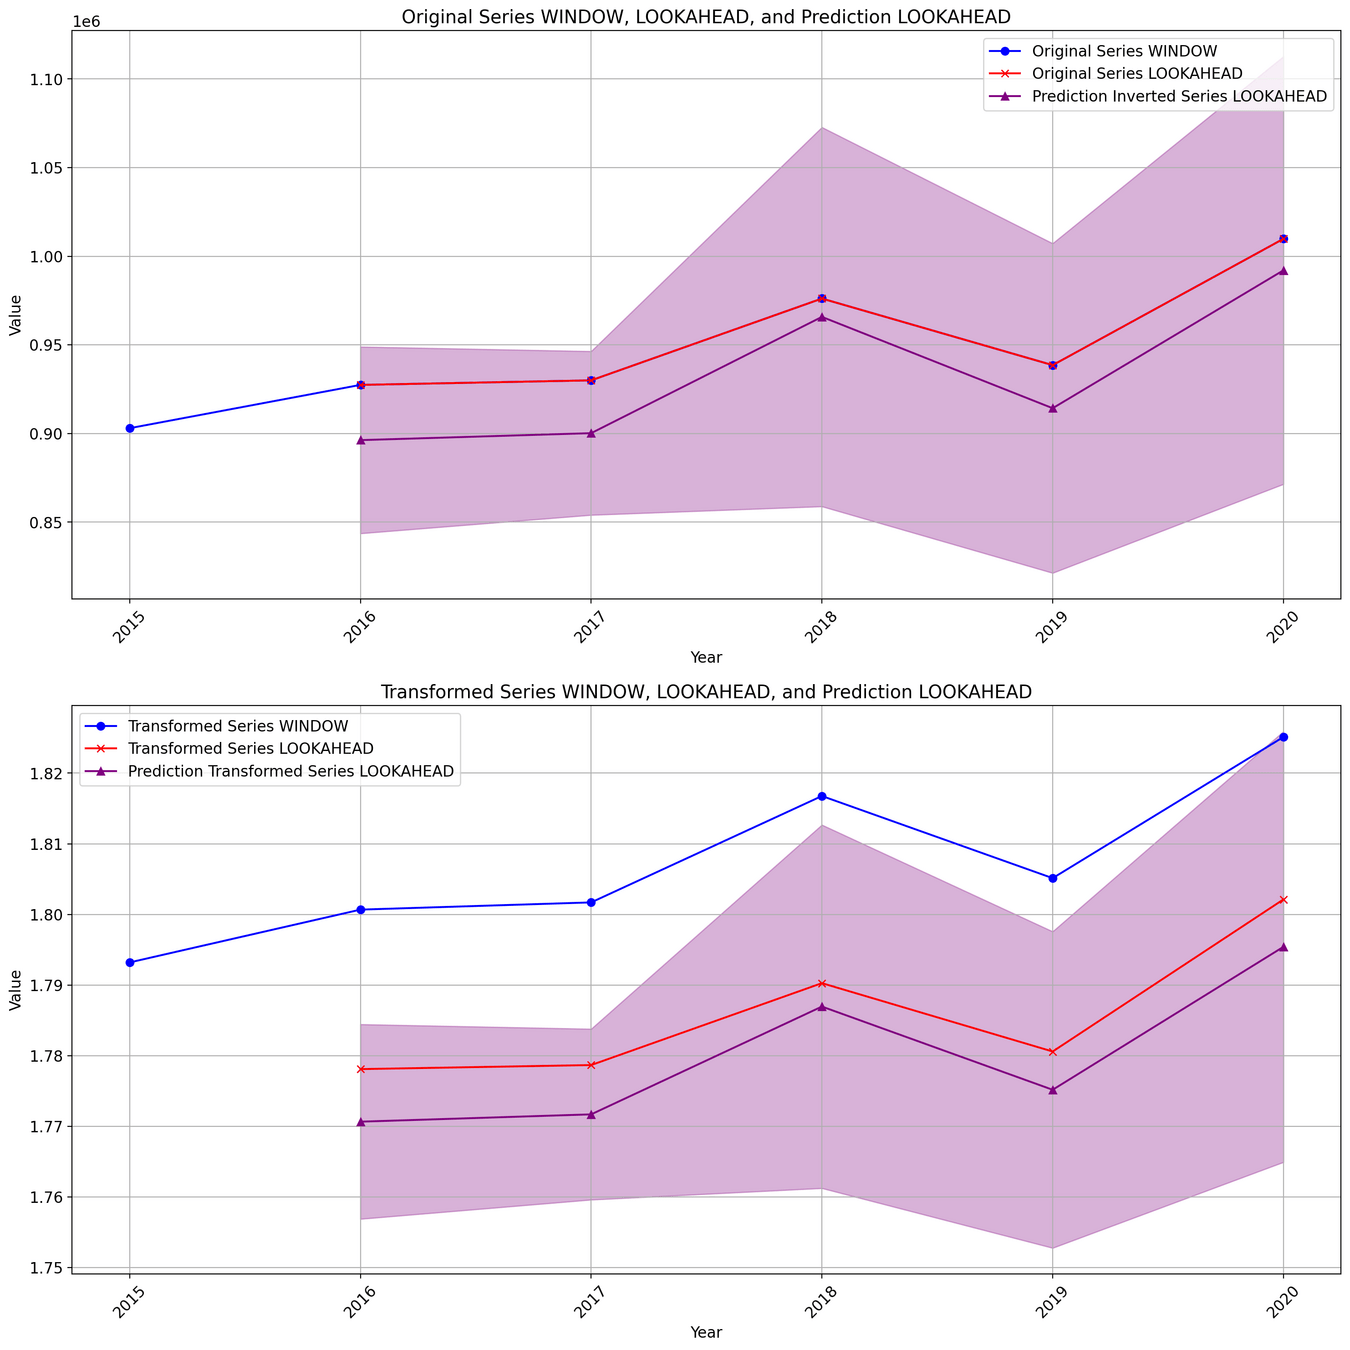
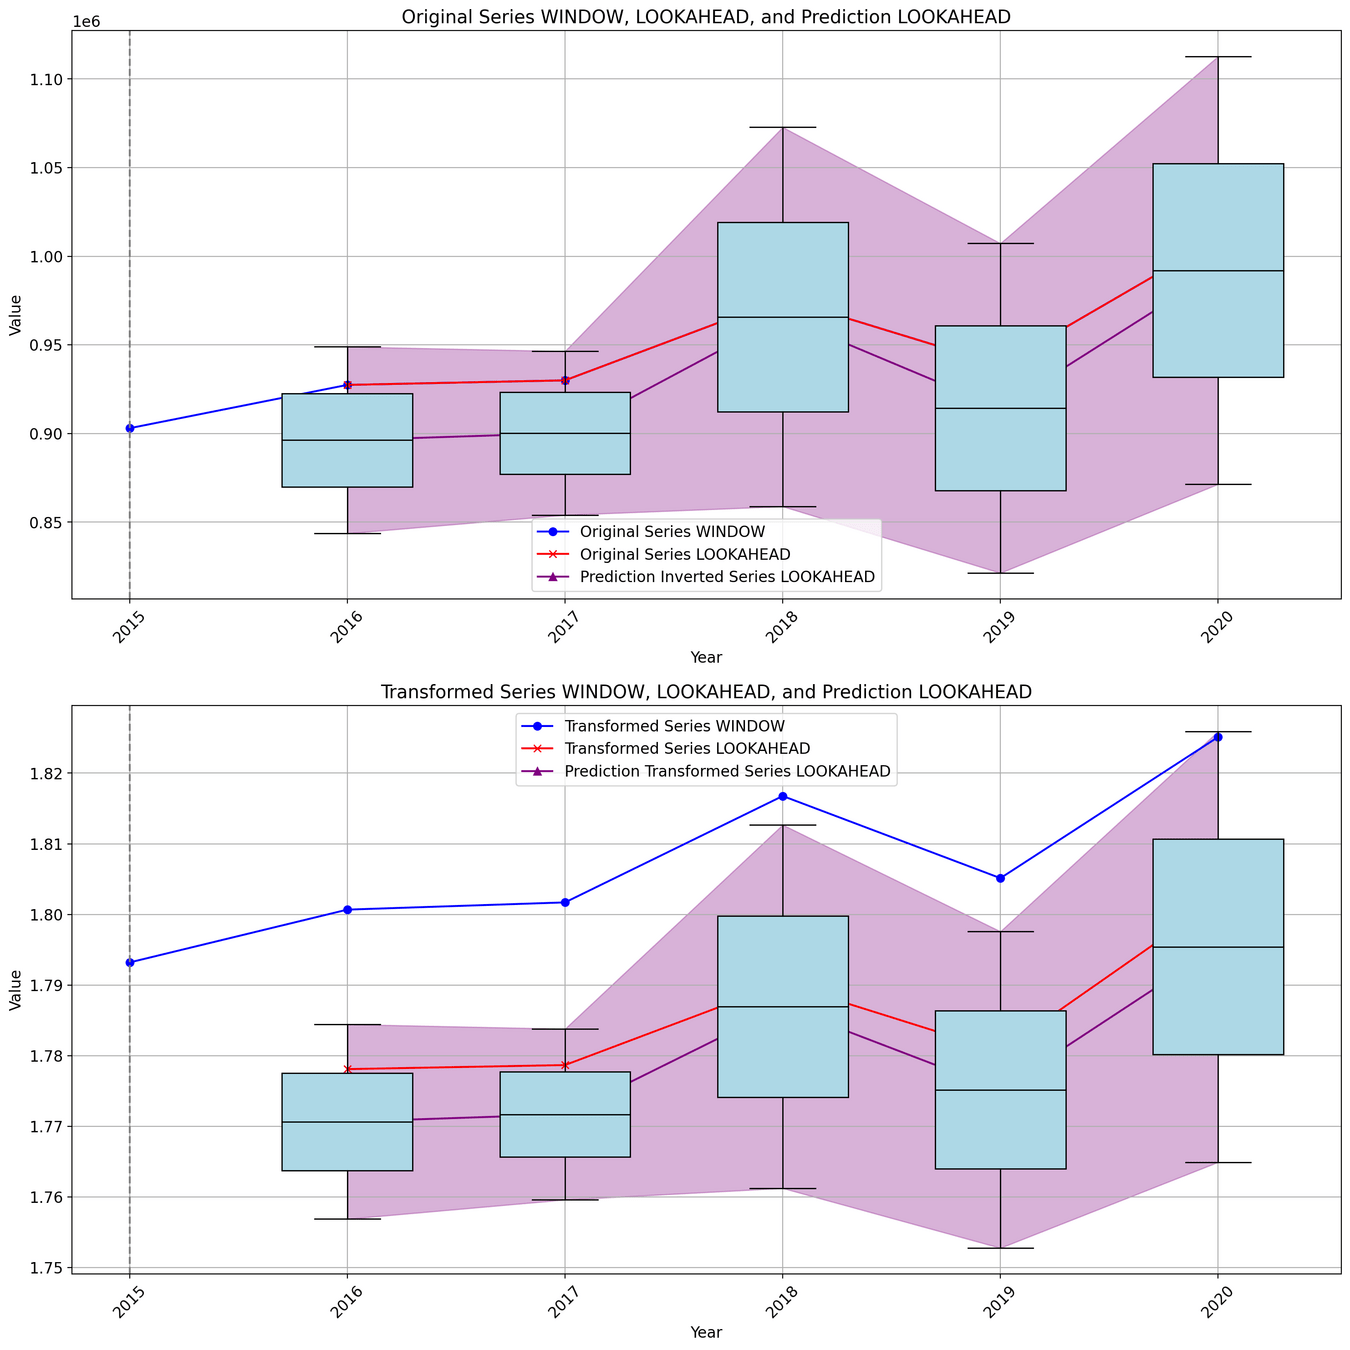
Forecasting approach: sliding window
| 2000 | 2001 | 2002 | ... | 2015 | 2016 | 2017 | 2018 | 2019 | 2020 |
|---|---|---|---|---|---|---|---|---|---|
| 1014592 | 994200 | 1037062 | ... | 929944 |
976112 | 938530 | 1009810 | 969060 | 1066010 |
| 2000 | 2001 | 2002 | ... | 2015 | 2016 | 2017 | 2018 | 2019 | 2020 |
|---|---|---|---|---|---|---|---|---|---|
| 1014592 | 994200 | 1037062 | ... | 929944 |
976112 | 938530 | 1009810 | 969060 | 1066010 |
W=1, L=1
W=2, L=1
W=w, L=l
Forward Time
| 2000 | 2001 | 2002 | ... | 2015 | 2016 | 2017 | 2018 | 2019 | 2020 |
|---|---|---|---|---|---|---|---|---|---|
| 1014592 | 994200 | 1037062 | ... | 929944 |
976112 | 938530 | 1009810 | 969060 | 1066010 |
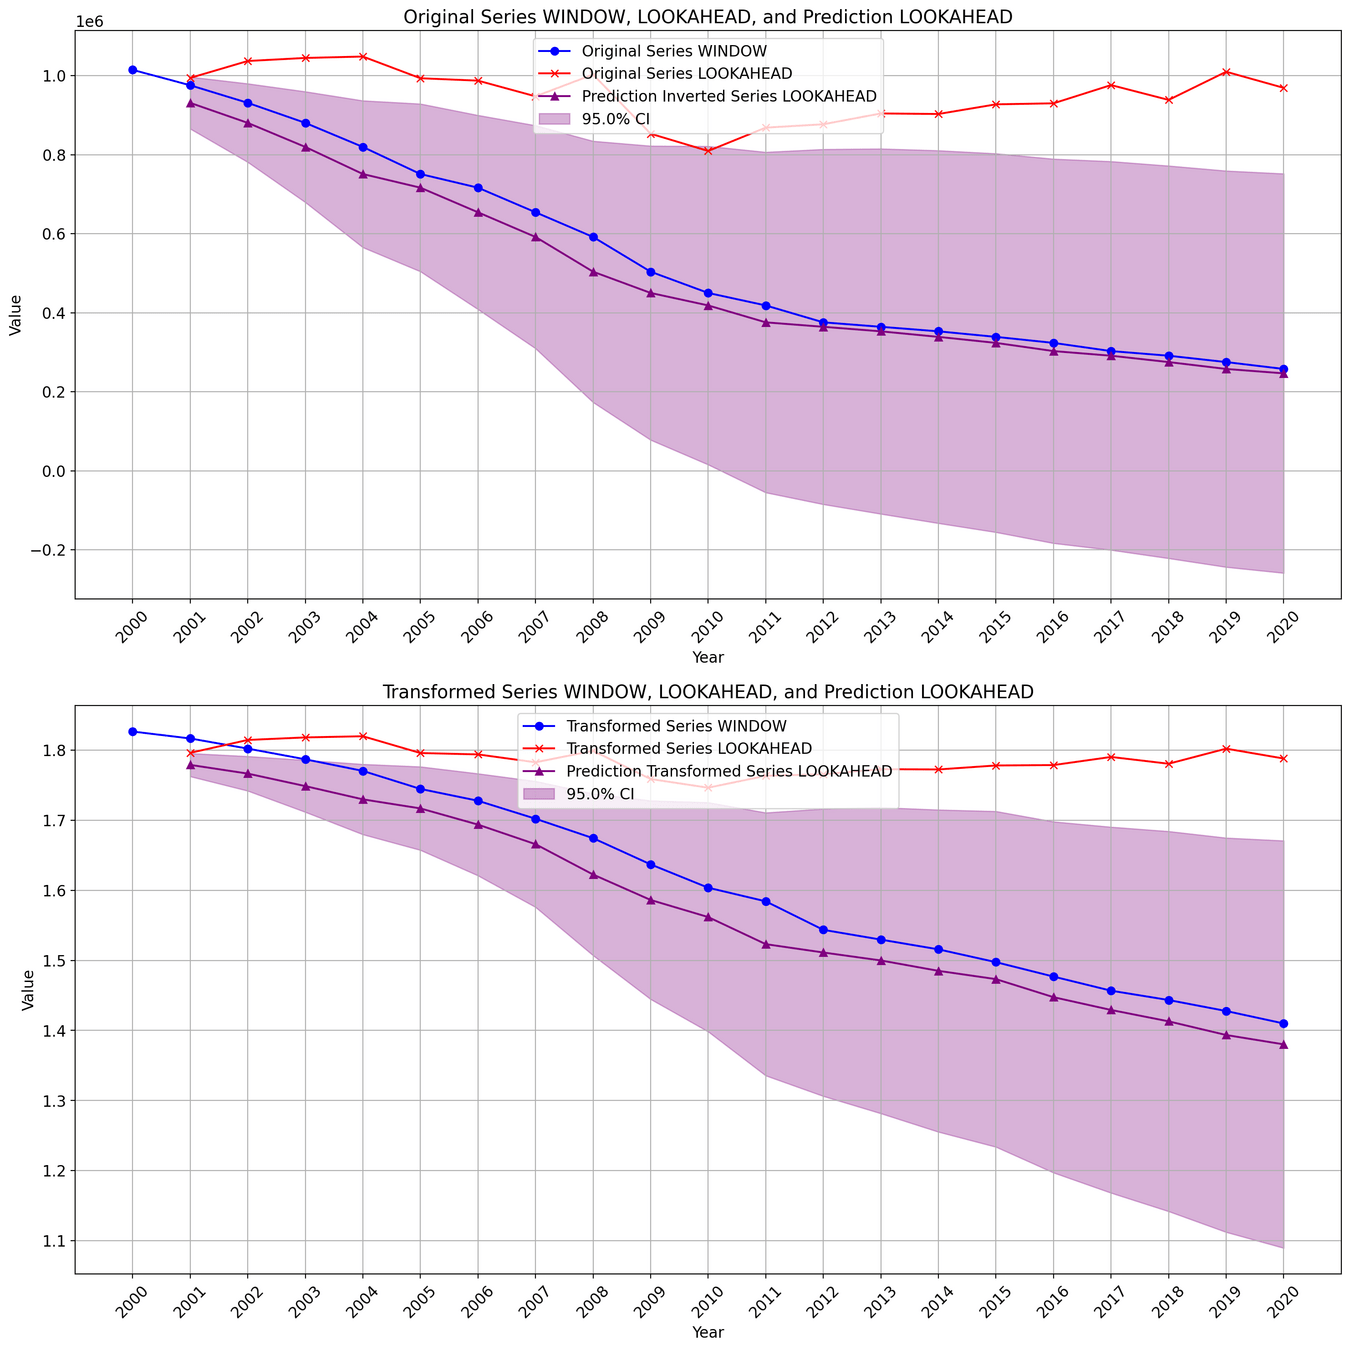
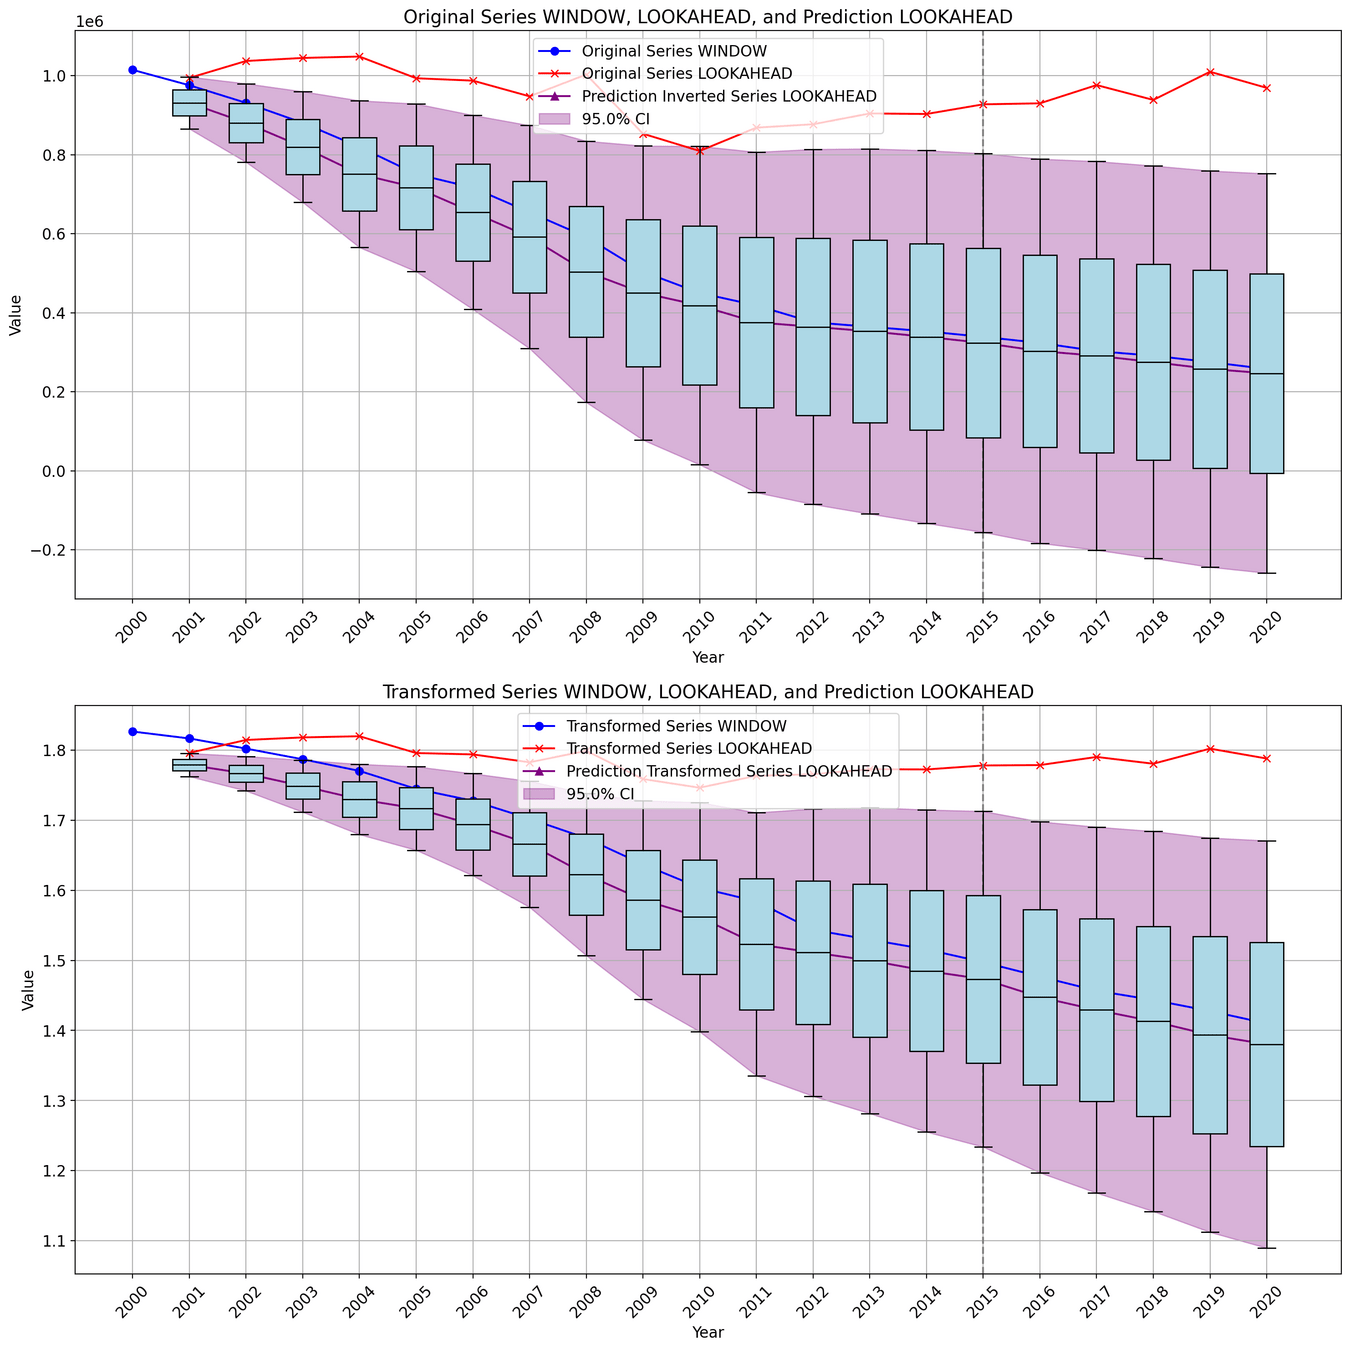
Forecasting approach 1: sliding window
W=1, L=1
Input Data
Forecasting
Train-Test/Val
Naive
Forecasting
Val
Forecasting
Train-Test/Val
Naive
Forecasting
Val
ML approach
DL approach

| 1995 | 1996 | 1997 | ... | 2015 | 2016 | 2017 | 2018 | 2019 | 2020 |
|---|---|---|---|---|---|---|---|---|---|
| 21377 | 18493 | 18424 | ... | 929944 |
976112 | 938530 | 1009810 | 969060 | 1066010 |
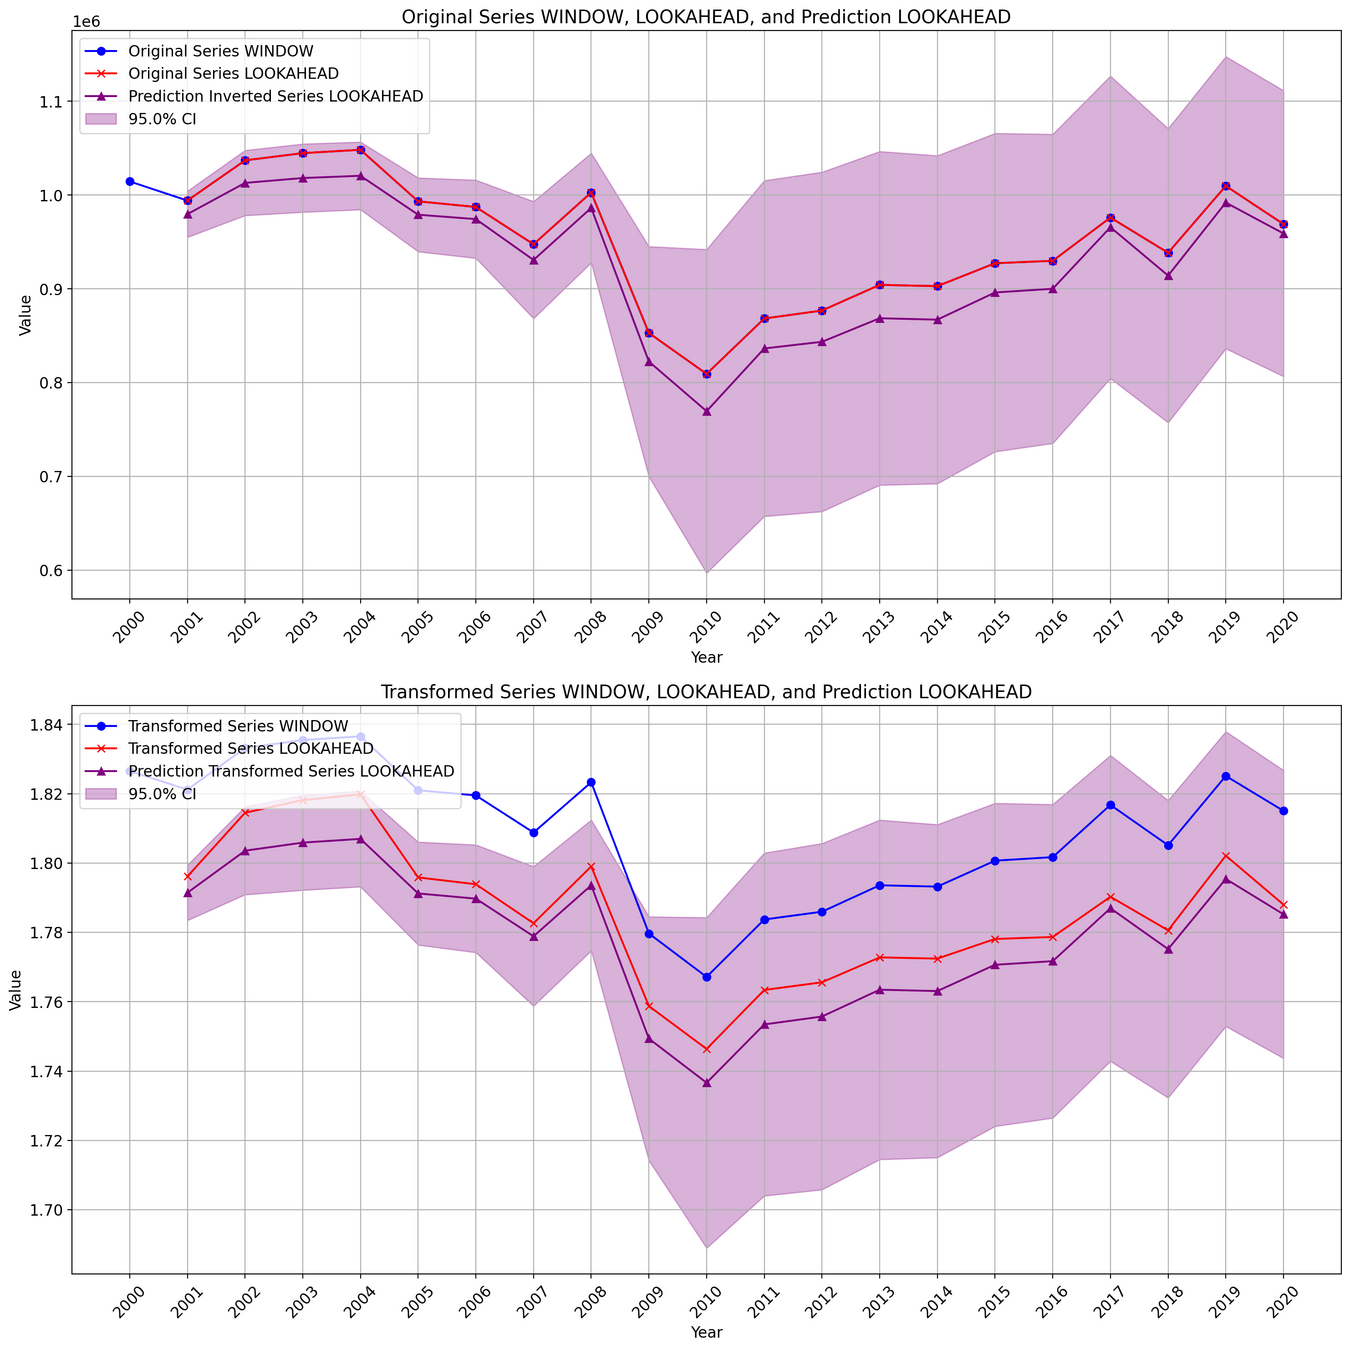
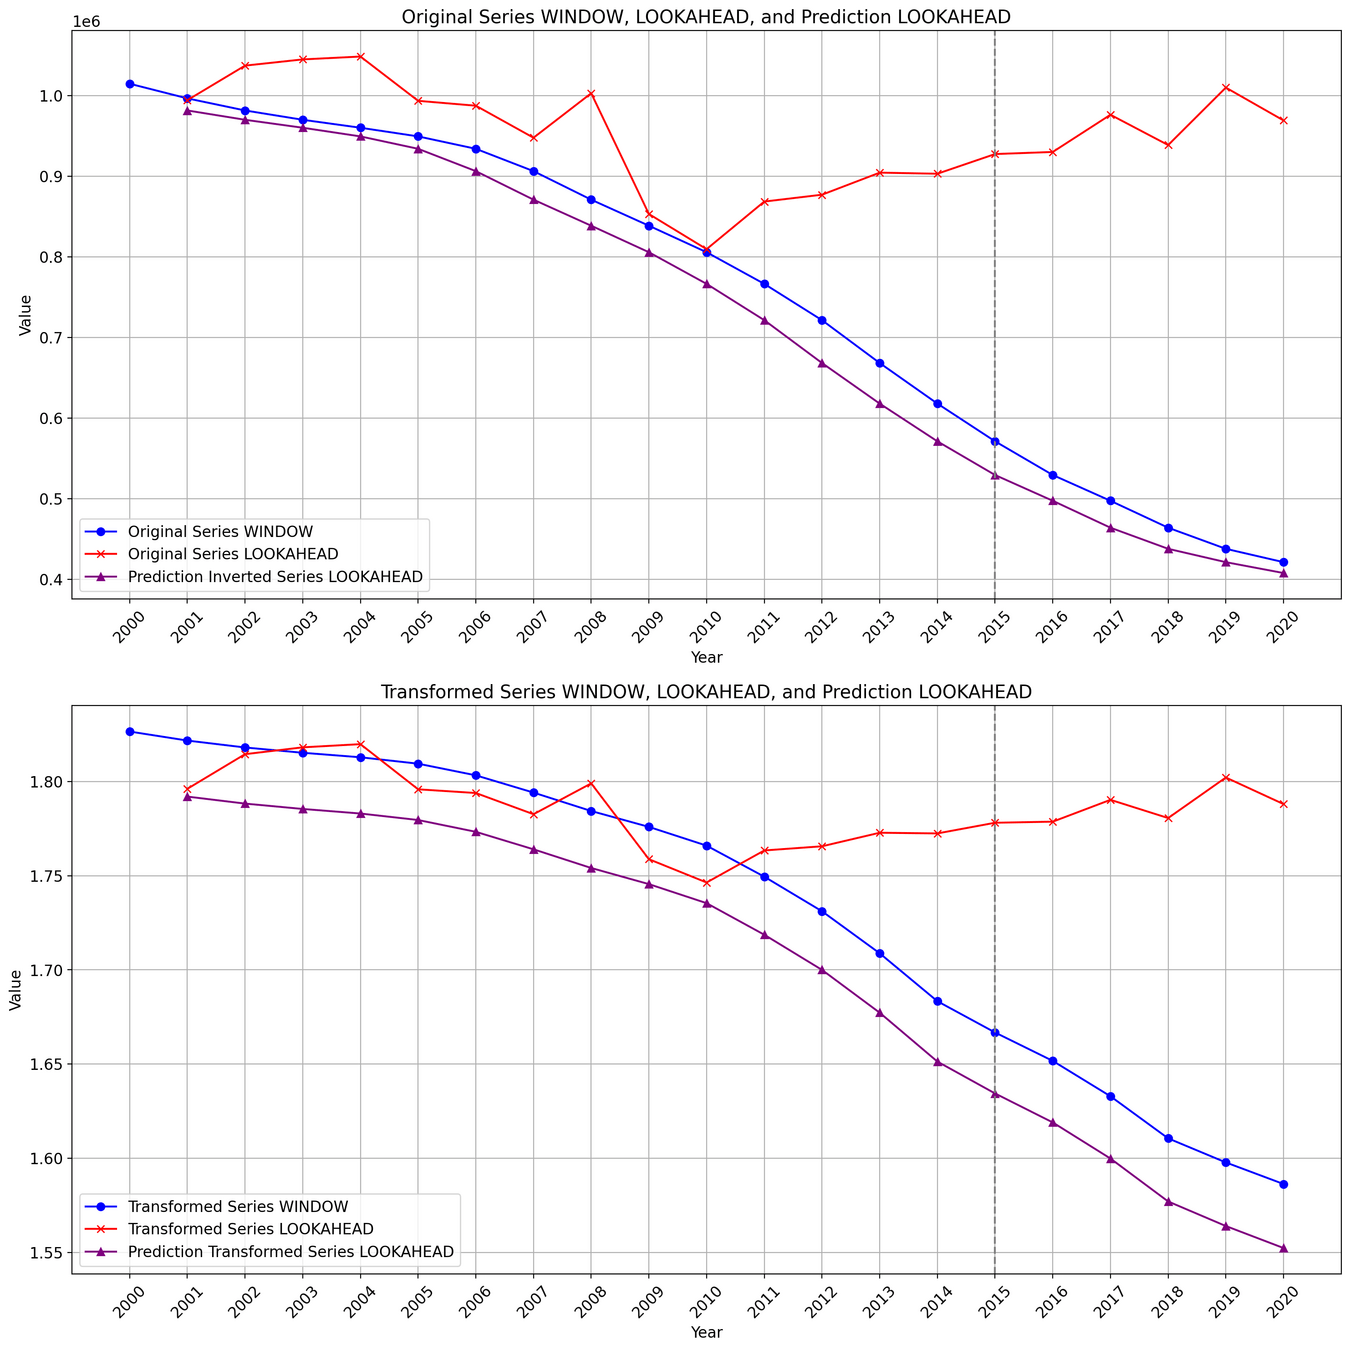
Forecasting approach 2: sliding window
W=1, L=1
Input Data
Forecasting
Train-Test/Val
Naive
Forecasting
Val
Forecasting
Train-Test/Val
Naive
Forecasting
Val
ML approach
DL approach
Learning from time-series data
By jacoboggleon


