Calculus Curve Table Min Max
Aim:
Understand the relation between the shape of \(f’(x)\) and \(f(x)\), how one connects with the other.
Success Looks Like:
Can plot Curve Tables of functions to identify their shape, and can use these to plot the graph of \(f’(x)\) for a given \(f(x)\).
Date:
Time Remaining:
Every value of \(a\) that makes \(f’(a)=0\) is called a “stationary point”
When \(f’(x)\) is negative, \(f(x)\) is decreasing. When \(f’(x)\) is \(0, f(x)\) is stationary. When \(f’(x)\) is positive, \(f(x)\) is increasing.
Minimum: - 0 + “min” for “minus” Maximum: + 0 - "max" has ‘x’→ ‘+’ \ _ / / ‾ \ |
Steps for Constructing ‘Curve Tables” to Analyze Graphs using the Derivative Graph:
1. Differentiate
2. Solve for Zeroes
3. Assign sign of zones (by plugging-in values, visually from the graph, or from patterns)
4. Identify as either minimum, maximum, or turning point.
|
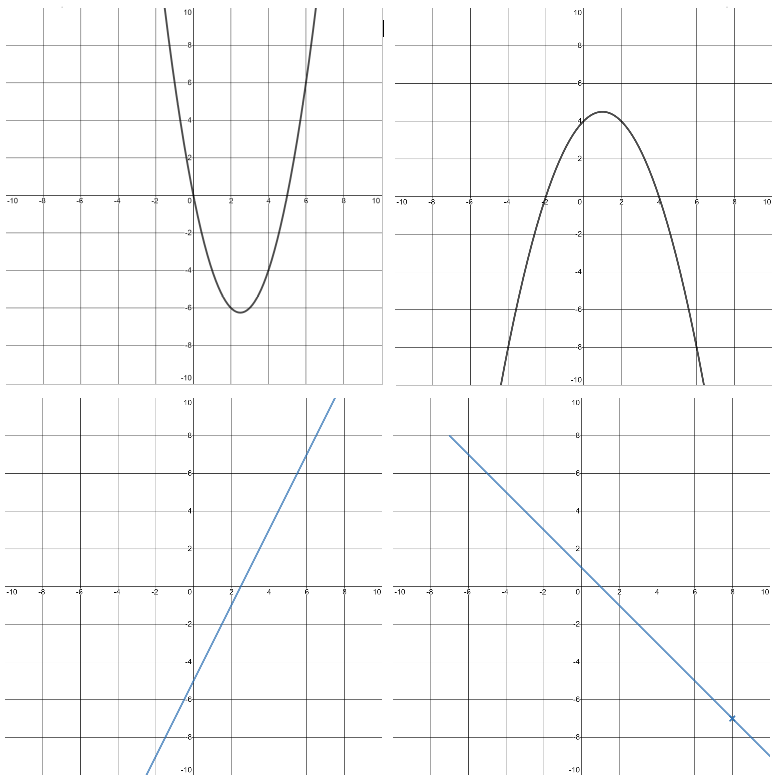
The parabola \(f(x)=x^2-5x\) differentiates to \(f’(x)=2x-5\), with maximum at \(x=\frac{5}{2}\).
The parabola \(f(x)=-\frac{1}{4}(x+2)(x-4)\) differentiates to \(f’(x)=-\frac{1}{2}x+\frac{1}{8}\), with maximum at \(x=1\).
COMPLETE: pg104 Exercises 6L 2–8 finding where functions are positive/negative |
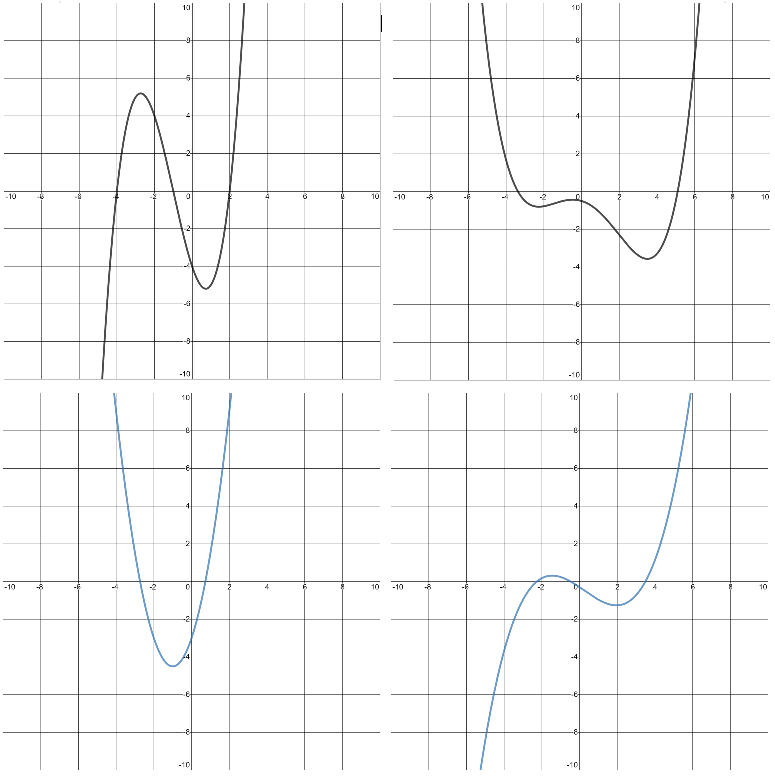
To sketch the graph of \(f’(x)\) from \(f(x)\):
1. Find the stationary and turning points,
2. Assign the sign for each zone, and
3. Connect-up all the details.
COMPLETE:
pg 110 Exercises 6P sketching graph of derivatives
Settings Troubleshooting
There might be some issues with using Mentimeter on iPads.
You will need to 'enable cookies'. And update to the latest iPadOS version.
Go to iPad settings, scroll down to 'Safari', and under the 'Privacy & Security' settings disable "Prevent Cross-Site Tracking" and disable "Block all Cookies."
If you are blocked from editing iPad settings, you'll need to show your parents this Slide and ask for permission to change the settings, so that you can use it interactively for class.

Click this to Show Settings Screenshot
Poll Bakcup
RESULTS
Calculus Differentiation Chain Rule
\begin{array}{ r c c c }
\frac{d}{dx} (ax+b)^{3} & & & \\
ax+b & → & ⬚ ^{3} & \\
& \searrow & & \\
a & \times & 3⬚^{2} & \\
=\ a3(ax+b)^{2} & & &
\end{array}
\begin{array}{ r c c c }
\frac{d}{dx} (ax+b)^{3} & & & \\
ax+b & → & ⬚ ^{3} & \\
& \searrow & & \\
a & \times & 3⬚ ^{2} & \\
=\ a3(ax+b)^{2} & & &
\end{array}\\
\\
\\
\\
\begin{array}{ c c c c c c l }
& & & & & & \frac{d}{dx} (cos^{8}\left( 2x^{2} +1\right) )\\
& & & & & & \\
2x^{2} +1 & → & cos(⬚ ) & → & ⬚ ^{8} & = & cos^{8}\left( 2x^{2} +1\right)\\
& \searrow & & \searrow & & & \\
2\times 2x & \times & -sin(⬚ ) & \times & 8⬚ ^{7} & = & 2\times 2x\times \left( -sin\left( 2x^{2} +1\right)\right) \times \left( 8\left( cos\left( 2x^{2} +1\right)\right)^{7}\right)\\
& & & & & &
\end{array}
Calculus Tangents and Stationary Points
S5 Calculus Curve Table Min Max
By Jay Teach
S5 Calculus Curve Table Min Max
·Understand the relation between the shape of \(f’(x)\) and \(f(x)\), how one connects with the other. · ·Can plot Curve Tables of functions to identify their shape, and can use these to plot the graph of \(f’(x)\) for a given \(f(x)\). ·S5 Class, 2x40min period, end of day, 3 days in a row, usually quite tired. · ·Heinemann Higher Mathematics textbook Chapter6 pg105–111. https://is.gd/ea_21 ·Slides: https://slides.com/jayteach/s5_calc_min_max/fullscreen/ Desmos:https://www.desmos.com/calculator/fxglkpqt4p · · ·# Review yesterday’s content and feedback: · ·# Every value of \(a\) that makes \(f’(a)=0\) is called a “stationary point” · ·When \(f’(x)\) is negative, \(f(x)\) is decreasing. ·When \(f’(x)\) is \(0, f(x)\) is stationary. ·When \(f’(x)\) is positive, \(f(x)\) is increasing. · ·Minimum: - 0 + “min” for “minus” Maximum: + 0 - “max” has ‘x’→ ‘+’ · \ _ / / ‾ \ · ·Steps for Constructing ‘Curve Tables” to Analyze Graphs using the Derivative Graph: ·1. Differentiate ·2. Solve for Zeroes ·3. Assign sign of zones (by plugging-in values, visually from the graph, or from patterns) ·4. Identify as either minimum, maximum, or turning point. ·Use DESMOS to help visualize things · ·# ·pg104 Exercises 6L 2–8 finding where functions are positive/negative · ·The parabola \(f(x)=x^2-5x\) differentiates to \(f’(x)=2x-5\), with maximum at \(x=\frac{5}{2}\). ·The parabola \(f(x)=-\frac{1}{4}(x+2)(x-4)\) differentiates to \(f’(x)=-\frac{1}{2}x+\frac{1}{8}\), with maximum at \(x=1\). [Annotate Printout side 1] · ·# ·To sketch the graph of \(f’(x)\) from \(f(x)\): ·1. Find the stationary and turning points, ·2. Assign the sign for each zone, and ·3. Connect-up all the details. [Annotate Printout side 2] · ·pg110 Exercises 6P sketching graph of derivatives · ·# Same feedback questions as yesterday: Assess self-reported confidence in: ·●Pairing up a particular graph with its derivative graph. ·●Identifying where f’(x) is +,-,0 just by looking at f(x). ·●Sketching f'(x) just by looking at f(x). ·●Using f(x) to explain what happens in f’(x). ·●Using f'(x) to explain what happens in f(x). ·●Using the equation for f'(x) to calculate the rate of change of f(x) at different places.


